Aarhus West (nomination district)
Aarhus West nominating district is one of the 92 nominating districts that exists for Danish elections following the 2007 municipal reform.[3][4][5] It is one of the four nomination districts in Aarhus Municipality, the others being Aarhus South, Aarhus North and Aarhus East.[6] It was created in 1970,[7] with its boundaries being slightly changed in 2007.
| Aarhus West | |
|---|---|
| Aarhus Vest | |
| Nomination district constituency for the Folketing | |
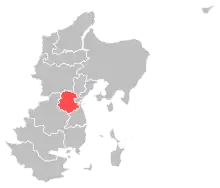 Location of Aarhus West within East Jutland | |
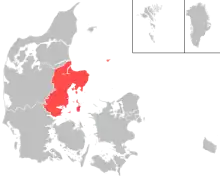 Location of East Jutland within Denmark | |
| Municipalities | Aarhus |
| Constituency | East Jutland |
| Electorate | 62,229 (2022)[1] |
| Current constituency | |
| Created | 1970[2] |
In general elections, the district is a strong area for parties commonly associated with the red bloc, and the Social Democrats has always won the most votes. [8]
General elections results
General elections in the 2020s
| Parties | Vote | |||||
|---|---|---|---|---|---|---|
| Votes | % | + / - | ||||
| Social Democrats | 13,291 | 26.98 | +0.89 | |||
| Venstre | 5,337 | 10.84 | -5.95 | |||
| Green Left | 5,101 | 10.36 | +1.45 | |||
| Liberal Alliance | 4,379 | 8.89 | +6.51 | |||
| Moderates | 4,125 | 8.37 | New | |||
| Red–Green Alliance | 3,610 | 7.33 | -2.08 | |||
| Social Liberals | 2,673 | 5.43 | -9.12 | |||
| Denmark Democrats | 2,270 | 4.61 | New | |||
| Conservatives | 2,121 | 4.31 | -0.74 | |||
| The Alternative | 2,048 | 4.16 | +0.55 | |||
| Independent Greens | 1,821 | 3.70 | New | |||
| New Right | 1,320 | 2.68 | +0.70 | |||
| Danish People's Party | 805 | 1.63 | -4.99 | |||
| Christian Democrats | 301 | 0.61 | -1.69 | |||
| Jesper Antonsen | 31 | 0.06 | New | |||
| Chresten H. Ibsen | 22 | 0.04 | -0.12 | |||
| Total | 49,255 | |||||
| Source[9] | ||||||
General elections in the 2010s
| Parties | Vote | |||||
|---|---|---|---|---|---|---|
| Votes | % | + / - | ||||
| Social Democrats | 13,059 | 26.09 | -4.23 | |||
| Venstre | 8,404 | 16.79 | +2.03 | |||
| Social Liberals | 7,285 | 14.55 | +9.23 | |||
| Red–Green Alliance | 4,709 | 9.41 | -0.43 | |||
| Green Left | 4,458 | 8.91 | +4.01 | |||
| Danish People's Party | 3,315 | 6.62 | -9.79 | |||
| Conservatives | 2,527 | 5.05 | +2.29 | |||
| The Alternative | 1,809 | 3.61 | -3.49 | |||
| Liberal Alliance | 1,191 | 2.38 | -4.62 | |||
| Christian Democrats | 1,149 | 2.30 | +1.12 | |||
| New Right | 992 | 1.98 | New | |||
| Stram Kurs | 749 | 1.50 | New | |||
| Klaus Riskær Pedersen Party | 322 | 0.64 | New | |||
| Chresten H. Ibsen | 78 | 0.16 | New | |||
| Hans Schultz | 7 | 0.01 | New | |||
| Total | 50,054 | |||||
| Source[10] | ||||||
| Parties | Vote | |||||
|---|---|---|---|---|---|---|
| Votes | % | + / - | ||||
| Social Democrats | 14,570 | 30.32 | -0.01 | |||
| Danish People's Party | 7,884 | 16.41 | +6.51 | |||
| Venstre | 7,091 | 14.76 | -7.09 | |||
| Red–Green Alliance | 4,730 | 9.84 | +1.84 | |||
| The Alternative | 3,410 | 7.10 | New | |||
| Liberal Alliance | 3,362 | 7.00 | +2.87 | |||
| Social Liberals | 2,555 | 5.32 | -6.13 | |||
| Green Left | 2,355 | 4.90 | -5.08 | |||
| Conservatives | 1,325 | 2.76 | -0.82 | |||
| Christian Democrats | 569 | 1.18 | +0.53 | |||
| Yahya Hassan | 178 | 0.37 | New | |||
| Peter Ymer Nielsen | 19 | 0.04 | New | |||
| Poul Gundersen | 7 | 0.01 | New | |||
| Total | 48,055 | |||||
| Source[11] | ||||||
| Parties | Vote | |||||
|---|---|---|---|---|---|---|
| Votes | % | + / - | ||||
| Social Democrats | 14,810 | 30.33 | -0.56 | |||
| Venstre | 10,669 | 21.85 | +1.10 | |||
| Social Liberals | 5,591 | 11.45 | +6.27 | |||
| Green Left | 4,872 | 9.98 | -5.45 | |||
| Danish People's Party | 4,832 | 9.90 | -2.28 | |||
| Red–Green Alliance | 3,908 | 8.00 | +4.17 | |||
| Liberal Alliance | 2,015 | 4.13 | +1.24 | |||
| Conservatives | 1,750 | 3.58 | -4.34 | |||
| Christian Democrats | 315 | 0.65 | -0.24 | |||
| Ibrahim Gøkhan | 45 | 0.09 | New | |||
| Janus Kramer Møller | 15 | 0.03 | New | |||
| Total | 48,822 | |||||
| Source[12] | ||||||
General elections in the 2000s
| Parties | Vote | |||||
|---|---|---|---|---|---|---|
| Votes | % | + / - | ||||
| Social Democrats | 14,431 | 30.89 | -1.59 | |||
| Venstre | 9,694 | 20.75 | -0.61 | |||
| Green Left | 7,208 | 15.43 | +8.69 | |||
| Danish People's Party | 5,691 | 12.18 | +0.46 | |||
| Conservatives | 3,701 | 7.92 | -1.23 | |||
| Social Liberals | 2,420 | 5.18 | -5.70 | |||
| Red–Green Alliance | 1,788 | 3.83 | -0.49 | |||
| New Alliance | 1,351 | 2.89 | New | |||
| Christian Democrats | 417 | 0.89 | -1.02 | |||
| Jes Krogh | 11 | 0.02 | New | |||
| Total | 46,712 | |||||
| Source[13] | ||||||
| Parties | Vote | |||||
|---|---|---|---|---|---|---|
| Votes | % | + / - | ||||
| Social Democrats | 17,153 | 32.48 | -2.58 | |||
| Venstre | 11,281 | 21.36 | -3.97 | |||
| Danish People's Party | 6,189 | 11.72 | +0.38 | |||
| Social Liberals | 5,746 | 10.88 | +5.45 | |||
| Conservatives | 4,833 | 9.15 | +2.01 | |||
| Green Left | 3,559 | 6.74 | -0.48 | |||
| Red–Green Alliance | 2,281 | 4.32 | +0.84 | |||
| Christian Democrats | 1,006 | 1.91 | -0.67 | |||
| Centre Democrats | 527 | 1.00 | -0.85 | |||
| Minority Party | 215 | 0.41 | New | |||
| Janus Kramer Møller | 17 | 0.03 | New | |||
| Total | 52,807 | |||||
| Source[14] | ||||||
| Parties | Vote | |||||
|---|---|---|---|---|---|---|
| Votes | % | + / - | ||||
| Social Democrats | 18,718 | 35.06 | -7.08 | |||
| Venstre | 13,524 | 25.33 | +5.28 | |||
| Danish People's Party | 6,057 | 11.34 | +4.09 | |||
| Green Left | 3,855 | 7.22 | -1.26 | |||
| Conservatives | 3,814 | 7.14 | +0.18 | |||
| Social Liberals | 2,898 | 5.43 | +1.73 | |||
| Red–Green Alliance | 1,860 | 3.48 | -0.03 | |||
| Christian People's Party | 1,379 | 2.58 | +0.34 | |||
| Centre Democrats | 989 | 1.85 | -2.06 | |||
| Progress Party | 285 | 0.53 | -0.82 | |||
| Lars Bang | 16 | 0.03 | New | |||
| Total | 53,395 | |||||
| Source[15] | ||||||
General elections in the 1990s
| Parties | Vote | |||||
|---|---|---|---|---|---|---|
| Votes | % | + / - | ||||
| Social Democrats | 21,741 | 42.14 | +4.99 | |||
| Venstre | 10,345 | 20.05 | +0.87 | |||
| Green Left | 4,376 | 8.48 | +0.50 | |||
| Danish People's Party | 3,740 | 7.25 | New | |||
| Conservatives | 3,589 | 6.96 | -4.44 | |||
| Centre Democrats | 2,016 | 3.91 | +1.30 | |||
| Social Liberals | 1,911 | 3.70 | -0.51 | |||
| Red–Green Alliance | 1,812 | 3.51 | +0.15 | |||
| Christian People's Party | 1,154 | 2.24 | +0.52 | |||
| Progress Party | 694 | 1.35 | -4.31 | |||
| Democratic Renewal | 202 | 0.39 | New | |||
| John Juhler | 17 | 0.03 | New | |||
| Total | 51,597 | |||||
| Source[16] | ||||||
| Parties | Vote | |||||
|---|---|---|---|---|---|---|
| Votes | % | + / - | ||||
| Social Democrats | 19,182 | 37.15 | -2.28 | |||
| Venstre | 9,906 | 19.18 | +4.89 | |||
| Conservatives | 5,887 | 11.40 | -0.58 | |||
| Green Left | 4,119 | 7.98 | -3.33 | |||
| Jacob Haugaard | 3,449 | 6.68 | +3.95 | |||
| Progress Party | 2,922 | 5.66 | +0.16 | |||
| Social Liberals | 2,175 | 4.21 | +0.68 | |||
| Red–Green Alliance | 1,737 | 3.36 | +0.99 | |||
| Centre Democrats | 1,350 | 2.61 | -2.15 | |||
| Christian People's Party | 889 | 1.72 | +0.03 | |||
| Søren Boelskifte | 15 | 0.03 | New | |||
| Bjarne S. Landsfeldt | 4 | 0.01 | New | |||
| Total | 51,635 | |||||
| Source[17] | ||||||
| Parties | Vote | |||||
|---|---|---|---|---|---|---|
| Votes | % | + / - | ||||
| Social Democrats | 19,667 | 39.43 | +6.72 | |||
| Venstre | 7,129 | 14.29 | +4.57 | |||
| Conservatives | 5,974 | 11.98 | -4.29 | |||
| Green Left | 5,641 | 11.31 | -5.88 | |||
| Progress Party | 2,741 | 5.50 | -1.36 | |||
| Centre Democrats | 2,376 | 4.76 | +0.48 | |||
| Social Liberals | 1,763 | 3.53 | -2.24 | |||
| Jacob Haugaard | 1,362 | 2.73 | +1.72 | |||
| Red–Green Alliance | 1,183 | 2.37 | New | |||
| Christian People's Party | 841 | 1.69 | +0.22 | |||
| Common Course | 471 | 0.94 | -0.26 | |||
| The Greens | 423 | 0.85 | -0.27 | |||
| Justice Party of Denmark | 309 | 0.62 | New | |||
| Total | 49,880 | |||||
| Source[18] | ||||||
General elections in the 1980s
| Parties | Vote | |||||
|---|---|---|---|---|---|---|
| Votes | % | + / - | ||||
| Social Democrats | 16,527 | 32.71 | +1.52 | |||
| Green Left | 8,686 | 17.19 | -2.00 | |||
| Conservatives | 8,219 | 16.27 | -0.46 | |||
| Venstre | 4,911 | 9.72 | +1.80 | |||
| Progress Party | 3,467 | 6.86 | +3.19 | |||
| Social Liberals | 2,915 | 5.77 | -1.19 | |||
| Centre Democrats | 2,164 | 4.28 | -0.21 | |||
| Christian People's Party | 741 | 1.47 | -0.19 | |||
| Communist Party of Denmark | 642 | 1.27 | -0.03 | |||
| Common Course | 608 | 1.20 | -0.46 | |||
| The Greens | 567 | 1.12 | -0.05 | |||
| Left Socialists | 564 | 1.12 | -1.38 | |||
| Jacob Haugaard | 508 | 1.01 | +0.27 | |||
| Finn Mikkelsen | 8 | 0.02 | New | |||
| Bruno Nielsen-Boreas | 0 | 0.00 | New | |||
| Total | 50,527 | |||||
| Source[19] | ||||||
| Parties | Vote | |||||
|---|---|---|---|---|---|---|
| Votes | % | + / - | ||||
| Social Democrats | 15,856 | 31.19 | -1.48 | |||
| Green Left | 9,759 | 19.19 | +1.93 | |||
| Conservatives | 8,506 | 16.73 | -2.94 | |||
| Venstre | 4,028 | 7.92 | -1.02 | |||
| Social Liberals | 3,540 | 6.96 | +1.16 | |||
| Centre Democrats | 2,283 | 4.49 | +0.40 | |||
| Progress Party | 1,868 | 3.67 | +1.63 | |||
| Left Socialists | 1,273 | 2.50 | -2.15 | |||
| Common Course | 845 | 1.66 | New | |||
| Christian People's Party | 844 | 1.66 | +0.09 | |||
| Communist Party of Denmark | 659 | 1.30 | +0.27 | |||
| The Greens | 595 | 1.17 | New | |||
| Jacob Haugaard | 375 | 0.74 | +0.54 | |||
| Justice Party of Denmark | 295 | 0.58 | -1.39 | |||
| Humanist Party | 71 | 0.14 | New | |||
| Socialist Workers Party | 23 | 0.05 | -0.02 | |||
| Marxist–Leninists Party | 17 | 0.03 | 0.00 | |||
| Henning Brønd-Nielsen | 6 | 0.01 | New | |||
| Total | 50,843 | |||||
| Source[20] | ||||||
| Parties | Vote | |||||
|---|---|---|---|---|---|---|
| Votes | % | + / - | ||||
| Social Democrats | 16,497 | 32.67 | -3.20 | |||
| Conservatives | 9,934 | 19.67 | +6.14 | |||
| Green Left | 8,715 | 17.26 | -0.72 | |||
| Venstre | 4,515 | 8.94 | +7.36 | |||
| Social Liberals | 2,930 | 5.80 | +0.54 | |||
| Left Socialists | 2,349 | 4.65 | +0.18 | |||
| Centre Democrats | 2,065 | 4.09 | -4.97 | |||
| Progress Party | 1,030 | 2.04 | -4.53 | |||
| Justice Party of Denmark | 995 | 1.97 | 0.00 | |||
| Christian People's Party | 794 | 1.57 | +0.05 | |||
| Communist Party of Denmark | 519 | 1.03 | -0.74 | |||
| Jacob Haugaard | 99 | 0.20 | -0.01 | |||
| Socialist Workers Party | 36 | 0.07 | -0.02 | |||
| Marxist–Leninists Party | 13 | 0.03 | New | |||
| Total | 50,491 | |||||
| Source[21] | ||||||
| Parties | Vote | |||||
|---|---|---|---|---|---|---|
| Votes | % | + / - | ||||
| Social Democrats | 15,841 | 35.87 | -4.73 | |||
| Green Left | 7,939 | 17.98 | +7.90 | |||
| Conservatives | 5,975 | 13.53 | +1.74 | |||
| Centre Democrats | 3,999 | 9.06 | +6.27 | |||
| Progress Party | 2,903 | 6.57 | -0.05 | |||
| Social Liberals | 2,321 | 5.26 | -0.18 | |||
| Left Socialists | 1,976 | 4.47 | -1.42 | |||
| Justice Party of Denmark | 872 | 1.97 | -1.37 | |||
| Communist Party of Denmark | 782 | 1.77 | -0.69 | |||
| Venstre | 696 | 1.58 | -7.20 | |||
| Christian People's Party | 672 | 1.52 | +0.02 | |||
| Jacob Haugaard | 92 | 0.21 | -0.07 | |||
| Communist Workers Party | 48 | 0.11 | -0.32 | |||
| Socialist Workers Party | 38 | 0.09 | New | |||
| Henrik Christensen | 3 | 0.01 | New | |||
| Lars Michaelsen | 2 | 0.00 | New | |||
| Total | 44,159 | |||||
| Source[22] | ||||||
General elections in the 1970s
| Parties | Vote | |||||
|---|---|---|---|---|---|---|
| Votes | % | + / - | ||||
| Social Democrats | 19,133 | 40.60 | -0.16 | |||
| Conservatives | 5,556 | 11.79 | +3.93 | |||
| Green Left | 4,749 | 10.08 | +3.55 | |||
| Venstre | 4,138 | 8.78 | +0.35 | |||
| Progress Party | 3,118 | 6.62 | -3.64 | |||
| Left Socialists | 2,775 | 5.89 | +0.89 | |||
| Social Liberals | 2,565 | 5.44 | +2.29 | |||
| Justice Party of Denmark | 1,573 | 3.34 | -0.69 | |||
| Centre Democrats | 1,317 | 2.79 | -3.63 | |||
| Communist Party of Denmark | 1,161 | 2.46 | -2.03 | |||
| Christian People's Party | 705 | 1.50 | -0.94 | |||
| Communist Workers Party | 205 | 0.43 | New | |||
| Jacob Haugaard | 132 | 0.28 | New | |||
| Total | 47,127 | |||||
| Source[23] | ||||||
| Parties | Vote | |||||
|---|---|---|---|---|---|---|
| Votes | % | + / - | ||||
| Social Democrats | 18,475 | 40.76 | +7.94 | |||
| Progress Party | 4,653 | 10.26 | +0.13 | |||
| Venstre | 3,819 | 8.43 | -10.10 | |||
| Conservatives | 3,564 | 7.86 | +2.55 | |||
| Green Left | 2,959 | 6.53 | -0.78 | |||
| Centre Democrats | 2,911 | 6.42 | +4.13 | |||
| Left Socialists | 2,266 | 5.00 | +1.16 | |||
| Communist Party of Denmark | 2,037 | 4.49 | -0.43 | |||
| Justice Party of Denmark | 1,825 | 4.03 | +1.43 | |||
| Social Liberals | 1,427 | 3.15 | -4.44 | |||
| Christian People's Party | 1,106 | 2.44 | -2.21 | |||
| Pensioners' Party | 280 | 0.62 | New | |||
| Tommy Nielsen | 7 | 0.02 | New | |||
| Total | 45,329 | |||||
| Source[24] | ||||||
| Parties | Vote | |||||
|---|---|---|---|---|---|---|
| Votes | % | + / - | ||||
| Social Democrats | 14,802 | 32.82 | +5.94 | |||
| Venstre | 8,355 | 18.53 | +10.19 | |||
| Progress Party | 4,569 | 10.13 | -3.39 | |||
| Social Liberals | 3,423 | 7.59 | -3.34 | |||
| Green Left | 3,297 | 7.31 | -1.51 | |||
| Conservatives | 2,396 | 5.31 | -4.26 | |||
| Communist Party of Denmark | 2,221 | 4.92 | +0.17 | |||
| Christian People's Party | 2,097 | 4.65 | +1.62 | |||
| Left Socialists | 1,730 | 3.84 | +1.61 | |||
| Justice Party of Denmark | 1,173 | 2.60 | -1.84 | |||
| Centre Democrats | 1,031 | 2.29 | -5.12 | |||
| Elmer Mariager | 4 | 0.01 | New | |||
| Total | 45,098 | |||||
| Source[25] | ||||||
| Parties | Vote | |||||
|---|---|---|---|---|---|---|
| Votes | % | + / - | ||||
| Social Democrats | 11,977 | 26.88 | -12.64 | |||
| Progress Party | 6,026 | 13.52 | New | |||
| Social Liberals | 4,872 | 10.93 | -3.57 | |||
| Conservatives | 4,266 | 9.57 | -7.92 | |||
| Green Left | 3,931 | 8.82 | -1.81 | |||
| Venstre | 3,716 | 8.34 | -2.80 | |||
| Centre Democrats | 3,300 | 7.41 | New | |||
| Communist Party of Denmark | 2,118 | 4.75 | +3.41 | |||
| Justice Party of Denmark | 1,977 | 4.44 | +2.33 | |||
| Christian People's Party | 1,352 | 3.03 | +1.70 | |||
| Left Socialists | 993 | 2.23 | +0.28 | |||
| John Bove | 33 | 0.07 | New | |||
| Total | 44,561 | |||||
| Source[26] | ||||||
| Parties | Vote | |||||
|---|---|---|---|---|---|---|
| Votes | % | + / - | ||||
| Social Democrats | 15,455 | 39.52 | + | |||
| Conservatives | 6,839 | 17.49 | + | |||
| Social Liberals | 5,669 | 14.50 | + | |||
| Venstre | 4,356 | 11.14 | + | |||
| Green Left | 4,158 | 10.63 | + | |||
| Justice Party of Denmark | 824 | 2.11 | + | |||
| Left Socialists | 761 | 1.95 | + | |||
| Communist Party of Denmark | 525 | 1.34 | + | |||
| Christian People's Party | 522 | 1.33 | New | |||
| Total | 39,109 | |||||
| Source[27] | ||||||
European Parliament elections results
2019 European Parliament election in Denmark
| Parties | Vote | |||||
|---|---|---|---|---|---|---|
| Votes | % | + / - | ||||
| Social Democrats | 9,267 | 23.11 | +1.31 | |||
| Venstre | 6,744 | 16.82 | +3.23 | |||
| Green Left | 6,327 | 15.78 | +1.68 | |||
| Social Liberals | 5,222 | 13.02 | +5.62 | |||
| Red–Green Alliance | 3,306 | 8.24 | New | |||
| Danish People's Party | 3,248 | 8.10 | -15.96 | |||
| Conservatives | 2,080 | 5.19 | -1.82 | |||
| The Alternative | 1,638 | 4.08 | New | |||
| People's Movement against the EU | 1,405 | 3.50 | -5.66 | |||
| Liberal Alliance | 863 | 2.15 | -0.72 | |||
| Total | 40,100 | |||||
| Source[28] | ||||||
2014 European Parliament election in Denmark
| Parties | Vote | |||||
|---|---|---|---|---|---|---|
| Votes | % | + / - | ||||
| Danish People's Party | 7,575 | 24.06 | +9.08 | |||
| Social Democrats | 6,866 | 21.80 | -6.35 | |||
| Green Left | 4,441 | 14.10 | -3.85 | |||
| Venstre | 4,278 | 13.59 | -2.73 | |||
| People's Movement against the EU | 2,886 | 9.16 | +2.23 | |||
| Social Liberals | 2,331 | 7.40 | +3.83 | |||
| Conservatives | 2,208 | 7.01 | -1.96 | |||
| Liberal Alliance | 905 | 2.87 | +2.31 | |||
| Total | 31,490 | |||||
| Source[29] | ||||||
2009 European Parliament election in Denmark
| Parties | Vote | |||||
|---|---|---|---|---|---|---|
| Votes | % | + / - | ||||
| Social Democrats | 9,214 | 28.15 | -6.58 | |||
| Green Left | 5,877 | 17.95 | +6.93 | |||
| Venstre | 5,342 | 16.32 | +2.75 | |||
| Danish People's Party | 4,904 | 14.98 | +8.32 | |||
| Conservatives | 2,936 | 8.97 | -0.45 | |||
| People's Movement against the EU | 2,267 | 6.93 | +1.66 | |||
| Social Liberals | 1,168 | 3.57 | -3.14 | |||
| June Movement | 842 | 2.57 | -8.77 | |||
| Liberal Alliance | 183 | 0.56 | New | |||
| Total | 32,733 | |||||
| Source[30] | ||||||
2004 European Parliament election in Denmark
| Parties | Vote | |||||
|---|---|---|---|---|---|---|
| Votes | % | + / - | ||||
| Social Democrats | 10,228 | 34.73 | +17.11 | |||
| Venstre | 3,996 | 13.57 | -4.93 | |||
| June Movement | 3,339 | 11.34 | -7.32 | |||
| Green Left | 3,246 | 11.02 | +2.05 | |||
| Conservatives | 2,773 | 9.42 | +2.57 | |||
| Social Liberals | 1,975 | 6.71 | -3.20 | |||
| Danish People's Party | 1,961 | 6.66 | +0.08 | |||
| People's Movement against the EU | 1,552 | 5.27 | -2.03 | |||
| Christian Democrats | 381 | 1.29 | -0.49 | |||
| Total | 29,451 | |||||
| Source[31] | ||||||
1999 European Parliament election in Denmark
| Parties | Vote | |||||
|---|---|---|---|---|---|---|
| Votes | % | + / - | ||||
| June Movement | 5,705 | 18.66 | -0.89 | |||
| Venstre | 5,655 | 18.50 | +4.39 | |||
| Social Democrats | 5,388 | 17.62 | +2.36 | |||
| Social Liberals | 3,029 | 9.91 | +1.46 | |||
| Green Left | 2,744 | 8.97 | -2.02 | |||
| People's Movement against the EU | 2,232 | 7.30 | -3.91 | |||
| Conservatives | 2,094 | 6.85 | -9.11 | |||
| Danish People's Party | 2,011 | 6.58 | New | |||
| Centre Democrats | 1,173 | 3.84 | +3.00 | |||
| Christian Democrats | 544 | 1.78 | +0.91 | |||
| Progress Party | 163 | 0.53 | -2.21 | |||
| Total | 30,575 | |||||
| Source[32] | ||||||
1994 European Parliament election in Denmark
| Parties | Vote | |||||
|---|---|---|---|---|---|---|
| Votes | % | + / - | ||||
| June Movement | 6,563 | 19.55 | New | |||
| Conservatives | 5,359 | 15.96 | +3.52 | |||
| Social Democrats | 5,123 | 15.26 | -7.29 | |||
| Venstre | 4,738 | 14.11 | +3.40 | |||
| People's Movement against the EU | 3,764 | 11.21 | -14.21 | |||
| Green Left | 3,691 | 10.99 | -0.94 | |||
| Social Liberals | 2,838 | 8.45 | +5.04 | |||
| Progress Party | 920 | 2.74 | -1.71 | |||
| Christian Democrats | 293 | 0.87 | -1.21 | |||
| Centre Democrats | 283 | 0.84 | -6.16 | |||
| Total | 33,572 | |||||
| Source[33] | ||||||
1989 European Parliament election in Denmark
| Parties | Vote | |||||
|---|---|---|---|---|---|---|
| Votes | % | + / - | ||||
| People's Movement against the EU | 7,105 | 25.42 | -2.01 | |||
| Social Democrats | 6,304 | 22.55 | +4.26 | |||
| Conservatives | 3,476 | 12.44 | -6.77 | |||
| Green Left | 3,334 | 11.93 | -1.37 | |||
| Venstre | 2,994 | 10.71 | +4.23 | |||
| Centre Democrats | 1,958 | 7.00 | +1.22 | |||
| Progress Party | 1,245 | 4.45 | +1.55 | |||
| Social Liberals | 954 | 3.41 | +0.51 | |||
| Christian Democrats | 582 | 2.08 | +0.55 | |||
| Total | 27,952 | |||||
| Source[34] | ||||||
1984 European Parliament election in Denmark
| Parties | Vote | |||||
|---|---|---|---|---|---|---|
| Votes | % | |||||
| People's Movement against the EU | 8,669 | 27.43 | ||||
| Conservatives | 6,070 | 19.21 | ||||
| Social Democrats | 5,781 | 18.29 | ||||
| Green Left | 4,205 | 13.30 | ||||
| Venstre | 2,047 | 6.48 | ||||
| Centre Democrats | 1,827 | 5.78 | ||||
| Social Liberals | 917 | 2.90 | ||||
| Progress Party | 915 | 2.90 | ||||
| Left Socialists | 692 | 2.19 | ||||
| Christian Democrats | 483 | 1.53 | ||||
| Total | 31,606 | |||||
| Source[35] | ||||||
Referendums
2022 Danish European Union opt-out referendum[36]
| Option | Votes | % |
|---|---|---|
| ✓ YES | 26,101 | 69.62 |
| X NO | 11,390 | 30.38 |
2015 Danish European Union opt-out referendum[37]
| Option | Votes | % |
|---|---|---|
| X NO | 20,148 | 51.37 |
| ✓ YES | 19,077 | 48.63 |
2014 Danish Unified Patent Court membership referendum[38]
| Option | Votes | % |
|---|---|---|
| ✓ YES | 18,603 | 60.84 |
| X NO | 11,974 | 39.16 |
2009 Danish Act of Succession referendum[39]
| Option | Votes | % |
|---|---|---|
| ✓ YES | 25,671 | 86.10 |
| X NO | 4,144 | 13.90 |
2000 Danish euro referendum[40]
| Option | Votes | % |
|---|---|---|
| X NO | 27,427 | 52.04 |
| ✓ YES | 25,277 | 47.96 |
1998 Danish Amsterdam Treaty referendum[41]
| Option | Votes | % |
|---|---|---|
| ✓ YES | 24,505 | 53.82 |
| X NO | 21,025 | 46.18 |
1993 Danish Maastricht Treaty referendum[42]
| Option | Votes | % |
|---|---|---|
| ✓ YES | 28,159 | 54.14 |
| X NO | 23,854 | 45.86 |
1992 Danish Maastricht Treaty referendum[43]
| Option | Votes | % |
|---|---|---|
| X NO | 27,653 | 55.02 |
| ✓ YES | 22,605 | 44.98 |
1986 Danish Single European Act referendum[44]
| Option | Votes | % |
|---|---|---|
| X NO | 23,540 | 53.26 |
| ✓ YES | 20,658 | 46.74 |
1972 Danish European Communities membership referendum[45]
| Option | Votes | % |
|---|---|---|
| ✓ YES | 25,626 | 58.68 |
| X NO | 18,045 | 41.32 |
References
- "Aarhuskredsen". kmdvalg.dk (in Danish). Retrieved 2023-06-04.
- "Forslag til Lov om ændring af lov om valg til Folketinget" (PDF). Folketingstidende. 4 June 1970.
- "Nye valgkredse fordeler stemmerne anderledes". dr.dk (in Danish). Retrieved 2023-06-04.
- "Beretning om nye valgkredse som følge af kommunalreformen" (in Danish). Retrieved 2023-06-04.
- "Det danske valgsystem: Valg til Folketinget". valg.im (in Danish). Retrieved 2023-06-04.
- "63 Aarhus Vest". dataforsyningen.dk (in Danish). Retrieved 2023-06-04.
- "Forslag til Lov om ændring af lov om valg til Folketinget" (PDF). Folketingstidende. 4 June 1970.
- "Valgresultater fra tidligere valg:". kmdvalg (in Danish). Retrieved 2023-06-04.
- "FOLKETINGSVALG TIRSDAG 1. NOVEMBER 2022". valg.im (in Danish). Retrieved 2023-06-27.
- "FOLKETINGSVALG ONSDAG 5. JUNI 2019". valg.im (in Danish). Retrieved 2023-06-27.
- "FOLKETINGSVALG TORSDAG 18. JUNI 2015". valg.im (in Danish). Retrieved 2023-06-27.
- "FOLKETINGSVALG TORSDAG 15. SEPTEMBER 2011". valg.im (in Danish). Retrieved 2023-06-27.
- "Folketingsvalget den 13. november 2007". valg.im (in Danish). Retrieved 2023-06-27.
- "valg2005.book" (PDF). valg.im (in Danish). Retrieved 2023-06-27.
- "BMTABEL" (PDF). valg.im (in Danish). Retrieved 2023-06-27.
- "VALG98" (PDF). valg.im (in Danish). Retrieved 2023-06-27.
- "VALG94" (PDF). valg.im (in Danish). Retrieved 2023-06-27.
- "VALG90" (PDF). valg.im (in Danish). Retrieved 2023-06-27.
- "Folketingsvalget den 10. maj 1988". valg.im (in Danish). Retrieved 2023-06-27.
- "Folketingsvalget den 8.september 1987". dst.dk (in Danish). Retrieved 2023-06-27.
- "Folketingsvalget den 10. januar 1984". dst.dk (in Danish). Retrieved 2023-06-27.
- "Folketingsvalget den 8. december 1981". dst.dk (in Danish). Retrieved 2023-06-27.
- "Folketingsvalget den 23. oktober 1979". dst.dk (in Danish). Retrieved 2023-06-27.
- "Folketingsvalget den 15. februar 1977". dst.dk (in Danish). Retrieved 2023-06-27.
- "Folketingsvalget den 9. januar 1975". dst.dk (in Danish). Retrieved 2023-06-27.
- "Folketingsvalget den 4. december 1973". dst.dk (in Danish). Retrieved 2023-06-27.
- "Folketingsvalget den 21. september 1971 samt folkeafstemningen". dst.dk (in Danish). Retrieved 2023-06-27.
- "EUROPA-PARLAMENTSVALG SØNDAG 26. MAJ 2019". dst.dk (in Danish). Retrieved 2023-07-01.
- "EUROPA-PARLAMENTSVALG SØNDAG 25. MAJ 2014". dst.dk (in Danish). Retrieved 2023-07-01.
- "EUROPA-PARLAMENTSVALG SØNDAG 7. JUNI 2009". dst.dk (in Danish). Retrieved 2023-07-01.
- "EUROPA-PARLAMENTSVALGET DEN 13. JUNI 2004" (PDF). im.dk (in Danish). Retrieved 2023-07-01.
- "VALGET TIL EUROPA-PARLAMENTET DEN 10. JUNI 1999" (PDF). im.dk (in Danish). Retrieved 2023-07-01.
- "VALGET TIL EUROPA-PARLAMENTET DEN 9. JUNI 1994" (PDF). im.dk (in Danish). Retrieved 2023-07-01.
- "Valget til Europa-parlamentet den 15. juni 1989". dst.dk (in Danish). Retrieved 2023-07-01.
- "Valget til Europa-Parlamentet den 14. juni 1984". dst.dk (in Danish). Retrieved 2023-07-01.
- "FOLKEAFSTEMNING ONSDAG 1. JUNI 2022". dst.dk (in Danish). Retrieved 2023-07-05.
- "FOLKEAFSTEMNING TORSDAG 3. DECEMBER 2015". dst.dk (in Danish). Retrieved 2023-07-05.
- "FOLKEAFSTEMNING SØNDAG 25. MAJ 2014". dst.dk (in Danish). Retrieved 2023-07-05.
- "FOLKEAFSTEMNING SØNDAG 7. JUNI 2009". dst.dk (in Danish). Retrieved 2023-07-05.
- "FOLKEAFSTEMNINGEN DEN 28. SEPTEMBER 2000 OM DANMARKS DELTAGELSE I DEN FÆLLES VALUTA" (PDF). valg.im (in Danish). Retrieved 2023-07-05.
- "FOLKEAFSTEMNINGEN DEN 28. MAJ 1998OM DANMARKS TILTRÆDELSE AF AMSTERDAMTRAKTATEN" (PDF). valg.im (in Danish). Retrieved 2023-07-05.
- "FOLKEAFSTEMNINGEN DEN 18. MAJ 1993 OM DANMARKS TILTRÆDELSE AF EDINBURGH-AFGØRELSEN OG MAASTRICHT-TRAKTATEN". dst.dk (in Danish). Retrieved 2023-07-05.
- "Folkeafstemningen den 1. juni 1992 om Danmarks tiltrædelse af traktaten om Den Europæiske Union". dst.dk (in Danish). Retrieved 2023-07-05.
- "Vejledende folkeafstemning torsdag den 27. februar 1986 om Danmarks tiltrædelse af EF- pakken". dst.dk (in Danish). Retrieved 2023-07-05.
- "Folkeafstemningen om Danmarks tiltrædelse af De europæiske Fælleskaber 2. oktober 1972". dst.dk (in Danish). Retrieved 2023-07-05.