Anahawan
Anahawan, officially the Municipality of Anahawan (Kabalian: Lungsod san Anahawan; Cebuano: Lungsod sa Anahawan; Tagalog: Bayan ng Anahawan), is a 5th class municipality in the province of Southern Leyte, Philippines. According to the 2020 census, it has a population of 8,429 people.[3]
Anahawan | |
|---|---|
| Municipality of Anahawan | |
 Flag  Seal | |
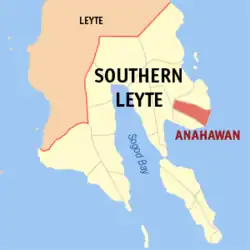 Map of Southern Leyte with Anahawan highlighted | |
OpenStreetMap | |
.svg.png.webp) Anahawan Location within the Philippines | |
| Coordinates: 10°16′27″N 125°15′30″E | |
| Country | Philippines |
| Region | Eastern Visayas |
| Province | Southern Leyte |
| District | 2nd district |
| Founded | 1930 |
| Barangays | 14 (see Barangays) |
| Government | |
| • Type | Sangguniang Bayan |
| • Mayor | Alfredo N. Luna Jr. (Aksyon) |
| • Vice Mayor | Nestor B. Vestal (Aksyon) |
| • Representative | Christopherson M. Yap |
| • Municipal Council | Members |
| • Electorate | 6,167 voters (2022) |
| Area | |
| • Total | 58.09 km2 (22.43 sq mi) |
| Elevation | 96 m (315 ft) |
| Highest elevation | 928 m (3,045 ft) |
| Lowest elevation | 0 m (0 ft) |
| Population (2020 census)[3] | |
| • Total | 8,429 |
| • Density | 150/km2 (380/sq mi) |
| • Households | 1,988 |
| Economy | |
| • Income class | 5th municipal income class |
| • Poverty incidence | 23.63 |
| • Revenue | ₱ 62.91 million (2020) |
| • Assets | ₱ 222.1 million (2020) |
| • Expenditure | ₱ 44.59 million (2020) |
| • Liabilities | ₱ 72.13 million (2020) |
| Service provider | |
| • Electricity | Southern Leyte Electric Cooperative (SOLECO) |
| Time zone | UTC+8 (PST) |
| ZIP code | 6610 |
| PSGC | |
| IDD : area code | +63 (0)53 |
| Native languages | Boholano dialect Cebuano Tagalog |
| Website | www |
Geography
Barangays
Anahawan is politically subdivided into 14 barangays. Each barangay consists of puroks and some have sitios.
- Amagusan
- Calintaan
- Canlabian
- Capacuhan
- Kagingkingan
- Lewing
- Lo-ok
- Mahalo
- Mainit
- Manigawong
- Poblacion
- San Vicente
- Tagup-on
- Cogon
Climate
| Climate data for Anahawan, Southern Leyte | |||||||||||||
|---|---|---|---|---|---|---|---|---|---|---|---|---|---|
| Month | Jan | Feb | Mar | Apr | May | Jun | Jul | Aug | Sep | Oct | Nov | Dec | Year |
| Average high °C (°F) | 28 (82) |
29 (84) |
29 (84) |
30 (86) |
30 (86) |
30 (86) |
29 (84) |
29 (84) |
29 (84) |
29 (84) |
29 (84) |
29 (84) |
29 (84) |
| Average low °C (°F) | 23 (73) |
22 (72) |
23 (73) |
24 (75) |
25 (77) |
25 (77) |
25 (77) |
25 (77) |
25 (77) |
25 (77) |
24 (75) |
23 (73) |
24 (75) |
| Average precipitation mm (inches) | 78 (3.1) |
57 (2.2) |
84 (3.3) |
79 (3.1) |
118 (4.6) |
181 (7.1) |
178 (7.0) |
169 (6.7) |
172 (6.8) |
180 (7.1) |
174 (6.9) |
128 (5.0) |
1,598 (62.9) |
| Average rainy days | 16.7 | 13.8 | 17.3 | 18.5 | 23.2 | 26.5 | 27.1 | 26.0 | 26.4 | 27.5 | 24.6 | 21.0 | 268.6 |
| Source: Meteoblue[5] | |||||||||||||
Demographics
| Year | Pop. | ±% p.a. |
|---|---|---|
| 1939 | 5,086 | — |
| 1948 | 4,703 | −0.87% |
| 1960 | 5,545 | +1.38% |
| 1970 | 6,094 | +0.95% |
| 1975 | 6,875 | +2.45% |
| 1980 | 6,544 | −0.98% |
| 1990 | 7,063 | +0.77% |
| 1995 | 6,471 | −1.63% |
| 2000 | 7,209 | +2.34% |
| 2007 | 8,032 | +1.50% |
| 2010 | 7,942 | −0.41% |
| 2015 | 8,211 | +0.64% |
| 2020 | 8,429 | +0.52% |
| Source: Philippine Statistics Authority. [6][7][8][9] | ||
Economy
References
- Municipality of Anahawan | (DILG)
- "2015 Census of Population, Report No. 3 – Population, Land Area, and Population Density" (PDF). Philippine Statistics Authority. Quezon City, Philippines. August 2016. ISSN 0117-1453. Archived (PDF) from the original on May 25, 2021. Retrieved July 16, 2021.
- Census of Population (2020). "Region VIII (Eastern Visayas)". Total Population by Province, City, Municipality and Barangay. Philippine Statistics Authority. Retrieved 8 July 2021.
- "PSA Releases the 2018 Municipal and City Level Poverty Estimates". Philippine Statistics Authority. 15 December 2021. Retrieved 22 January 2022.
- "Anahawan, Southern Leyte : Average Temperatures and Rainfall". Meteoblue. Retrieved 6 January 2019.
- Census of Population (2015). "Region VIII (Eastern Visayas)". Total Population by Province, City, Municipality and Barangay. Philippine Statistics Authority. Retrieved 20 June 2016.
- Census of Population and Housing (2010). "Region VIII (Eastern Visayas)" (PDF). Total Population by Province, City, Municipality and Barangay. National Statistics Office. Retrieved 29 June 2016.
- Censuses of Population (1903–2007). "Region VIII (Eastern Visayas)". Table 1. Population Enumerated in Various Censuses by Province/Highly Urbanized City: 1903 to 2007. National Statistics Office.
- "Province of Southern Leyte". Municipality Population Data. Local Water Utilities Administration Research Division. Retrieved 17 December 2016.
- "Poverty incidence (PI):". Philippine Statistics Authority. Retrieved December 28, 2020.
- "Estimation of Local Poverty in the Philippines" (PDF). Philippine Statistics Authority. 29 November 2005.
- "2003 City and Municipal Level Poverty Estimates" (PDF). Philippine Statistics Authority. 23 March 2009.
- "City and Municipal Level Poverty Estimates; 2006 and 2009" (PDF). Philippine Statistics Authority. 3 August 2012.
- "2012 Municipal and City Level Poverty Estimates" (PDF). Philippine Statistics Authority. 31 May 2016.
- "Municipal and City Level Small Area Poverty Estimates; 2009, 2012 and 2015". Philippine Statistics Authority. 10 July 2019.
- "PSA Releases the 2018 Municipal and City Level Poverty Estimates". Philippine Statistics Authority. 15 December 2021. Retrieved 22 January 2022.
External links
- Anahawan Profile at PhilAtlas.com
- Philippine Standard Geographic Code
- Philippine Census Information
- Local Governance Performance Management System
Places adjacent to Anahawan | |
|---|---|
Maasin (capital and largest city) | |
| Municipalities | |
| Component City | |
This article is issued from Wikipedia. The text is licensed under Creative Commons - Attribution - Sharealike. Additional terms may apply for the media files.