2002 Austrian legislative election
Early parliamentary elections were held in Austria on 24 November 2002,[2] after internal divisions in the Freedom Party of Austria (FPÖ) culminating in the Knittelfeld Putsch led to the resignation of several leading FPÖ members. The result was a victory for the ÖVP, which won 79 of the 183 seats, the first time it had been the largest party in the National Council since 1966.[3] It continued its coalition government with the FPÖ, which had lost almost two-thirds of its seats.[4] Voter turnout was 84.3%.[5]
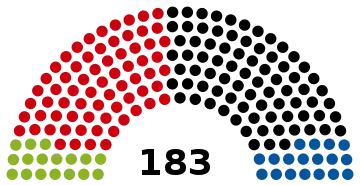
| |||||||||||||||||||||||||||||||||||||||||||||||||||||||||||||||||||||||
All 183 seats in the National Council 92 seats needed for a majority | |||||||||||||||||||||||||||||||||||||||||||||||||||||||||||||||||||||||
|---|---|---|---|---|---|---|---|---|---|---|---|---|---|---|---|---|---|---|---|---|---|---|---|---|---|---|---|---|---|---|---|---|---|---|---|---|---|---|---|---|---|---|---|---|---|---|---|---|---|---|---|---|---|---|---|---|---|---|---|---|---|---|---|---|---|---|---|---|---|---|---|
| Turnout | 4,982,261 (84.3%)[1] | ||||||||||||||||||||||||||||||||||||||||||||||||||||||||||||||||||||||
| |||||||||||||||||||||||||||||||||||||||||||||||||||||||||||||||||||||||
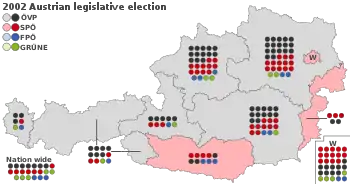 Results of the election, showing seats won by state and nationwide. States are shaded according to the first-place party. | |||||||||||||||||||||||||||||||||||||||||||||||||||||||||||||||||||||||
| |||||||||||||||||||||||||||||||||||||||||||||||||||||||||||||||||||||||

Contesting parties
The table below lists parties represented in the 21st National Council.
| Name | Ideology | Leader | 1999 result | |||
|---|---|---|---|---|---|---|
| Votes (%) | Seats | |||||
| SPÖ | Social Democratic Party of Austria Sozialdemokratische Partei Österreichs |
Social democracy | .jpg.webp) Alfred Gusenbauer |
33.2% | 65 / 183 | |
| FPÖ | Freedom Party of Austria Freiheitliche Partei Österreichs |
Right-wing populism Euroscepticism |
 Herbert Haupt |
26.9% | 52 / 183 | |
| ÖVP | Austrian People's Party Österreichische Volkspartei |
Christian democracy | 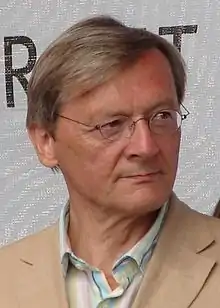 Wolfgang Schüssel |
26.9% | 52 / 183 | |
| GRÜNE | The Greens – The Green Alternative Die Grünen – Die Grüne Alternative |
Green politics | 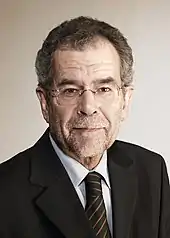 Alexander Van der Bellen |
7.4% | 14 / 183 | |
Results
 | |||||
|---|---|---|---|---|---|
| Party | Votes | % | Seats | +/– | |
| Austrian People's Party | 2,076,833 | 42.30 | 79 | +27 | |
| Social Democratic Party of Austria | 1,792,499 | 36.51 | 69 | +4 | |
| Freedom Party of Austria | 491,328 | 10.01 | 18 | –34 | |
| The Greens – The Green Alternative | 464,980 | 9.47 | 17 | +3 | |
| Liberal Forum | 48,083 | 0.98 | 0 | 0 | |
| Communist Party of Austria | 27,568 | 0.56 | 0 | 0 | |
| Socialist Left Party | 3,906 | 0.08 | 0 | New | |
| The Democrats | 2,439 | 0.05 | 0 | New | |
| Christian Voters Community | 2,009 | 0.04 | 0 | 0 | |
| Total | 4,909,645 | 100.00 | 183 | 0 | |
| Valid votes | 4,909,645 | 98.54 | |||
| Invalid/blank votes | 72,616 | 1.46 | |||
| Total votes | 4,982,261 | 100.00 | |||
| Registered voters/turnout | 5,912,592 | 84.27 | |||
| Source: Interior Ministry | |||||
Results by state
| State | ÖVP | SPÖ | FPÖ | Grüne | Others | ||||
|---|---|---|---|---|---|---|---|---|---|
| 42.4 | 45.8 | 6.4 | 4.7 | 0.7 | |||||
| 30.5 | 38.3 | 23.6 | 6.2 | 1.4 | |||||
| 47.8 | 36.8 | 6.9 | 7.2 | 1.3 | |||||
| 42.6 | 37.0 | 10.4 | 8.7 | 1.3 | |||||
| 46.7 | 30.8 | 10.7 | 10.4 | 1.4 | |||||
| 44.6 | 37.0 | 9.6 | 7.0 | 1.8 | |||||
| 51.9 | 24.5 | 10.0 | 11.6 | 2.0 | |||||
| 49.2 | 20.1 | 13.0 | 14.5 | 3.2 | |||||
| 30.7 | 43.8 | 8.0 | 15.1 | 2.4 | |||||
| 42.3 | 36.5 | 10.0 | 9.5 | 1.7 | |||||
| Source: Austrian Interior Ministry | |||||||||
References
- "Nationalratswahl 2006 - Endgültiges Gesamtergebnis". Website of the Austrian Ministry of the Interior (in German). Bundesministerium für Inneres. Retrieved 7 November 2014.
- Dieter Nohlen & Philip Stöver (2010) Elections in Europe: A data handbook, p197 ISBN 978-3-8329-5609-7
- Nohlen & Stöver, pp219-220
- Nohlen & Stöver, p179
- Nohlen & Stöver, p217
External links
 Media related to 2002 Austrian general election at Wikimedia Commons
| |||||||||||
| |||||||||||
This article is issued from Wikipedia. The text is licensed under Creative Commons - Attribution - Sharealike. Additional terms may apply for the media files.