Badonviller
Badonviller (French pronunciation: [badɔ̃vile]; German: Badenweiler) is a commune in the Meurthe-et-Moselle department in northeastern France.
Badonviller | |
|---|---|
_%C3%A9glise_MH.jpg.webp) The church in Badonviller | |
 Coat of arms | |
Location of Badonviller | |
 Badonviller  Badonviller | |
| Coordinates: 48°29′52″N 6°53′40″E | |
| Country | France |
| Region | Grand Est |
| Department | Meurthe-et-Moselle |
| Arrondissement | Lunéville |
| Canton | Baccarat |
| Government | |
| • Mayor (2020–2026) | Bernard Muller[1] |
| Area 1 | 21.95 km2 (8.47 sq mi) |
| Population | 1,559 |
| • Density | 71/km2 (180/sq mi) |
| Time zone | UTC+01:00 (CET) |
| • Summer (DST) | UTC+02:00 (CEST) |
| INSEE/Postal code | 54040 /54540 |
| Elevation | 284–524 m (932–1,719 ft) (avg. 404 m or 1,325 ft) |
| 1 French Land Register data, which excludes lakes, ponds, glaciers > 1 km2 (0.386 sq mi or 247 acres) and river estuaries. | |
Geography
Climate
Badonviller has a oceanic climate (Köppen climate classification Cfb). The average annual temperature in Badonviller is 10.2 °C (50.4 °F). The average annual rainfall is 1,066.3 mm (41.98 in) with December as the wettest month. The temperatures are highest on average in July, at around 18.9 °C (66.0 °F), and lowest in January, at around 1.9 °C (35.4 °F). The highest temperature ever recorded in Badonviller was 39.1 °C (102.4 °F) on 4 August 2022; the coldest temperature ever recorded was −22.0 °C (−7.6 °F) on 14 January 1960.
| Climate data for Badonviller (1991−2020 normals, extremes 1959−present) | |||||||||||||
|---|---|---|---|---|---|---|---|---|---|---|---|---|---|
| Month | Jan | Feb | Mar | Apr | May | Jun | Jul | Aug | Sep | Oct | Nov | Dec | Year |
| Record high °C (°F) | 18.5 (65.3) |
22.0 (71.6) |
26.3 (79.3) |
29.5 (85.1) |
33.5 (92.3) |
36.4 (97.5) |
38.9 (102.0) |
39.1 (102.4) |
33.0 (91.4) |
27.8 (82.0) |
24.0 (75.2) |
21.0 (69.8) |
39.1 (102.4) |
| Average high °C (°F) | 5.1 (41.2) |
6.7 (44.1) |
11.1 (52.0) |
15.7 (60.3) |
19.6 (67.3) |
23.2 (73.8) |
25.3 (77.5) |
25.0 (77.0) |
20.6 (69.1) |
15.5 (59.9) |
9.3 (48.7) |
5.8 (42.4) |
15.2 (59.4) |
| Daily mean °C (°F) | 1.9 (35.4) |
2.7 (36.9) |
5.9 (42.6) |
9.4 (48.9) |
13.5 (56.3) |
16.9 (62.4) |
18.9 (66.0) |
18.7 (65.7) |
14.7 (58.5) |
10.8 (51.4) |
5.8 (42.4) |
2.8 (37.0) |
10.2 (50.4) |
| Average low °C (°F) | −1.3 (29.7) |
−1.3 (29.7) |
0.8 (33.4) |
3.2 (37.8) |
7.4 (45.3) |
10.7 (51.3) |
12.6 (54.7) |
12.3 (54.1) |
8.9 (48.0) |
6.0 (42.8) |
2.2 (36.0) |
−0.1 (31.8) |
5.1 (41.2) |
| Record low °C (°F) | −22.0 (−7.6) |
−20.0 (−4.0) |
−18.5 (−1.3) |
−9.5 (14.9) |
−4.0 (24.8) |
−1.0 (30.2) |
2.0 (35.6) |
2.0 (35.6) |
−2.5 (27.5) |
−7.0 (19.4) |
−13.0 (8.6) |
−19.0 (−2.2) |
−22.0 (−7.6) |
| Average precipitation mm (inches) | 90.1 (3.55) |
80.7 (3.18) |
81.1 (3.19) |
68.4 (2.69) |
96.5 (3.80) |
85.7 (3.37) |
93.0 (3.66) |
84.2 (3.31) |
91.1 (3.59) |
94.4 (3.72) |
96.8 (3.81) |
104.3 (4.11) |
1,066.3 (41.98) |
| Average precipitation days (≥ 1.0 mm) | 14.6 | 12.8 | 11.9 | 10.8 | 12.7 | 11.2 | 11.4 | 10.9 | 10.8 | 12.8 | 13.9 | 15.2 | 148.8 |
| Source: Météo-France[3] | |||||||||||||
Population
|
|
 Monument of the 358th Infantry Regiment
 Military cemetery
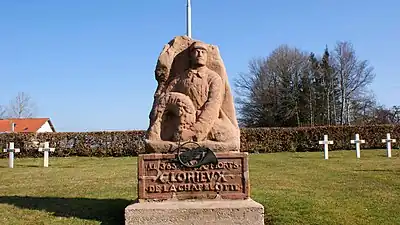 Statue carved February 15, 1916
 French flag in the military cemetery
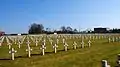 Crosses in the military cemetery
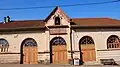 Covered market
Personalities
It is the birth town of the astronomer Charles Messier (1730–1817).
See also
References
- "Répertoire national des élus: les maires". data.gouv.fr, Plateforme ouverte des données publiques françaises (in French). 2 December 2020.
- "Populations légales 2020". The National Institute of Statistics and Economic Studies. 29 December 2022.
- "Fiche Climatologique Statistiques 1991-2020 et records" (PDF). Météo-France. Retrieved 23 August 2022.
Wikimedia Commons has media related to Badonviller.
This article is issued from Wikipedia. The text is licensed under Creative Commons - Attribution - Sharealike. Additional terms may apply for the media files.