Barrie—Innisfil
Barrie—Innisfil is a federal electoral district in Ontario. It encompasses a portion of Ontario previously included in the electoral districts of Barrie and York—Simcoe.[2]
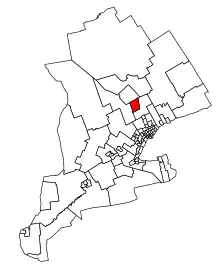 Barrie—Innisfil in relation to nearby electoral districts | |||
| Coordinates: | 44.347639°N 79.664861°W Location of the federal constituency office (as of 7 May 2016) | ||
| Federal electoral district | |||
| Legislature | House of Commons | ||
| MP |
Conservative | ||
| District created | 2013 | ||
| First contested | 2015 | ||
| Last contested | 2021 | ||
| District webpage | profile, map | ||
| Demographics | |||
| Population (2016)[1] | 109,286 | ||
| Electors (2021) | 90,268 | ||
| Area (km²)[1] | 331.08 | ||
| Pop. density (per km²) | 330.1 | ||
| Census division(s) | Simcoe | ||
| Census subdivision(s) | Barrie, Innisfil | ||
History
Barrie—Innisfil was created by the 2012 federal electoral boundaries redistribution and was legally defined in the 2013 representation order. It came into effect upon the call of the 42nd Canadian federal election, scheduled for October 2015.[3] Following the 2022 Canadian federal electoral redistribution, this riding will be renamed Barrie South—Innisfil at the first election held after approximately April 2024.[4]
Members of Parliament
This riding has elected the following Members of Parliament:
| Parliament | Years | Member | Party | |
|---|---|---|---|---|
| Barrie—Innisfil Riding created from Barrie and York—Simcoe |
||||
| 42nd | 2015–2019 | John Brassard | Conservative | |
| 43rd | 2019–2021 | |||
| 44th | 2021–present | |||
Geography
Barrie—Innisfil consists of:
(a) that part of the County of Simcoe comprising the Town of Innisfil; and
(b) that part of the City of Barrie lying southerly of a line described as follows: commencing at the intersection of the westerly limit of said city with Dunlop Street West; thence northeasterly along said street to Tiffin Street; thence southeasterly and easterly along said street to Lakeshore Drive; thence northeasterly in a straight line to the easterly limit of said city (at the intersection of the southerly limit of the Township of Oro-Medonte with the northerly limit of the Town of Innisfil).[5]
Demographics
According to the 2021 Canada Census[6]
Ethnic groups: 79.0% White, 4.1% Indigenous, 3.9% Black, 3.4% South Asian, 2.5% Latin American, 1.5% Chinese, 1.3% Filipino
Languages: 79.5% English, 2.0% Spanish, 1.8% Russian, 1.5% French, 1.4% Italian, 1.4% Portuguese
Religions: 55.4% Christian (26.6% Catholic, 4.6% Anglican, 4.6% United Church, 1.9% Christian Orthodox, 1.8% Presbyterian, 1.6% Pentecostal, 1.5% Baptist, 12.8% Other), 2.5% Muslim, 1.2% Hindu, 1.1% Jewish, 38.3% None
Median income: $42,800 (2020)
Average income: $54,200 (2020)
Riding associations
Riding associations are the local branches of the national political parties:
| Party | Association Name | CEO | HQ City | |
| Conservative Party of Canada | Barrie—Innisfil Conservative Association | Joshua A. Valler | Barrie | |
| Green Party of Canada | Barrie—Innisfil Federal Green Party Association | Ronald J. Fischer | Barrie | |
| Liberal Party of Canada | Barrie—Innisfil Federal Liberal Association | Ryan S. Ward | Barrie | |
| New Democratic Party | Barrie—Innisfil Federal NDP Riding Association | Pekka Reinio | Barrie | |
| People's Party of Canada | Barrie-Simcoe PPC Association | Stephen Makk | Victoria Harbour | |
Election results
| 2021 Canadian federal election | ||||||||
|---|---|---|---|---|---|---|---|---|
| Party | Candidate | Votes | % | ±% | Expenditures | |||
| Conservative | John Brassard | 25,234 | 47.70 | +3.90 | $85,518.18 | |||
| Liberal | Lisa-Marie Wilson | 15,279 | 28.90 | -0.37 | $20,446.18 | |||
| New Democratic | Aleesha Gostkowski | 8,344 | 15.80 | -0.57 | $7,141.50 | |||
| People's | Corrado Brancato | 4,060 | 7.70 | +5.83 | $5,417.54 | |||
| Total valid votes | ||||||||
| Total rejected ballots | ||||||||
| Turnout | 52,917 | 58.62 | -4.15 | |||||
| Eligible voters | 90,268 | |||||||
| Conservative hold | Swing | +3.90 | ||||||
| Source: Elections Canada[7] | ||||||||
| 2019 Canadian federal election | ||||||||
|---|---|---|---|---|---|---|---|---|
| Party | Candidate | Votes | % | ±% | Expenditures | |||
| Conservative | John Brassard | 23,765 | 43.80 | -2.61 | $67,066.96 | |||
| Liberal | Lisa-Marie Wilson | 15,879 | 29.27 | -7.84 | $25,221.89 | |||
| New Democratic | Pekka Reinio | 8,880 | 16.37 | +4.59 | $12,185.72 | |||
| Green | Bonnie North | 4,716 | 8.69 | +4.66 | $0.00 | |||
| People's | Stephanie Robinson | 1,013 | 1.87 | – | none listed | |||
| Total valid votes/expense limit | 54,253 | 99.31 | ||||||
| Total rejected ballots | 376 | 0.69 | +0.31 | |||||
| Turnout | 54,629 | 62.77 | -1.28 | |||||
| Eligible voters | 87,025 | |||||||
| Conservative hold | Swing | -2.61 | ||||||
| Source: Elections Canada[8] | ||||||||
| 2015 Canadian federal election | ||||||||
|---|---|---|---|---|---|---|---|---|
| Party | Candidate | Votes | % | ±% | Expenditures | |||
| Conservative | John Brassard | 22,901 | 46.41 | −14.85 | $152,037.98 | |||
| Liberal | Colin Wilson | 18,308 | 37.11 | +24.59 | $45,769.43 | |||
| New Democratic | Myrna Clark | 5,812 | 11.78 | −8.49 | $20,283.99 | |||
| Green | Bonnie North | 1,991 | 4.04 | −1.28 | $11,907.65 | |||
| Christian Heritage | Gary Nail | 199 | 0.40 | – | $512.25 | |||
| Canadian Action | Jeff Sakula | 130 | 0.26 | – | – | |||
| Total valid votes/expense limit | 49,341 | 99.62 | $209,977.36 | |||||
| Total rejected ballots | 187 | 0.38 | – | |||||
| Turnout | 49,528 | 64.06 | – | |||||
| Eligible voters | 77,320 | |||||||
| Conservative hold | Swing | -19.72 | ||||||
| Source: Elections Canada[9][10][11] | ||||||||
| 2011 federal election redistributed results[12] | |||
|---|---|---|---|
| Party | Vote | % | |
| Conservative | 25,226 | 61.27 | |
| New Democratic | 8,345 | 20.27 | |
| Liberal | 5,154 | 12.52 | |
| Green | 2,190 | 5.32 | |
| Others | 258 | 0.63 | |
References
- Statistics Canada: 2017
- Final Report – Ontario
- Timeline for the Redistribution of Federal Electoral Districts
- "New Federal Electoral Map for Ontario".
- "Barrie—Innisfil – Commission's Report - Redistribution Federal Electoral Districts". www.redecoupage-federal-redistribution.ca.
- Government of Canada, Statistics Canada (February 9, 2022). "Profile table, Census Profile, 2021 Census of Population - Barrie--Innisfil [Federal electoral district (2013 Representation Order)], Ontario". www12.statcan.gc.ca. Retrieved April 3, 2023.
- "List of confirmed candidates – September 20, 2021 Federal Election". Elections Canada. Retrieved September 2, 2021.
- "Official Voting Results". Elections Canada. Retrieved August 10, 2021.
- Canada, Elections. "Voter Information Service - Find your electoral district". www.elections.ca.
- Canada, Elections. "Error page". www.elections.ca. Archived from the original on August 15, 2015.
- "Official Voting Results". Elections Canada. Retrieved August 10, 2021.
- Pundits' Guide to Canadian Elections