Brampton South
Brampton South (French: Brampton-Sud) is a federal electoral district in the Peel Region of Ontario.
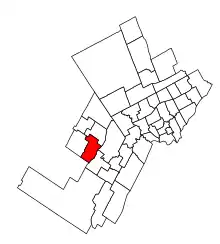 Brampton South in relation to other Greater Toronto Area districts | |||
| Federal electoral district | |||
| Legislature | House of Commons | ||
| MP |
Liberal | ||
| District created | 2013 | ||
| First contested | 2015 | ||
| Last contested | 2021 | ||
| District webpage | profile, map | ||
| Demographics | |||
| Population (2016)[1] | 121,188 | ||
| Electors (2021) | 76,003 | ||
| Area (km²)[2] | 46.73 | ||
| Pop. density (per km²) | 2,593.4 | ||
| Census division(s) | Peel | ||
| Census subdivision(s) | Brampton | ||
Brampton South was created by the 2012 federal electoral boundaries redistribution and was legally defined in the 2013 representation order. It came into effect upon the call of the 42nd Canadian federal election, scheduled for October 2015.[3] It was created out of the electoral district of Brampton West.[4]
Demographics
According to the 2021 Canada Census[5]
Ethnic groups: 49.2% South Asian, 24.4% White, 11.2% Black, 3.5% Filipino, 1.6% Latin American, 1.6% Southeast Asian, 1.5% Chinese, 1.2% Arab
Languages: 44.4% English, 18.8% Punjabi, 3.7% Urdu, 3.2% Gujarati, 3.0% Hindi, 2.1% Portuguese, 1.6% Tagalog, 1.6% Tamil, 1.4% Spanish
Religions: 37.4% Christian (18.5% Catholic, 2.4% Pentecostal, 1.9% Anglican, 1.4% United Church, 13.2% Other), 21.9% Sikh, 17.1% Hindu, 9.1% Muslim, 1.3% Buddhist, 12.6% None
Median income: $35,600 (2020)
Average income: $45,920 (2020)
Members of Parliament
This riding has elected the following Members of Parliament:
| Parliament | Years | Member | Party | |
|---|---|---|---|---|
| Brampton South Riding created from Brampton West |
||||
| 42nd | 2015–2019 | Sonia Sidhu | Liberal | |
| 43rd | 2019–2021 | |||
| 44th | 2021–present | |||
Election results
| 2021 Canadian federal election | ||||||||
|---|---|---|---|---|---|---|---|---|
| Party | Candidate | Votes | % | ±% | Expenditures | |||
| Liberal | Sonia Sidhu | 21,120 | 50.98 | +1.51 | $97,785.16 | |||
| Conservative | Ramandeep Brar | 12,596 | 30.40 | +2.00 | $75,417.63 | |||
| New Democratic | Tejinder Singh | 5,894 | 14.23 | -2.17 | $13,391.87 | |||
| People's | Nicholas Craniotis | 1,820 | 4.39 | 3.67 | $2,380.47 | |||
| Total valid votes/Expense limit | 41,439 | – | – | $109,088.26 | ||||
| Total rejected ballots | 503 | 1.20 | ||||||
| Turnout | 41,933 | 55.17 | -7.59 | |||||
| Eligible voters | 76,003 | |||||||
| Source: Elections Canada[6] | ||||||||
| 2019 Canadian federal election | ||||||||
|---|---|---|---|---|---|---|---|---|
| Party | Candidate | Votes | % | ±% | Expenditures | |||
| Liberal | Sonia Sidhu | 24,085 | 49.47 | -2.62 | $92,936.55 | |||
| Conservative | Ramandeep Brar | 13,828 | 28.40 | -6.64 | $98,182.77 | |||
| New Democratic | Mandeep Kaur | 7,985 | 16.40 | +5.75 | $53,224.68 | |||
| Green | Karen Fraser | 1,926 | 3.95 | +1.73 | none listed | |||
| People's | Rajwinder Ghuman | 354 | 0.72 | none listed | ||||
| Christian Heritage | Wavey Mercer | 285 | 0.58 | none listed | ||||
| Canada's Fourth Front | Mitesh Joshi | 152 | 0.31 | $8,217.30 | ||||
| Marxist–Leninist | Dagmar Sullivan | 68 | 0.13 | $20.00 | ||||
| Total valid votes/expense limit | 48,863 | 100.0 | ||||||
| Total rejected ballots | 583 | |||||||
| Turnout | 49,266 | 62.76 | ||||||
| Eligible voters | 78,487 | |||||||
| Liberal hold | Swing | +2.01 | ||||||
| Source: Elections Canada[7][8] | ||||||||
| 2015 Canadian federal election | ||||||||
|---|---|---|---|---|---|---|---|---|
| Party | Candidate | Votes | % | ±% | Expenditures | |||
| Liberal | Sonia Sidhu | 23,681 | 52.09 | +16.70 | $101,341.55 | |||
| Conservative | Kyle Seeback | 15,929 | 35.04 | -10.37 | $105,913.36 | |||
| New Democratic | Amarjit Sangha | 4,843 | 10.65 | -5.77 | $37,089.45 | |||
| Green | Shaun Hatton | 1,011 | 2.22 | -0.04 | $144.64 | |||
| Total valid votes/expense limit | 45,464 | 100.00 | $205,155.00 | |||||
| Total rejected ballots | 270 | 0.59 | – | |||||
| Turnout | 45,734 | 63.42 | – | |||||
| Eligible voters | 72,111 | |||||||
| Liberal gain from Conservative | Swing | +13.53 | ||||||
| Source: Elections Canada[9][10] | ||||||||
| 2011 federal election redistributed results[11] | |||
|---|---|---|---|
| Party | Vote | % | |
| Conservative | 16,145 | 45.40 | |
| Liberal | 12,584 | 35.39 | |
| New Democratic | 5,838 | 16.42 | |
| Green | 805 | 2.26 | |
| Others | 186 | 0.52 | |
References
- Statistics Canada: 2017
- Statistics Canada: 2017
- Timeline for the Redistribution of Federal Electoral Districts
- Final Report – Ontario
- Government of Canada, Statistics Canada (February 9, 2022). "Profile table, Census Profile, 2021 Census of Population - Brampton South [Federal electoral district (2013 Representation Order)], Ontario". www12.statcan.gc.ca. Retrieved March 7, 2023.
- "September 20, 2021 General Election - Election Results". Elections Canada. Retrieved September 2, 2021.
- "List of confirmed candidates". Elections Canada. Retrieved October 4, 2019.
- "Election Night Results". Elections Canada. Retrieved November 3, 2019.
- Elections Canada – Confirmed candidates for Brampton South, 30 September 2015
- Elections Canada – Preliminary Election Expenses Limits for Candidates Archived 2016-03-04 at the Wayback Machine
- Pundits' Guide to Canadian Elections