Whitby (federal electoral district)
Whitby is a federal electoral district (riding) in Ontario consisting of the entire town of Whitby, Ontario. The boundaries for Whitby were created by the 2012 federal electoral boundaries redistribution and were legally defined in the 2013 representation order. The riding came into existence upon the call of the 42nd Canadian federal election in October 2015.[2] It was created out of the district of Whitby—Oshawa.[3] It is a key Liberal-Conservative marginal seat.
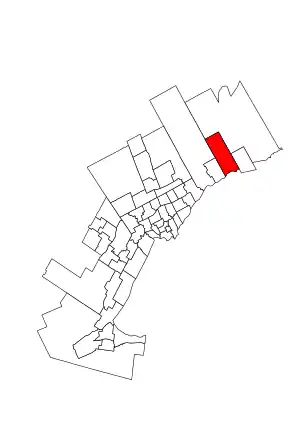 Whitby in relation to other Greater Toronto Area districts | |||
| Coordinates: | 43.93°N 78.96°W | ||
| Federal electoral district | |||
| Legislature | House of Commons | ||
| MP |
Liberal | ||
| District created | 2013 | ||
| First contested | 2015 | ||
| Last contested | 2021 | ||
| District webpage | profile, map | ||
| Demographics | |||
| Population (2021)[1] | 138,501 | ||
| Electors (2015) | 90,964 | ||
| Area (km²)[1] | 155 | ||
| Pop. density (per km²) | 893.6 | ||
| Census division(s) | Durham | ||
| Census subdivision(s) | Whitby | ||
Demographics
According to the 2021 Canada Census[4]
Ethnic groups: 62.2% White, 12.0% South Asian, 9.1% Black, 3.6% Chinese, 2.6% Filipino, 2.4% Indigenous, 1.6% West Asian, 1.2% Latin American, 1.0% Arab
Languages: 75.5% English, 1.7% Urdu, 1.6% Tamil, 1.5% Mandarin, 1.3% French, 1.1% Spanish, 1.0% Italian
Religions: 54.3% Christian (25.7% Catholic, 4.9% Anglican, 4.2% United Church, 2.7% Christian Orthodox, 1.9% Pentecostal, 1.4% Presbyterian, 1.1% Baptist, 12.4% Other), 6.7% Muslim, 5.4% Hindu, 31.6% None
Median income: $48,000 (2020)
Average income: $63,000 (2020)
Members of Parliament
This riding has elected the following Members of Parliament:
| Parliament | Years | Member | Party | |
|---|---|---|---|---|
| Whitby Riding created from Whitby—Oshawa |
||||
| 42nd | 2015–2019 | Celina Caesar-Chavannes | Liberal | |
| 2019–2019 | Independent | |||
| 43rd | 2019–2021 | Ryan Turnbull | Liberal | |
| 44th | 2021–present | |||
Election results
| 2021 Canadian federal election | ||||||||
|---|---|---|---|---|---|---|---|---|
| Party | Candidate | Votes | % | ±% | Expenditures | |||
| Liberal | Ryan Turnbull | 27,375 | 44.1 | +0.4 | $89,015.09 | |||
| Conservative | Maleeha Shahid | 22,271 | 35.9 | +0.4 | $105,175.68 | |||
| New Democratic | Brian Dias | 8,766 | 14.1 | ±0.0 | $13,630.16 | |||
| People's | Thomas Androvic | 2,682 | 4.3 | +3.1 | $5,881.18 | |||
| Green | Johannes Kotilainen | 972 | 1.6 | -3.8 | $3,254.22 | |||
| Total valid votes/Expense limit | 62,066 | – | – | $127,815.88 | ||||
| Total rejected ballots | 332 | |||||||
| Turnout | 62,398 | 61.50 | ||||||
| Eligible voters | 101,465 | |||||||
| Source: Elections Canada[5] | ||||||||
| 2019 Canadian federal election | ||||||||
|---|---|---|---|---|---|---|---|---|
| Party | Candidate | Votes | % | ±% | Expenditures | |||
| Liberal | Ryan Turnbull | 30,182 | 43.7 | -1.25 | $90,618.58 | |||
| Conservative | Todd McCarthy | 24,564 | 35.5 | -6.59 | $114,623.57 | |||
| New Democratic | Brian Dias | 9,760 | 14.1 | +3.75 | $6,319.41 | |||
| Green | Paul Slavchenko | 3,735 | 5.4 | +3.23 | $28,189.54 | |||
| People's | Mirko Pejic | 860 | 1.2 | $3,185.65 | ||||
| Total valid votes/expense limit | 69,101 | 100.0 | ||||||
| Total rejected ballots | 415 | |||||||
| Turnout | 69,516 | 70.8 | ||||||
| Eligible voters | 98,190 | |||||||
| Liberal hold | Swing | +2.67 | ||||||
| Source: Elections Canada[6][7] | ||||||||
| 2015 Canadian federal election | ||||||||
|---|---|---|---|---|---|---|---|---|
| Party | Candidate | Votes | % | ±% | Expenditures | |||
| Liberal | Celina Caesar-Chavannes | 29,003 | 44.95 | +30.46 | $53,971.84 | |||
| Conservative | Pat Perkins | 27,154 | 42.09 | −16.72 | $62,752.73 | |||
| New Democratic | Ryan Kelly | 6,677 | 10.35 | −11.06 | $11,930.35 | |||
| Green | Craig Cameron | 1,403 | 2.17 | −2.81 | $1,685.15 | |||
| Independent | Jon O'Connor | 279 | 0.43 | – | $1,811.93 | |||
| Total valid votes/Expense limit | 64,516 | 100.0 | $233,804.45 | |||||
| Total rejected ballots | 235 | – | – | |||||
| Turnout | 64,751 | – | – | |||||
| Eligible voters | 90,964 | |||||||
| Source: Elections Canada[8][9] | ||||||||
| 2011 federal election redistributed results[10] | |||
|---|---|---|---|
| Party | Vote | % | |
| Conservative | 31,034 | 58.81 | |
| New Democratic | 11,297 | 21.41 | |
| Liberal | 7,644 | 14.49 | |
| Green | 2,628 | 4.98 | |
| Libertarian | 168 | 0.32 | |
References
- "Census Profile, 2021 Census". Ottawa: Statistics Canada. 2022. Retrieved February 9, 2022.
- Timeline for the Redistribution of Federal Electoral Districts
- Final Report – Ontario
- Government of Canada, Statistics Canada (February 9, 2022). "Profile table, Census Profile, 2021 Census of Population - Whitby [Federal electoral district (2013 Representation Order)], Ontario". www12.statcan.gc.ca. Retrieved March 11, 2023.
- "Official Voting Results". Elections Canada. Retrieved October 3, 2021.
- "List of confirmed candidates". Elections Canada. Retrieved October 3, 2019.
- "Election Night Results". Elections Canada. Retrieved November 4, 2019.
- Elections Canada – Confirmed candidates for Whitby, 30 September 2015
- Elections Canada – Preliminary Election Expenses Limits for Candidates
- Pundits' Guide to Canadian Elections