Demographic history of Bulgaria
This article presents the demographic history of Bulgaria. See Demographics of Bulgaria
31 December 1880 census
| Religion | Number | % |
|---|---|---|
| Orthodox | 1,404,409 | 69.9 |
| Muslim | 578,060 | 28.7 |
| Judaism | 14,342 | 0.7 |
| Other | 11,108 | 0.5 |
| Total | 2,007,919 | 100 |
| Language | Number | % |
|---|---|---|
| Bulgarian | 1,345,507 | 67.0 |
| Turkish | 527,284 | 26.2 |
| "Vlach" (Aromanian and Romanian) | 49,064 | 2.4 |
| Roma | 37,600 | 1.8 |
| Ladino | 14,020 | 0.7 |
| Tatar | 12,376 | 0.6 |
| Greek | 11,152 | 0.6 |
| Armenian | 3,837 | 0.2 |
| Serbo-Croatian | 1,894 | 0.1 |
| Yaddish | 1,280 | 0.1 |
| Russian | 1,123 | 0.1 |
| Albanian | 530 | 0.0 |
| Italian | 515 | 0.0 |
| Hungarian | 220 | 0.0 |
| Czech | 174 | 0.0 |
| French | 164 | 0.0 |
| Arab | 97 | 0.0 |
| Polish | 92 | 0.0 |
| English | 64 | 0.0 |
| Circassian | 63 | 0.0 |
| Persian | 58 | 0.0 |
| Others | 402 | 0.0 |
| Total | 2,007,919 | 100 |
31 December 1887 census
| Religion | Number | % |
|---|---|---|
| Orthodox | 2,242,371 | 76.8 |
| Muslim | 676,215 | 21.4 |
| Judaism | 24,352 | 0.7 |
| Roman Catholic | 18,505 | 0.5 |
| Armenian Gregorian | 5,839 | 0.1 |
| Protestant | 1,358 | 0.0 |
| Other | 1,461 | 0.0 |
| Undeclared | 2,274 | 0.0 |
| Total | 3,154,375 | 100 |
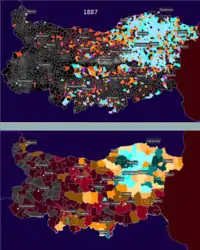
| Language | Number | % |
|---|---|---|
| Bulgarian | 2,326,250 | 73.7 |
| Turkish | 607,331 | 19.3 |
| Greek | 58,326 | 1.8 |
| Roma | 50,291 | 1.6 |
| Other | ||
| Total | 3,154,375 | 100 |
31 December 1892 census
_1892.JPG.webp)
| Ethnic groups | Number | % |
|---|---|---|
| Bulgarians | 2,505,243 | 75.66 |
| Turks | 558,364 | 16.86 |
| Romanians | 62,227 | 1.87 |
| Greeks | 58,296 | 1.76 |
| Romani | 51,946 | 1.56 |
| Jews | 21,777 | 0.83 |
| Tatars | 16,179 | 0.48 |
| Gagauzes | 9,520 | 0.28 |
| Armenians | 6,900 | 0.20 |
| "Vlachs" (Aromanians, Romanians, Romanian-speaking Boyash) | 733 | 0.02 |
| Others | 13,616 | 0.41 |
| Total | 3,310,810 | 100 |
| Religion | Number | % |
|---|---|---|
| Orthodox | 2,606,786 | 78.7 |
| Muslim | 643,258 | 19.4 |
| Jewish | 28,307 | 0.8 |
| Roman Catholic | 22,617 | 0.6 |
| Armenian Grecorian | 6,643 | 0.2 |
| Protestant | 2,384 | 0.0 |
| Undeclared | 718 | 0.0 |
| Total | 3,310,713 | 100 |
| Language | Number | % |
|---|---|---|
| Bulgarian | 2,505,326 | 75.7 |
| Turkish | 569,728 | 17.2 |
| Romanian | 62,628 | 1.9 |
| Greek | 58,518 | 1.8 |
| Roma | 52,132 | 1.6 |
| Ladino | 27,531 | 0.8 |
| Tatar | 16,920 | 0.5 |
| Armenian | 6,445 | 0.2 |
| German | 3,620 | 0.1 |
| Russian | 928 | 0.0 |
| Serbian | 818 | 0.0 |
| Italian | 803 | 0.0 |
| French | 356 | 0.0 |
| Others | 4,425 | 0.1 |
| Undeclared | 1,165 | 0.0 |
| Total | 3,310,713 | 100 |
31 December 1900 census
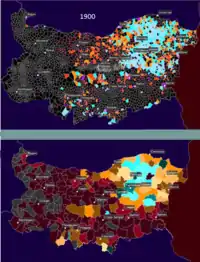
| Ethnic groups | Number | % |
|---|---|---|
| Bulgarians | 2,888,129 | 77.1 |
| Turks | 531,240 | 14.2 |
| Romani | 89,549 | 2.4 |
| Romanians | 71,063 | 1.9 |
| Greeks | 66,635 | 1.8 |
| Jews | 33,661 | 0.9 |
| Tatars | 19,884 | 0.5 |
| Armenians | 14,581 | 0.4 |
| Russians | 1,685 | 0.0 |
| Total | 3,744,283 | 100 |
| Religion | Number | % |
|---|---|---|
| Orthodox | 3,019,999 | 80.6 |
| Muslim | 643,300 | 17.1 |
| Judaism | 33,663 | 0.8 |
| Roman Catholic | 28,569 | 0.7 |
| Armenian Grecorian | 13,809 | 0.3 |
| Protestant | 4,524 | 0.1 |
| Others | 326 | 0.0 |
| Undeclared | 93 | 0.0 |
| Total | 3,744,283 | 100 |
31 December 1905 census
| Ethnic groups | Number | % |
|---|---|---|
| Bulgarians | 3,203,810 | 79.4 |
| Turks | 488,010 | 12.1 |
| Romani | 99,004 | 2.5 |
| Romanians | 75,773 | 1.9 |
| Greeks | 63,487 | 1.6 |
| Jews | 37,663 | 0.9 |
| Tatars | 17,942 | 0.4 |
| Gagauzes | 10,175 | 0.3 |
| Sarakatsani | 6,128 | 0.2 |
| Russians | 3,275 | 0.2 |
| Total | 4,035,575 | 100 |
31 December 1910 census
| Ethnic groups | Numbers | % |
|---|---|---|
| Bulgarians | 3,518,756 | 81.1 |
| Turks | 465,641 | 10.7 |
| Romani | 122,296 | 2.8 |
| Romanians | 79,429 | 1.8 |
| Greeks | 43,275 | 1.0 |
| Jews | 40,133 | 0.9 |
| Tatars | 18,228 | 0.4 |
| Armenians | 12,932 | 0.3 |
| Sarakatsani | 7,251 | 0.2 |
| Russians | 2,505 | 0.2 |
| Total | 4,337,513 | 100 |
| Religion | Number | % |
|---|---|---|
| Orthodox | 3,643,918 | 84.0 |
| Muslim | 602,078 | 13.8 |
| Judaism | 40,067 | 0.9 |
| Roman Catholic | 32,150 | 0.7 |
| Armenian Grecorian | 12,259 | 0.2 |
| Protestant | 6,335 | 0.1 |
| Other/Undeclared | 706 | 0.0 |
| Total | 4,337,513 | 100 |
31 December 1920 census
| Ethnic groups | Numbers | % |
|---|---|---|
| Bulgarians | 4,036,056 | 83.3 |
| Turks | 520,339 | 10.7 |
| Romani | 98,451 | 2.0 |
| Romanians | 57,312 | 1.2 |
| Jews | 43,209 | 0.9 |
| Greeks | 42,074 | 0.9 |
| Armenians | 11,509 | 0.2 |
| Russians | 9,080 | 0.2 |
| Total | 4,846,971 | 100 |
1. During the period 1910 - 1920 Bulgaria suffered physical loss of population as follows:
- About 140,000 died in the wars (Balkan War I, Balkan War II, World War I), mostly of reproductive age;
- About 276,000 people in Southern Dobruja, who cross into Romania, and more on the western outskirts, who cross into Serbia.
2. During the period 1910 - 1920 the population growth in Bulgaria was as follows:
- It is estimated that about 350,000 refugees were sent to Bulgaria, losing territories during the Balkan War ll and the World War I. It is known, however, that a large part of the refugees from the Aegean and Edirne Thrace returned to their native places after the first wave, after which they immigrated to Bulgaria again in 1923;
- Bulgaria includes new suburbs won during the Balkan War I and the World War I - Pirin Macedonia and parts of the Rhodopes and Thrace.
| Religion | Number | % |
|---|---|---|
| Orthodox | 4,062,097 | 83.8 |
| Muslim | 690,734 | 14,2 |
| Judaism | 43,232 | 0.8 |
| Roman Catholic | 34,072 | 0.7 |
| Armenian Grecorian | 10,848 | 0.2 |
| Protestant | 5,617 | 0.1 |
| Other/Undeclared | 371 | 0.0 |
| Total | 4,846,971 | 100 |
31 December 1926 census
| Ethnic groups | Number | % |
|---|---|---|
| Bulgarians | 4,557,706 | 83.2 |
| Turks | 577,552 | 10.5 |
| Romani | 134,844 | 2.5 |
| Romanians | 69,080 | 1.2 |
| Jews | 46,558 | 0.8 |
| Armenians | 27,332 | 0.5 |
| Russians | 19,706 | 0.4 |
| Greeks | 10,564 | 0.2 |
| Tatars | 6,191 | 0.1 |
| Gagauzes | 4,362 | 0.1 |
| Total | 5,528,741 | 100 |
| Religion | Number | % |
|---|---|---|
| Orthodox | 4,569,074 | 83.3 |
| Muslim | 789,296 | 14.4 |
| Judaism | 46,431 | 0.8 |
| Roman Catholic | 40,347 | 0.7 |
| Armenian Grecorian | 25,402 | 0.4 |
| Protestant | 6,735 | 0.1 |
| Other/Undeclared | 1,456 | 0.0 |
| Total | 5,478,741 | 100 |
31 December 1934 census
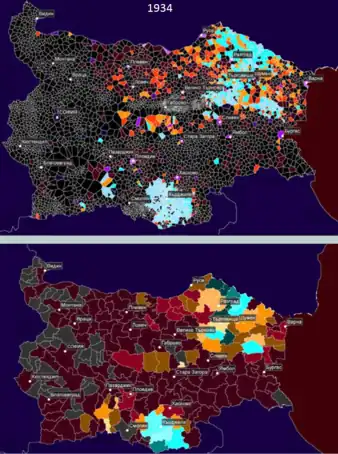
| Ethnic groups | Number | % |
|---|---|---|
| Bulgarians | 5,204,217 | 85.6 |
| Turks | 591,193 | 9.7 |
| Romani | 149,385 | 2.5 |
| Jews | 48,565 | 0.8 |
| Armenians | 25,963 | 0.4 |
| Romanians | 16,504 | 0.3 |
| Russians | 11,928 | 0.2 |
| Greeks | 9,601 | 0.2 |
| Total | 6,077,939 | 100 |
| Religion | Number | % |
|---|---|---|
| Orthodox | 5,128,890 | 84.3 |
| Muslim | 821,298 | 13.5 |
| Judaism | 48,398 | 0.7 |
| Roman Catholic | 45,704 | 0.7 |
| Armenian Grecorian | 23,476 | 0.3 |
| Protestant | 8,371 | 0.1 |
| Other/Undeclared | 1,802 | 0.0 |
| Total | 6,077,939 | 100 |
31 December 1946 census
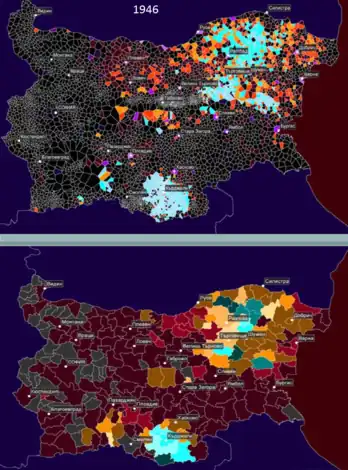
| Ethnic groups | Number | % |
|---|---|---|
| Bulgarians | 5,903,580 | 84.0 |
| Turks | 675,500 | 9.6 |
| Romani | 170,011 | 2.4 |
| Macedonians | 169,544 | 2.4 |
| Jews | 44,209 | 0.6 |
| Armenians | 21,637 | 0.3 |
| Russians | 13,200 | 0.2 |
| Total | 7,029,349 | 100 |
South Dobruja passes on the territory of Bulgaria.
There are strong indications that in the 1946 census the population was forced to list as ethnic Macedonians against their will by the communist government in accordance with an agreement with Yugoslavia.[7]
| Religion | Number | % |
|---|---|---|
| Orthodox | 5,967,992 | 84.9 |
| Muslim | ||
| Judaism | 43,335 | 0.6 |
| Total | 7,029,349 | 100 |
1 December 1956 census
| Ethnic groups | Number | % |
|---|---|---|
| Bulgarians | 6.506,541 | 85.5 |
| Turks | 656,025 | 8.6 |
| Romani | 197,865 | 2.6 |
| Macedonians | 187,789 | 2.5 |
| Armenians | 21,954 | 0.3 |
| Russians | 10,551 | 0.1 |
| Greeks | 7,437 | 0.1 |
| Jews | 6,027 | 0.1 |
| Tatars | 5,993 | 0.1 |
| Romanians | 3,749 | 0.0 |
| Sarakatsani | 2,085 | 0.0 |
| Others | 13,199 | 0.2 |
| Total | 7,613,709 | 100 |
There are strong indications that in the 1956 census the population was forced to list as ethnic Macedonians against their will by the communist government in accordance with an agreement with Yugoslavia.
1 December 1965 census
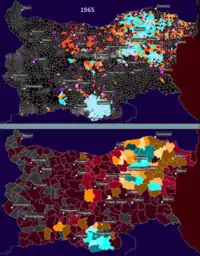
| Ethnic groups | Number | % |
|---|---|---|
| Bulgarians | 7,231,243 | 87.9 |
| Turks | 780,928 | 9.5 |
| Romani | 148,874 | 1.8 |
| Armenians | 20,282 | 0.2 |
| Russians | 10,815 | 0.1 |
| Macedonians | 9,632 | 0.1 |
| Greeks | 8,241 | 0.1 |
| Tatars | 6,430 | 0.1 |
| Jews | 5,108 | 0.1 |
| Total | 8,227,966 | 100 |
1 December 1975 census
| Ethnic groups | Number | % |
|---|---|---|
| Bulgarians | 7,930,024 | 90.9 |
| Turks | 730,728 | 8.4 |
| Romani | 18,323 | 0.2 |
| Armenians | 14,526 | 0.2 |
| Tatars | 5,963 | 0.1 |
| Jews | 3,076 | 0.0 |
| Total | 8,727,771 | 100 |
4 December 1985 census
| Number | % | |
|---|---|---|
| Total | 8,948,649 | 100 |
4 December 1992 census
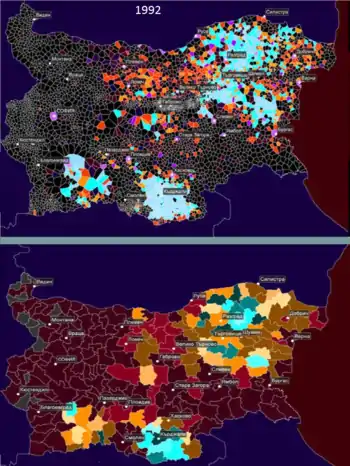
| Ethnic groups | Number | % |
|---|---|---|
| Bulgarians | 7,271,185 | 85.7 |
| Turks | 800,052 | 9.4 |
| Romani | 313,396 | 3.7 |
| Russians | 17,139 | 0.2 |
| Armenians | 13,677 | 0.2 |
| Macedonians | 10,803 | 0.1 |
| "Vlachs" (Aromanians, Romanians, Romanian-speaking Boyash) | 5,159 | 0.1 |
| Sarakatsani | 5,144 | 0.1 |
| Greeks | 4,930 | 0.1 |
| Tatars | 4,515 | 0.1 |
| Jews | 3,461 | 0.0 |
| Romanians | 2,491 | 0.0 |
| Ukrainians | 1,864 | 0.0 |
| Gagauzes | 1,478 | 0.0 |
| Others | 23,542 | 0.3 |
| Undeclared | 8,481 | 0.1 |
| Total | 8,487,317 | 100 |
| Religion | Number | % |
|---|---|---|
| Orthodox | 7,274,592 | 85.7 |
| Muslim | 1,110,295 | 13.0 |
| Roman Catholicism | 53,074 | 0.6 |
| Protestant | 21,878 | 0.2 |
| Armenian Grecorian | 9.672 | 0.1 |
| Judaism | 2,580 | 0.0 |
| Other | 15,226 | 0.1 |
| Total | 8,487,317 | 100 |
1 March 2001 census
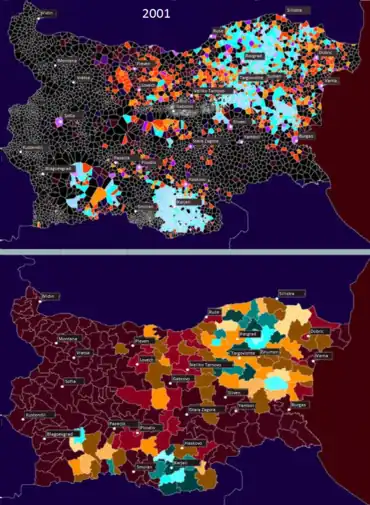
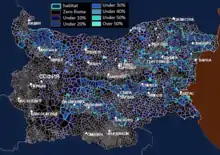
| Ethnic groups | Number | % |
|---|---|---|
| Bulgarians | 6,655,210 | 83.9 |
| Turks | 746,664 | 9.4 |
| Romani | 370,908 | 4.7 |
| Russians | 15,595 | 0.2 |
| Armenians | 10,832 | 0.1 |
| "Vlachs" (Aromanians, Romanians, Romanian-speaking Boyash) | 10,566 | 0.1 |
| Macedonians | 5,071 | 0.1 |
| Sarakatsani | 4,107 | 0.1 |
| Greeks | 3,408 | 0.0 |
| Ukrainians | 2,489 | 0.0 |
| Tatars | 1,803 | 0.0 |
| Jews | 1,363 | 0.0 |
| Romanians | 1,088 | 0.0 |
| Gagauzes | 540 | 0.0 |
| Others | 3,342 | 0.2 |
| Undeclared | 86,915 | 1.1 |
| Total | 7,932,984 | 100 |
| Religion | Number | % |
|---|---|---|
| Orthodox | 6,552,751 | 82.6 |
| Muslim | 966,978 | 12.1 |
| Roman Catholic | 43,811 | 0.5 |
| Protestant | 42,308 | 0.5 |
| Other | 14,937 | 0.1 |
| Undeclared | 308,116 | 3.9 |
| Total | 7,928,901 | 100 |
| Language | Number | % |
|---|---|---|
| Bulgarian | 6,697,158 | 84.6 |
| Turkish | 762,516 | 9.6 |
| Roma | 327,882 | 4.13 |
| Other | 71,084 | 0.9 |
| Undeclared | 70,261 | 0.9 |
| Total | 7,928,901 | 100 |
1 February 2011 census
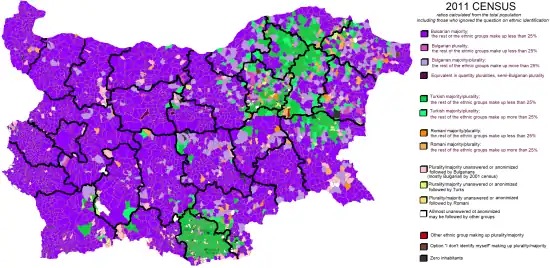
| Ethnic groups | Number | % |
|---|---|---|
| Bulgarians | 5,664,624 | 84.8 |
| Turks | 588,318 | 8.8 |
| Romani | 325,343 | 4.9 |
| Russians | 9,978 | 0.1 |
| Armenians | 6,552 | 0.1 |
| "Vlachs" (Aromanians, Romanians, Romanian-speaking Boyash) | 3,684 | 0.1 |
| Sarakatsani | 2,556 | 0.0 |
| Ukrainians | 1,789 | 0.0 |
| Macedonians | 1,654 | 0.0 |
| Greeks | 1,379 | 0.0 |
| Jews | 1,162 | 0.0 |
| Romanians | 891 | 0.0 |
| Others | 19,659 | 0.3 |
| Undeclared | 736,981 | 10.0 |
| Total | 7,364,570 | 100 |
The 2011 percentage of the ethnic groups is calculated only from those who answered the optional question on ethnicity (6,680,980 in total) and does not include around 750,000 people who did not answer the question or 10% from the population.
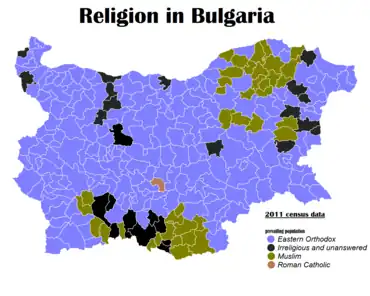
| Religion | Number | % |
|---|---|---|
| Orthodox | 4,374,135 | 59.3 |
| Muslim | 577,139 | 7.8 |
| Protestant | 64,476 | 0.8 |
| Roman Catholic | 48,945 | 0.6 |
| Others | 11,444 | 0.1 |
| Atheism | 272,264 | 3.6 |
| Undeclared | 2,016,167 | 27.4 |
| Total | 7,364,570 | 100 |
| Language | Number | % |
|---|---|---|
| Bulgarian | 5,659,024 | 85.2 |
| Turkish | 605,802 | 9.1 |
| Roma | 281,217 | 4.2 |
| Russians | 15,808 | 0.2 |
| Armenian | 5,615 | 0.0 |
| Romanian | 5,523 | 0.0 |
| Greek | 3,224 | 0.0 |
| "Vlach" (Aromanian and Romanian) | 1,826 | 0.0 |
| Ukrainian | 1,755 | 0.0 |
| Macedonian | 1,404 | 0.0 |
| Arabic | 1,397 | 0.0 |
| Tatar | 1,372 | 0.0 |
| Other | 10,623 | 0.1 |
| Undeclared | 47,564 | 0.7 |
| Total returns | 6,642,154 | 100 |
| Total population | 7,364,570 |
7 September 2021 census
| Ethnic groups | Number | % |
|---|---|---|
| Bulgarians | 5,118,494 | 78.5 |
| Turks | 508,378 | 7.8 |
| Romani | 266,720 | 4.1 |
| Russians | 14,218 | 0.2 |
| Armenians | 5,306 | 0.1 |
| Ukrainians | 3,239 | 0.0 |
| Sarakatsani | 2,071 | 0.0 |
| Vlachs | 1,643 | 0.0 |
| Greeks | 1,625 | 0.0 |
| Jews | 1,153 | 0.0 |
| Macedonians | 1,143 | 0.0 |
| Tatars | 1,129 | 0.0 |
| Romanians | 683 | 0.0 |
| Others | 32,210 | 0.5 |
| Undeclared | 547,191 | 8.4 |
| Total | 6,519,789 | 100 |
References
- statlib.nsi.bg:8181, 2017-03-03, archived from the original on 2017-03-03
- "A brief historical account of the population censuses in Bulgaria". Archived from the original on 2004-03-15.
- "Principality of Bulgaria in historical and geographical terms". Archived from the original on 2016-01-07.
- "Structure of the population by religion". Archived from the original on 2004-03-15.
- "Population by place of residence, sex and ethnic group". Archived from the original on 2018-06-09.
- "Structure of the population by religion". Archived from the original on 2004-03-15.
- Minority Policy in Bulgaria. The Policy of the Bulgarian Communist Party towards Jews, Roma, Pomaks and Turks 1944-1989. Ulrich Büchsenschütz. IMIR, Sofia, 2000, p. 5; (in Bulgarian).
- "6.1 European population committee (The demographic characteristics of the main ethnic/national minorities in Bulgaria". Archived from the original on 2017-02-04.
- "POPULATION AS OF 1 MARCH 2001 BY DISTRICT AND ETHNIC GROUP (Inhabitants as of 1 March 2001 by province and ethnic group)". Archived from the original on 2004-03-15.
- "Population by place of residence, sex and ethnic group". Archived from the original on 2017-05-30.
External links
- 2011 Bulgaria census site from the National Statistical Institute (Bulgaria)
- 2021 Bulgaria census site from the National Statistical Institute (Bulgaria)