Dry Creek, Alaska
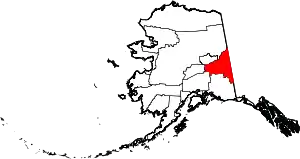
Dry Creek is a census-designated place (CDP) in Southeast Fairbanks Census Area, Alaska, United States. At the 2010 census the population was 94, down from 128 in 2000.
Dry Creek, Alaska | |
|---|---|
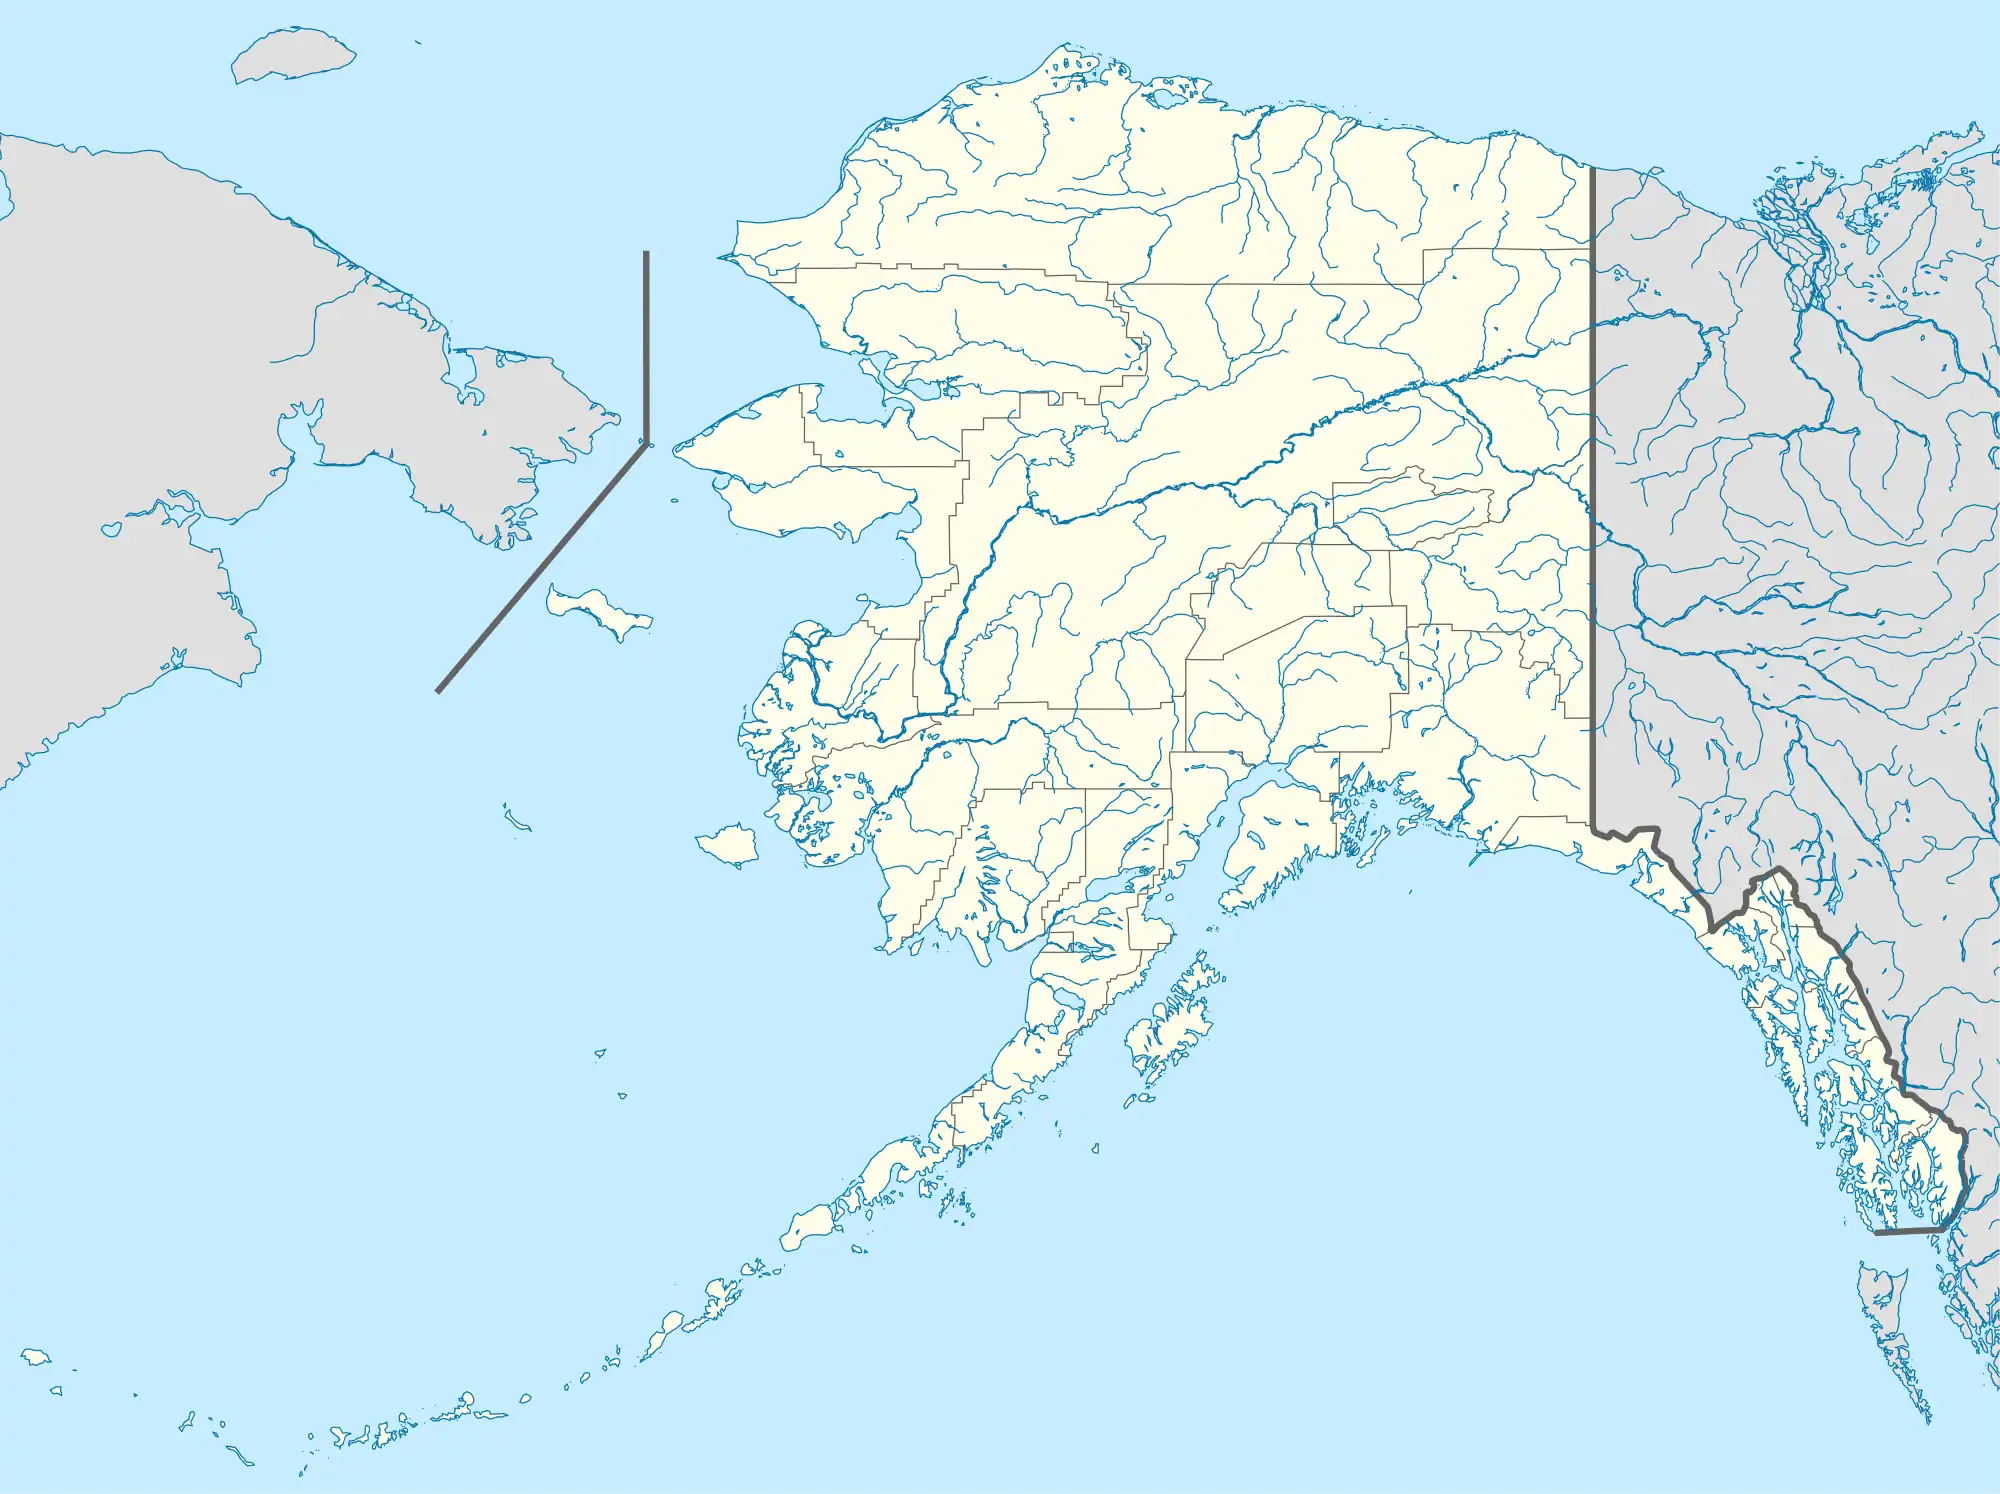
 Dry Creek, Alaska Location within the state of Alaska | |
| Coordinates: 63°41′1″N 144°36′15″W | |
| Country | United States |
| State | Alaska |
| Census Area | Southeast Fairbanks |
| Government | |
| • State senator | Click Bishop (R) |
| • State rep. | Mike Cronk (R) |
| Area | |
| • Total | 140.24 sq mi (363.22 km2) |
| • Land | 140.17 sq mi (363.04 km2) |
| • Water | 0.07 sq mi (0.17 km2) |
| Elevation | 1,857 ft (566 m) |
| Population (2020) | |
| • Total | 61 |
| • Density | 0.44/sq mi (0.17/km2) |
| Time zone | UTC-9 (Alaska (AKST)) |
| • Summer (DST) | UTC-8 (AKDT) |
| Area code | 907 |
| FIPS code | 02-20020 |
| GNIS feature ID | 1866943 |
Geography
Dry Creek is located at 63°41′1″N 144°36′15″W (63.683609, −144.604040).[2]
According to the United States Census Bureau, the CDP has a total area of 156.5 square miles (405 km2), of which 156.4 square miles (405 km2) (99.94%) is land and 0.1 square miles (0.26 km2) (0.06%) is water.
Climate
Dry Creek has a subarctic climate (Köppen climate classification: Dfc).
| Climate data for Dry Creek, Alaska, 1991–2020 normals, extremes 1996–present | |||||||||||||
|---|---|---|---|---|---|---|---|---|---|---|---|---|---|
| Month | Jan | Feb | Mar | Apr | May | Jun | Jul | Aug | Sep | Oct | Nov | Dec | Year |
| Record high °F (°C) | 53 (12) |
52 (11) |
59 (15) |
75 (24) |
88 (31) |
95 (35) |
90 (32) |
90 (32) |
72 (22) |
76 (24) |
46 (8) |
60 (16) |
95 (35) |
| Mean maximum °F (°C) | 32.7 (0.4) |
34.5 (1.4) |
43.9 (6.6) |
59.9 (15.5) |
76.7 (24.8) |
84.0 (28.9) |
84.6 (29.2) |
79.5 (26.4) |
68.0 (20.0) |
52.3 (11.3) |
30.7 (−0.7) |
30.0 (−1.1) |
86.5 (30.3) |
| Average high °F (°C) | 0.8 (−17.3) |
11.0 (−11.7) |
25.0 (−3.9) |
45.1 (7.3) |
59.3 (15.2) |
69.5 (20.8) |
71.5 (21.9) |
65.5 (18.6) |
53.4 (11.9) |
32.5 (0.3) |
10.6 (−11.9) |
2.9 (−16.2) |
37.3 (2.9) |
| Daily mean °F (°C) | −6.9 (−21.6) |
1.3 (−17.1) |
12.0 (−11.1) |
33.1 (0.6) |
47.0 (8.3) |
57.6 (14.2) |
60.1 (15.6) |
54.5 (12.5) |
43.7 (6.5) |
24.7 (−4.1) |
3.7 (−15.7) |
−4.3 (−20.2) |
27.2 (−2.7) |
| Average low °F (°C) | −14.7 (−25.9) |
−8.4 (−22.4) |
−1.1 (−18.4) |
21.1 (−6.1) |
34.7 (1.5) |
45.6 (7.6) |
48.8 (9.3) |
43.5 (6.4) |
33.9 (1.1) |
16.8 (−8.4) |
−3.2 (−19.6) |
−11.5 (−24.2) |
17.1 (−8.3) |
| Mean minimum °F (°C) | −44.5 (−42.5) |
−40.1 (−40.1) |
−32.3 (−35.7) |
−6.3 (−21.3) |
20.1 (−6.6) |
30.5 (−0.8) |
36.2 (2.3) |
27.6 (−2.4) |
15.3 (−9.3) |
−10.0 (−23.3) |
−31.5 (−35.3) |
−36.3 (−37.9) |
−47.9 (−44.4) |
| Record low °F (°C) | −62 (−52) |
−58 (−50) |
−51 (−46) |
−35 (−37) |
10 (−12) |
20 (−7) |
30 (−1) |
20 (−7) |
0 (−18) |
−38 (−39) |
−45 (−43) |
−51 (−46) |
−62 (−52) |
| Average precipitation inches (mm) | 0.61 (15) |
0.41 (10) |
0.48 (12) |
0.46 (12) |
1.18 (30) |
2.65 (67) |
3.04 (77) |
2.67 (68) |
1.63 (41) |
1.09 (28) |
0.75 (19) |
0.72 (18) |
15.69 (397) |
| Average snowfall inches (cm) | 7.8 (20) |
6.1 (15) |
6.6 (17) |
4.0 (10) |
1.0 (2.5) |
0.0 (0.0) |
0.0 (0.0) |
0.0 (0.0) |
2.1 (5.3) |
11.1 (28) |
9.3 (24) |
9.4 (24) |
57.4 (145.8) |
| Average precipitation days (≥ 0.01 in) | 9.5 | 6.1 | 6.2 | 5.2 | 8.6 | 12.9 | 15.1 | 14.2 | 10.2 | 10.6 | 10.1 | 8.9 | 117.6 |
| Average snowy days (≥ 0.1 in) | 9.4 | 6.4 | 6.3 | 3.9 | 1.0 | 0.0 | 0.0 | 0.0 | 1.4 | 8.5 | 9.9 | 8.8 | 55.6 |
| Source 1: NOAA[3] | |||||||||||||
| Source 2: National Weather Service (mean maxima and minima 2006–2020)[4] | |||||||||||||
Demographics
| Census | Pop. | Note | %± |
|---|---|---|---|
| 1990 | 106 | — | |
| 2000 | 128 | 20.8% | |
| 2010 | 94 | −26.6% | |
| 2020 | 61 | −35.1% | |
| U.S. Decennial Census[5] | |||
Dry Creek first appeared on the 1990 U.S. Census as a census-designated place (CDP).
As of the census[6] of 2000, there were 128 people, 37 households, and 30 families residing in the CDP. The population density was 0.8 inhabitants per square mile (0.31/km2). There were 38 housing units at an average density of 0.2 per square mile (0.077/km2). The racial makeup of the CDP was 100.00% White. 7.03% of the population were Hispanic or Latino of any race.
There were 37 households, out of which 54.1% had children under the age of 18 living with them, 78.4% were married couples living together, 2.7% had a female householder with no husband present, and 18.9% were non-families. 13.5% of all households were made up of individuals, and 5.4% had someone living alone who was 65 years of age or older. The average household size was 3.46 and the average family size was 3.87.
In the CDP, the population was spread out, with 43.8% under the age of 18, 4.7% from 18 to 24, 29.7% from 25 to 44, 14.1% from 45 to 64, and 7.8% who were 65 years of age or older. The median age was 26 years. For every 100 females, there were 106.5 males. For every 100 females age 18 and over, there were 94.6 males.
The median income for a household in the CDP was $12,500, and the median income for a family was $10,000. Males had a median income of $46,250 versus $0 for females. The per capita income for the CDP was $7,780. There were 62.5% of families and 69.4% of the population living below the poverty line, including 73.8% of under eighteens and none of those over 64.
Many abuses have been reported since the beginning of this religious commune.[7]
References
- "2020 U.S. Gazetteer Files". United States Census Bureau. Retrieved October 29, 2021.
- "US Gazetteer files: 2010, 2000, and 1990". United States Census Bureau. February 12, 2011. Retrieved April 23, 2011.
- "U.S. Climate Normals Quick Access". National Oceanic and Atmospheric Administration. Retrieved September 13, 2022.
- "NOAA Online Weather Data – NWS Fairbanks". National Weather Service. Retrieved November 4, 2022.
- "U.S. Decennial Census". Census.gov. Retrieved June 6, 2013.
- "U.S. Census website". United States Census Bureau. Retrieved January 31, 2008.
- Kocsis, Vennie (June 26, 2014). Cult Child. ISBN 978-0692235645.
