Fort Whyte
Fort Whyte is a provincial electoral division in the Canadian province of Manitoba. It was created in 1999, after the provincial electoral boundaries commission determined that southwestern Winnipeg had experienced enough population growth to deserve an extra seat. Fort Whyte was created from territory formerly belonging to the divisions of Tuxedo, Fort Garry and St. Norbert.
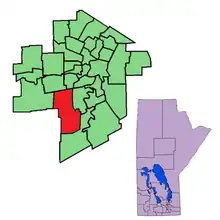
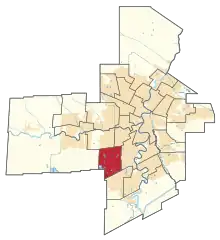 Location in Winnipeg | |||
| Provincial electoral district | |||
| Legislature | Legislative Assembly of Manitoba | ||
| MLA |
Progressive Conservative | ||
| District created | 1999 | ||
| First contested | 1999 | ||
| Last contested | 2022 | ||
| Demographics | |||
| Census division(s) | Division No. 11 | ||
| Census subdivision(s) | Winnipeg | ||
The current MLA for Fort Whyte is Obby Khan, a Progressive Conservative. Khan succeeded fellow Progressive Conservative and former Premier of Manitoba Brian Pallister following his resignation in 2021.
Constituency profile
Geography
Following Manitoba's 2018 electoral redistribution, Fort Whyte is bordered to the east by Fort Garry, to the south by Waverley, to the west by Roblin, and to the north by River Heights and Tuxedo.[1]
Demographics
The constituency's population in 2018 was 21,780. The average family income in 2018 was $117,535. The unemployment rate is 4.9%, and 19.2% of the population is above 65 years of age. Almost 42% of the population have university degrees. Health and social services account for 13.5% of Fort Whyte's industry, with a further 10.4% in Retail Trade.
Fort Whyte is an ethnically diverse constituency, with an immigrant population of 25.6%. 6.7% of the riding's residents are East Indian, 5.6% are Chinese.
Political history
The constituency has been held by the Progressive Conservative Party of Manitoba (PCs) for its entire existence, and has always been comfortably safe for that party. The riding's first Member of the Legislative Assembly (MLA), John Loewen, won it handily in 1999 even as the Tories were soundly defeated by the New Democratic Party of Manitoba in that year's provincial election, after having been in government for over eleven years. On September 23, 2005, Loewen announced that he was leaving provincial politics to seek the Liberal Party of Canada's nomination for Charleswood—St. James—Assiniboia in the federal election anticipated. He formally resigned from the legislature on September 26.
On December 13, 2005, a by-election was held to fill Loewen's seat. The winner was another Tory, Hugh McFadyen. A few months later, McFadyen became leader of the provincial PCs. McFadyen was easily re-elected in the 2007 provincial election, but was one of only four PC MLAs returned from Winnipeg. After the PCs were again defeated in 2011, McFadyen announced he would retire from politics as soon as a successor was chosen.
Former provincial MLA and federal MP Brian Pallister was elected his successor, and easily won Fort Whyte in the ensuing by-election. Pallister served as Premier of Manitoba while MLA for Fort Whyte from 2016, leading the party to a second electoral mandate in 2019, until 2021, when he resigned first as premier and later as an MLA.
A by-election to replace his vacancy was held on March 22, 2022. Obby Khan, a fellow Progressive Conservative, won the seat, defeating Liberal candidate Willard Reaves. Khan successfully won reelection in 2023.[2]
List of provincial representatives
| Parliament | Years | Member | Party | |
|---|---|---|---|---|
| Riding created from Tuxedo, Fort Garry and St. Norbert | ||||
| 37th | 1999–2003 | John Loewen | Progressive Conservative | |
| 38th | 2003–2005 | |||
| 2005–2007 | Hugh McFadyen | |||
| 39th | 2007–2011 | |||
| 40th | 2011–2012 | |||
| 2012–2016 | Brian Pallister | |||
| 41st | 2016–2019 | |||
| 42nd | 2019–2021 | |||
| 2022–2023 | Obby Khan | |||
| 43rd | 2023–present | |||
Electoral history
| 2023 Manitoba general election | ||||||||
|---|---|---|---|---|---|---|---|---|
| ** Preliminary results — Not yet official ** | ||||||||
| Party | Candidate | Votes | % | ±% | Expenditures | |||
| Progressive Conservative | Obby Khan | 5,442 | 47.86 | +5.35 | ||||
| Liberal | Willard Reaves | 4,212 | 37.04 | -2.73 | ||||
| New Democratic | Trudy Schroeder | 1,716 | 15.09 | -0.41 | ||||
| Total valid votes/Expense limit | 11,370 | 99.58 | -0.21 | |||||
| Total rejected, unmarked and declined ballots | 48 | 0.42 | +0.21 | |||||
| Turnout | 11,418 | 67.92 | +25.30 | |||||
| Eligible voters | 16,810 | |||||||
| Progressive Conservative hold | Swing | +4.04 | ||||||
Source(s)
Source: Elections Manitoba[3] | ||||||||
| Manitoba provincial by-election, March 22, 2022 Resignation of Brian Pallister | ||||||||
|---|---|---|---|---|---|---|---|---|
| Party | Candidate | Votes | % | ±% | Expenditures | |||
| Progressive Conservative | Obby Khan | 3,050 | 42.51 | -14.68 | ||||
| Liberal | Willard Reaves | 2,853 | 39.77 | +22.53 | ||||
| New Democratic | Trudy Schroeder | 1,112 | 15.50 | -2.38 | ||||
| Independent | Patrick Allard | 101 | 1.41 | — | ||||
| Green | Nicolas Geddert | 55 | 0.77 | -6.00 | ||||
| Total valid votes | 7,174 | |||||||
| Total rejected ballots | 15 | 0.21 | -0.33 | |||||
| Turnout | 7,189 | 42.62 | -14.57 | |||||
| Eligible voters | 15,907 | — | -0.29 | |||||
| Progressive Conservative hold | Swing | -18.61 | ||||||
| Source: Elections Manitoba[4] | ||||||||
| 2019 Manitoba general election | ||||||||
|---|---|---|---|---|---|---|---|---|
| Party | Candidate | Votes | % | ±% | Expenditures | |||
| Progressive Conservative | Brian Pallister | 5,619 | 57.19 | -8.2 | $10,131.35 | |||
| New Democratic | Beatrice Bruske | 1,757 | 17.88 | +2.2 | $106.40 | |||
| Liberal | Darrel Morin | 1,731 | 17.62 | +6.2 | $545.68 | |||
| Green | Sara Campbell | 665 | 6.77 | -0.4 | $0.00 | |||
| Manitoba First | Jason Holenski | 54 | 0.55 | -1.1 | $1,210.90 | |||
| Total valid votes | 9,826 | 99.36 | ||||||
| Total rejected ballots | 63 | 0.64 | – | |||||
| Turnout | 9,889 | 60.35 | – | |||||
| Eligible voters | 16,386 | |||||||
| Progressive Conservative hold | Swing | -5.2 | ||||||
| Source: Elections Manitoba[5][6][7] | ||||||||
| 2016 provincial election redistributed results[8] | |||
|---|---|---|---|
| Party | % | ||
| Progressive Conservative | 65.4 | ||
| New Democratic | 15.7 | ||
| Liberal | 11.4 | ||
| Green | 7.2 | ||
| Manitoba | 1.3 | ||
| 2016 Manitoba general election | ||||||||
|---|---|---|---|---|---|---|---|---|
| Party | Candidate | Votes | % | ±% | Expenditures | |||
| Progressive Conservative | Brian Pallister | 6,775 | 64.18 | +8.96 | $14,965.48 | |||
| New Democratic | George Wong | 1,718 | 16.28 | +5.02 | $18,573.44 | |||
| Liberal | Peter Bastians | 1,205 | 11.42 | -20.10 | $8,194.92 | |||
| Green | Carli Runions | 731 | 6.92 | +5.20 | $10.00 | |||
| Manitoba | Daryl Newis | 127 | 1.20 | $920.97 | ||||
| Total valid votes/expense limit | 10,556 | 98.79 | $54,710.00 | |||||
| Total rejected ballots | 129 | 1.21 | +1.06 | |||||
| Turnout | 10,685 | 60.71 | +19.07 | |||||
| Eligible voters | 17,599 | |||||||
| Progressive Conservative hold | Swing | +1.97 | ||||||
| Source: Elections Manitoba[9] | ||||||||
| Manitoba provincial by-election, September 4, 2012 Resignation of Hugh McFadyen | ||||||||
|---|---|---|---|---|---|---|---|---|
| Party | Candidate | Votes | % | ±% | Expenditures | |||
| Progressive Conservative | Brian Pallister | 3,626 | 55.22 | -7.22 | $32,215.06 | |||
| Liberal | Bob Axworthy | 2,069 | 31.51 | +23.59 | $28,872.72 | |||
| New Democratic | Brandy Schmidt | 739 | 11.25 | -18.38 | $10,860.67 | |||
| Green | Donnie Benham | 113 | 1.72 | – | $789.44 | |||
| Independent | Darrell Ackman | 19 | 0.29 | 211.37 | ||||
| Total valid votes | 6,566 | 99.85 | ||||||
| Total rejected ballots | 10 | 0.15 | -0.34 | |||||
| Turnout | 6,576 | 41.64 | -20.27 | |||||
| Eligible voters | 15,792 | – | ||||||
| Progressive Conservative hold | Swing | -15.40 | ||||||
| 2011 Manitoba general election | ||||||||
|---|---|---|---|---|---|---|---|---|
| Party | Candidate | Votes | % | ±% | Expenditures | |||
| Progressive Conservative | Hugh McFadyen | 5,594 | 62.44 | +10.49 | $23,755.75 | |||
| New Democratic | Sunny Dhaliwal | 2,655 | 29.64 | −4.20 | $99.38 | |||
| Liberal | Chae Tsai | 710 | 7.92 | −6.29 | $829.64 | |||
| Total valid votes | 8,959 | 99.51 | ||||||
| Rejected and declined votes | 44 | 0.49 | +0.16 | |||||
| Turnout | 9,003 | 61.91 | +2.76 | |||||
| Electors on the lists | 14,542 | |||||||
| Progressive Conservative hold | Swing | +7.34 | ||||||
| Source: Elections Manitoba[10][11] | ||||||||
* Percent change is not based on redistributed results
| 2007 Manitoba general election | ||||||||
|---|---|---|---|---|---|---|---|---|
| Party | Candidate | Votes | % | ±% | Expenditures | |||
| Progressive Conservative | Hugh McFadyen | 5,981 | 51.95 | −0.31 | $20,363.37 | |||
| New Democratic | Sunny Dhaliwal | 3,895 | 33.83 | +9.40 | $5,331.36 | |||
| Liberal | Angelina Olivier-Job | 1,637 | 14.22 | −7.41 | $2,162.37 | |||
| Total valid votes | 11,513 | 99.67 | ||||||
| Rejected and declined votes | 38 | 0.33 | +0.24 | |||||
| Turnout | 11,551 | 59.15 | +21.08 | |||||
| Electors on the lists | 19,527 | |||||||
| Progressive Conservative hold | Swing | -4.90 | ||||||
| Manitoba provincial by-election, December 16, 2005 Resignation of John Loewen | ||||||||
|---|---|---|---|---|---|---|---|---|
| Party | Candidate | Votes | % | ±% | Expenditures | |||
| Progressive Conservative | Hugh McFadyen | 3,542 | 52.26 | −0.45 | $27,219.00 | |||
| New Democratic | Christina McDonald | 1,650 | 24.34 | −3.79 | $18,333.89 | |||
| Liberal | Jean Paterson | 1,466 | 21.63 | +2.47 | $6,134.47 | |||
| Green | Shelagh Pizey-Allen | 120 | 1.77 | – | $233.71 | |||
| Total valid votes | 6,778 | 99.91 | ||||||
| Rejected ballots | 6 | 0.09 | -0.17 | |||||
| Turnout | 6,784 | 38.07 | −18.54 | |||||
| Registered voters | 17,820 | |||||||
| Progressive Conservative hold | Swing | +1.67 | ||||||
| 2003 Manitoba general election | ||||||||
|---|---|---|---|---|---|---|---|---|
| Party | Candidate | Votes | % | ±% | Expenditures | |||
| Progressive Conservative | John Loewen | 4,960 | 52.71 | −9.02 | $13,693.53 | |||
| New Democratic | Janine Ballingall Scotten | 2,647 | 28.13 | +1.31 | $18,368.88 | |||
| Liberal | Gerry Sankar | 1,803 | 19.16 | +7.71 | $14,257.51 | |||
| Total valid votes | 9,410 | 99.75 | ||||||
| Rejected and declined votes | 24 | 0.25 | -0.37 | |||||
| Turnout | 9,434 | 56.61 | −19.81 | |||||
| Electors on the lists | 16,664 | |||||||
| Progressive Conservative hold | Swing | -5.17 | ||||||
| 1999 Manitoba general election | ||||||||
|---|---|---|---|---|---|---|---|---|
| Party | Candidate | Votes | % | Expenditures | ||||
| Progressive Conservative | John Loewen | 6,480 | 61.73 | $25,444.88 | ||||
| New Democratic | Bidhu Jha | 2,815 | 26.82 | $24,511.00 | ||||
| Liberal | Malli Aulakh | 1,202 | 11.45 | $18,808.08 | ||||
| Total valid votes | 10,497 | 99.38 | ||||||
| Rejected and declined votes | 66 | 0.62 | ||||||
| Turnout | 10,563 | 76.43 | ||||||
| Registered voters | 13,821 | |||||||
Previous boundaries
References
- Elections Manitoba electoral map of Winnipeg, 2018
- "Obby Khan beats Willard Reaves in Manitoba election battle of former Winnipeg Blue Bombers". 3DownNation. October 4, 2023. Retrieved October 4, 2023.
- "Elections Manitoba - Manitoba's 43rd General Election - October 3, 2023 - Unofficial Results". results.electionsmanitoba.ca. Elections Manitoba. Retrieved October 5, 2023.
- "2022 Byelection: Fort Whyte" (PDF). Elections Manitoba. March 22, 2022. Retrieved April 12, 2022.
- "41ST GENERAL ELECTION, APRIL 19, 2016 - OFFICIAL RESULTS". Elections Manitoba. April 19, 2016. Retrieved November 18, 2016.
- "Candidate Election Returns General Election 2019". Elections Manitoba. September 2019. Retrieved April 20, 2020.
- "RESULTS SUMMARY: 42ND GENERAL ELECTION / COMPTE RENDU DES RÉSULTATS: 42E ÉLECTION GÉNÉRALE" (PDF). Elections Manitoba. November 6, 2019. Retrieved October 6, 2021.
- Marcoux, Jacques (August 27, 2019). "New Manitoba election boundaries give upper hand to Progressive Conservatives, CBC News analysis finds". CBC. Retrieved October 6, 2021.
- "2016 VOTING AREA MAPS AND STATIONBYSTATION RESULTS" (PDF). Elections Manitoba. 2016. Retrieved December 25, 2021.
- "2011 Voting Area Maps and Station-by-Station Results" (PDF). Elections Manitoba. 2011. Retrieved December 25, 2021.
- "Election Returns: 40th General Election". Elections Manitoba. 2011. Retrieved September 7, 2018.