Projections of population growth
Population projections are attempts to show how the human population statistics might change in the future.[1] These projections are an important input to forecasts of the population's impact on this planet and humanity's future well-being.[2] Models of population growth take trends in human development and apply projections into the future.[3] These models use trend-based-assumptions about how populations will respond to economic, social and technological forces to understand how they will affect fertility and mortality, and thus population growth.[3]
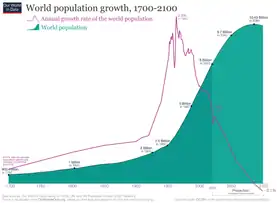
The 2022 projections from the United Nations Population Division (chart #1) show that annual world population growth peaked at 2.3% per year in 1963, has since dropped to 0.9% in 2023, equivalent to about 74 million people each year, and projected that it could drop even further to minus 0.1% by 2100.[4] Based on this, the UN projected that the world population, 8 billion as of 2023, would peak around the year 2086 at about 10.4 billion, and then start a slow decline, assuming a continuing decrease in the global average fertility rate from 2.5 births per woman during the 2015–2020 period to 1.8 by the year 2100, (the medium-variant projection).[5][6]
However, estimates outside of the United Nations have put forward alternative models based on additional downward pressure on fertility (such as successful implementation of education and family planning goals in the UN's Sustainable Development Goals) which could result in peak population during the 2060–2070 period rather than later.[3][7]
According to the UN, of the predicted growth in world population between 2020 and 2050, all of that change will come from less developed countries, and more than half will come from sub-Saharan Africa.[8] Half of the growth will come from just eight countries, five of which are in Africa.[5][6] It is predicted that the population of sub-Saharan Africa will double by 2050.[8] The Pew Research Center observes that 50% of births in the year 2100 will be in Africa.[9] Other organizations project lower levels of population growth in Africa, based particularly on improvement in women's education and successful implementation of family planning.[10]

During the remainder of this century some countries will see population growth, some will see population decline. For example the UN projects that Nigeria will gain about 340 million people, about the present population of the US, to become the 3rd most populous country, and China will lose almost half of its population.[5][6]
Even though the global fertility rate continues to fall, chart #2 shows that because of population momentum the global population will continue to grow, although at a steadily slower rate, until the mid 2080s (the median line).
The main driver of long-term future population growth on this planet is projected to be the continuing evolution of fertility and mortality.[3]
History of population projections
Projections of global human population are generally based on birth rates and death rates, and since these are difficult to predict very far into the future, forecasts of global population numbers and growth rates have changed over time.
Walter Greiling projected in the 1950s that world population would reach a peak of about nine billion in the 21st century and then stop growing after an improvement in public health in less developed countries.[12]
Estimates published in the early 2000s tended to predict that the population of Earth would stop increasing around 2070.[13] For example in a 2004 long-term prospective report, the United Nations Population Division projected that world population would peak at 9.2 billion in 2075 and then stabilize at a value close to 9 billion out to as far as the year 2300.[14]
Jørgen Randers, one of the authors of the seminal 1972 long-term simulations in The Limits to Growth, offered an alternative scenario in a 2012 book, arguing that traditional projections insufficiently take into account the downward impact of global urbanization on fertility. Randers' "most likely scenario" predicted a peak in world population in the early 2040s at about 8.1 billion people, followed by decline.[15]
In 2012, the UN changed its prediction to the effect that no maximum would likely be reached in the 21st century, and that by the year 2100 world population would increase to somewhere in the range 9.6 to 12.3 billion with 10.9 billion being the midpoint of that range.[16] The main reason for the revision was a recognition that the high fertility rate in Africa was not declining as fast as had been previously assumed.[17]
Another 2014 paper by demographers from several universities, using data from the UN's 2014 report and their own statistical methods, forecast that the world's population would reach about 10.9 billion in 2100 and continue growing thereafter.[18]
In 2017 the UN predicted that global population would reach 11.2 billion by 2100 and still be growing then at the rate of 0.1% per year.[19]
The most recent 2022 revision of the UN's World Population Prospects report[20] represents a departure from the pattern of the previous ten years and expects that a slowing of the population growth rate will lead to a population peak of 10.4 billion in the 2080s, after which it would then begin to slowly fall. This shift from earlier projections of peak population and predicted date of zero population growth comes from a more rapid drop in Africa’s birth rate than previous projections had expected.[21] For example, the 2012 report predicted that the population of Nigeria, Africa’s most populous country, would rise to 914 million by 2100; the 2022 report lowers that to 546 million, a reduction of 368 million.[16][6][21] Jose Rimon of Johns Hopkins University suggested, "We have been underestimating what is happening in terms of fertility change in Africa. Africa will probably undergo the same kind of rapid changes as east Asia did."[21]
Drivers of population change
The population of a country or area grows or declines through the interaction of three demographic drivers: fertility, mortality, and migration.[2]
Fertility

Fertility is expressed as the total fertility rate (TFR), a measure of the number of children on average that a woman will bear in her lifetime. With longevity trending towards uniform and stable values worldwide, the main driver of future population growth will be the evolution of the fertility rate.[22]
Where fertility is high, demographers generally assume that fertility will decline and eventually stabilize at about two children per woman.[2]
During the period 2015–2020, the average world fertility rate was 2.5 children per woman, about half the level in 1950–1955 (5 children per woman). In the medium variant, global fertility is projected to decline further to 2.2 in 2045-2050 and to 1.8 in 2095–2100.[22][23]
Mortality
If the mortality rate is relatively high and the resulting life expectancy is therefore relatively low, changes in mortality can have a material impact on population growth. Where the mortality rate is low and life expectancy has therefore risen, a change in mortality will have much less of an effect.[2]
Because child mortality has declined substantially over the last several decades,[2] global life expectancy at birth, has risen from 48 years in 1950–1955 to 67 years in 2000–2005, is expected to keep rising to reach 77 years in 2045–2050 and 83 years in 2095–2100. In the more Developed regions, the projected increase is from 76 years during the period 2000–2005 to 84 years during the period 2045–2050 and 90 in 2095–2100. Among the Less Developed countries, where life expectancy during the period 2000–2005 was just under 66 years, it is expected to be 76 years in 2045–2050 and 81 years by 2100.[24][25]
Migration
Migration can have a significant effect on population change. Global South-South migration accounts for 38% of total migration, and Global South-North for 34%.[26] For example, the United Nations reports that during the period 2010–2020, fourteen countries will have seen a net inflow of more than one million migrants, while ten countries will have seen a net outflow of similar proportions. The largest migratory outflows have been in response to demand for workers in other countries (Bangladesh, Nepal and the Philippines) or to insecurity in the home country (Myanmar, Syria and Venezuela). Belarus, Estonia, Germany, Hungary, Italy, Japan, the Russian Federation, Serbia and Ukraine have experienced a net inflow of migrants over the decade, helping to offset population losses caused by a negative natural increase (births minus deaths).[27]
World population projections
.svg.png.webp)
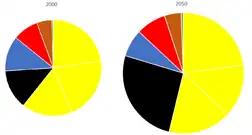
Asia Africa Europe Latin America Northern America Oceania
This section describes near-term population changes, up to the year 2050, and long-term population changes, out to the year 2100.
Up to 2050
The median scenario of the UN's 2022 World Population Prospects predicts the following populations per region in 2050 compared to population in 2000, and shows the differing growth rates for each over the first half of this century.[23][6]
| 2000 | 2050 | Growth | %/yr | |
|---|---|---|---|---|
| Asia | 3.7 | 5.3 | +43% | +0.7% |
| Africa | 0.8 | 2.5 | +212% | +2.3% |
| Europe | 0.7 | 0.7 | 0% | 0.0% |
| Latin America & the Caribbean | 0.5 | 0.7 | +40% | +0.7% |
| Northern America | 0.3 | 0.4 | +33% | +0.6% |
| Oceania | 0.03 | 0.06 | +100% | +1.4% |
| World | 6.1 | 9.7 | +60% | +0.9% |
After 2050
Projections of population beyond the year 2050 tend to vary depending on the organization making them because each will be making their own assumptions of the drivers of population change: fertility, mortality and migration.
United Nations projections
The UN Population Division report of 2022 projects world population to continue growing after 2050, although at a steadily decreasing rate, to peak at 10.4 billion in 2086, and then to start a slow decline to about 10.3 billion in 2100 with a growth rate at that time of -0.1%.[6]
This projected growth of population, like all others, depends on assumptions about vital rates. For example, the chart below shows that the UN Population Division assumes that Total fertility rate (TFR), which has been steadily declining since 1963, will continue to decline, at varying paces depending on circumstances in individual regions, to a below-replacement level of 1.8 by 2100. Between now (2020) and 2100, regions with TFR currently below this rate, for example Europe, will see TFR rise. Regions with TFR above this rate will see TFR continue to decline.[23][22]

Other projections
Other organizations have published different forecasts.
- A 2020 study published by The Lancet from researchers funded by the Global Burden of Disease Study promotes a lower growth scenario, projecting that world population will peak in 2064 at 9.7 billion and then decline to 8.8 billion in 2100. This projection assumes further advancement of women's rights globally. In this case TFR is assumed to decline more rapidly than the UN's projection, to reach 1.7 in 2100.[28]
- An analysis from the Wittgenstein Center predicts global population to peak in 2070 at 9.4 billion and then decline to 9.0 billion in 2100.[29]
- The Institute for Health Metrics and Evaluation (IHME) and the Insurance Institute of South Africa (IIASA) project lower fertility in Sub-Saharan Africa (SSA) in 2100 than the UN. By 2100, the UN projects the population in SSA will reach 3.8 billion, IHME projects 3.1 billion, and IIASA projects 2.6 billion. IHME and IIASA incorporate women's educational attainment in their models of fertility, and in the case of IHME, also consider met need for family planning.[10]
Other assumptions can produce other results. Some of the authors of the 2004 UN report assumed that life expectancy would rise slowly and continuously. The projections in the report assume this with no upper limit, though at a slowing pace depending on circumstances in individual countries. By 2100, the report assumed life expectancy to be from 66 to 97 years, and by 2300 from 87 to 106 years, depending on the country. Based on that assumption, they expect that rising life expectancy will produce small but continuing population growth by the end of the projections, ranging from 0.03 to 0.07 percent annually. The hypothetical feasibility (and wide availability) of life extension by technological means would further contribute to long term (beyond 2100) population growth.[30][31][32]
Evolutionary biology also suggests the demographic transition may reverse itself and global population may continue to grow in the long term.[33] In addition, recent evidence suggests birth rates may be rising in the 21st century in the developed world.[34] Some researchers, such as Jane N. O'Sullivan, contend that many recent population projections have underestimated population growth. She notes that in the last decades, "support for family planning has waned, and global fertility decline has decelerated as a result."[35]
Growth regions
The table below shows that from 2020 to 2050 and beyond to 2100, the bulk of the world's population growth is projected to take place in Africa. Of the additional 1.9 billion people projected between 2020 and 2050, 1.2 billion will be added in Africa, 0.7 billion in Asia and zero in the rest of the world. Africa's share of global population is projected to grow from 17% in 2020 to 25% in 2050 and 38% by 2100, while the share of Asia will fall from 60% in 2020 to 55% in 2050 and 45% in 2100.[5][6] The strong growth of the African population will happen regardless of the rate of decrease of fertility, because of the high proportion of young people already living today, who are in, or approaching, their fertile years. For example, the UN projects that the population of Nigeria will surpass that of the United States by about 2050.[6]
| Region | 2020 | 2050 | Change 2020–50 (bn) |
2100 | Change
2020–2100 (bn) | |||
|---|---|---|---|---|---|---|---|---|
| bn | % of Total |
bn | % of Total |
bn | % of Total | |||
| Africa | 1.3 | 17 | 2.5 | 25 | +1.2 | 3.9 | 38 | +2.6 |
| Asia | 4.6 | 60 | 5.3 | 55 | +0.7 | 4.7 | 45 | +0.1 |
| Other | 1.9 | 23 | 1.9 | 20 | 0.0 | 1.8 | 17 | -0.1 |
| More Developed | 1.3 | 17 | 1.3 | 13 | 0.0 | 1.2 | 12 | -0.1 |
| Less Developed | 6.5 | 83 | 8.4 | 87 | +1.9 | 9.2 | 88 | +2.7 |
| World | 7.8 | 100 | 9.7 | 100 | +1.9 | 10.4 | 100 | +2.6 |
The population of the More Developed regions is slated to remain mostly unchanged, at 1.2-1.3 billion for the remainder of the 21st century. All population growth comes from the Less Developed regions.[5][6]
The table below breaks out the UN's future population growth predictions by region[5][6]
| Region | 2020–25
(%/yr) |
2045–50
(%/yr) |
2095–2100
(%/yr) |
|---|---|---|---|
| Africa | 2.5 | 1.7 | 0.4 |
| Asia | 0.7 | 0.2 | −0.4 |
| Europe | -0.1 | −0.3 | −0.3 |
| Latin America & the Caribbean | 0.7 | 0.2 | −0.5 |
| Northern America | 0.5 | 0.2 | 0.1 |
| Oceania | 1.2 | 0.7 | 0.2 |
| World | 0.9 | 0.5 | -0.1 |
The UN projects that between 2020 and 2100 there will be declines in population growth in all six regions, that by 2100 three of them will be undergoing population decline, and the world will have entered a period of global population decline.
Most populous nations by 2050 and 2100
The UN Population Division has calculated the future population of the world's countries, based on current demographic trends. In 2022, world population reached 8 billion. The UN's 2022 report projects world population to be 9.7 billion people in 2050, and about 10.3 billion by 2100. The following table shows the largest 14 countries by population as of 2020, 2050 and 2100 to show how the rankings will change between now and the end of this century.[5][6]
| Country | Population (millions) | Rank | ||||
|---|---|---|---|---|---|---|
| 2020 | 2050 | 2100 | 2020 | 2050 | 2100 | |
| China | 1,424 | 1,317 | 771 | 1 | 2 | 2 |
| India | 1,390 | 1,668 | 1,533 | 2 | 1 | 1 |
| United States | 336 | 375 | 394 | 3 | 3 | 6 |
| Indonesia | 271 | 317 | 297 | 4 | 6 | 8 |
| Pakistan | 225 | 366 | 487 | 5 | 5 | 4 |
| Brazil | 212 | 231 | 185 | 6 | 7 | 11 |
| Nigeria | 206 | 375 | 546 | 7 | 4 | 3 |
| Bangladesh | 166 | 204 | 177 | 8 | 10 | 13 |
| Russian Federation | 146 | 133 | 112 | 9 | 14 | 20 |
| Mexico | 126 | 144 | 116 | 10 | 13 | 18 |
| Japan | 126 | 104 | 74 | 11 | 17 | 33 |
| Ethiopia | 115 | 213 | 323 | 12 | 9 | 7 |
| Philippines | 111 | 157 | 180 | 13 | 12 | 12 |
| Egypt | 106 | 160 | 205 | 14 | 12 | 10 |
| Democratic Republic of the Congo | 91 | 215 | 431 | 16 | 8 | 5 |
| Tanzania | 61 | 129 | 244 | 24 | 15 | 9 |
| Niger | 24 | 66 | 166 | 56 | 24 | 14 |
| World | 7,805 | 9,687 | 10,355 | |||
From 2020 to 2050, the eight highlighted countries are expected to account for about half of the world's projected population increase: India, Nigeria, the Democratic Republic of the Congo, Pakistan, Ethiopia, Tanzania, Egypt, and Indonesia.[5][6]
Population projections of the largest metropolitan areas
Large urban areas are hubs of economic development and innovation, with larger cities underpinning regional economies and local and global sustainability initiatives. Currently, 757 million humans live in the 101 largest cities;[36] these cities are home to 11% of the world's population.[36] By the end of the century, the world population is projected to grow, with estimates ranging from 6.9 billion to 13.1 billion;[36] the percentage of people living in the 101 largest cities is estimated to be 15% to 23%.[36]
The following 101 metropolitan areas with the largest population projections for the years 2025, 2050, 2075, and 2100, according to professors Daniel Hoornweg and Kevin Pope, are listed below.[36]
See also
References
- "Population Projections". United States Census Bureau.
- Kaneda, Toshiko (June 2014). "Understanding Population Projections: Assumptions Behind the Numbers" (PDF). Population Reference Bureau.
- Roser, Max (2013-05-09). "Future Population Growth". Our World in Data.
- Roser, Max; Ritchie, Hannah (March 18, 2023). "Two centuries of rapid global population growth will come to an end". Our World in Data.
- "World Population Prospects 2022, Standard Projections, Compact File, Estimates tab, Total Population as of 1 January (thousands) column". United Nations Department of Economic and Social Affairs, Population Division. 2022.
- "World Population Prospects 2022, Standard Projections, Compact File, Variant tab, Total Population as of 1 January (thousands) column". United Nations Department of Economic and Social Affairs, Population Division. 2022.
- Vollset, Stein Emil; Goren, Emily; Yuan, Chun-Wei; Cao, Jackie; Smith, Amanda E.; Hsiao, Thomas; Bisignano, Catherine; Azhar, Gulrez S.; Castro, Emma; Chalek, Julian; Dolgert, Andrew J. (2020-10-17). "Fertility, mortality, migration, and population scenarios for 195 countries and territories from 2017 to 2100: a forecasting analysis for the Global Burden of Disease Study". The Lancet. 396 (10258): 1285–1306. doi:10.1016/S0140-6736(20)30677-2. ISSN 0140-6736. PMC 7561721. PMID 32679112.
- "Population". United Nations. Retrieved 1 May 2023.
- Cilluffo, Anthony; Ruiz, Neil (June 17, 2019). "World's Population is Projected to Nearly Stop Growing by the end of the Century". Pew Research Center.
- Kaneda, Toshiko; Falk, Marissa; Patierno, Kaitlyn (March 27, 2021). "Understanding and Comparing Population Projections in Sub-Saharan Africa". Population Reference Bureau.
- "World Population Prospects 2022 , Graphs / Profiles". United Nations Department of Economic and Social Affairs, Population Division. 2022.
- Walter Grieling: Wie werden wir leben? ("How are we going to live?") Econ publishers, Munich 1954
- Ciro Pabón y Ciro Pabón, Manual de Urbanismo, Editorial Leyer, Bogotá, 2007, ISBN 978-958-711-296-2
- United Nations Department of Economic and Social Affairs. World Population to 2300. 2004. Executive Summary, p. 1.
- Randers, Jørgen (2012). 2052: A Global Forecast for the Next Forty Years. Vermont: Chelsea Green Publishing. p. 62.
- "World Population Prospects, Standard Projections, Archive, 2012 Revision, Total Population Both Sexes file". United Nations Department of Economic and Social Affairs, Population Division. 2012.
- "World Population Prospects, the 2012 Revision". The United Nations Department of Social and Economic Affairs. 17 June 2013.
- Gerland, P.; Raftery, A. E.; Ev Ikova, H.; Li, N.; Gu, D.; Spoorenberg, T.; Alkema, L.; Fosdick, B. K.; Chunn, J.; Lalic, N.; Bay, G.; Buettner, T.; Heilig, G. K.; Wilmoth, J. (September 14, 2014). "World population stabilization unlikely this century". Science. AAAS. 346 (6206): 234–7. Bibcode:2014Sci...346..234G. doi:10.1126/science.1257469. ISSN 1095-9203. PMC 4230924. PMID 25301627.
- "World Population Prospects 2017, Archive, File: 2017 Revision". United Nations Population Division. 2017. Retrieved 2017-11-29.
- "World Population Prospects 2022" (PDF). United Nations. 2022.
- "The world's peak population may be smaller than expected". The Economist. April 5, 2023.
- "World Population Prospects 2022, Standard Projections, Compact File, Variant tab, Total Fertility Rate column". United Nations Department of Economic and Social Affairs, Population Division. 2022.
- "World Population Prospects 2022, Standard Projections, Compact File, Estimates tab, Total Fertility Rate column". United Nations Department of Economic and Social Affairs, Population Division. 2022.
- "World Population Prospects 2022, Standard Projections, Compact File, Estimates tab, Life Expectancy at Birth, both sexes (years) column". United Nations Department of Economic and Social Affairs, Population Division. 2022.
- "World Population Prospects 2022, Standard Projections, Compact File, Variant tab, Life Expectancy at Birth, both sexes (years) column". United Nations Department of Economic and Social Affairs, Population Division. 2022.
- "World Bank Migration and Remittances Factbook 2016" (PDF). World Bank Open Knowledge Archive. 2016.
- "Growing at a slower pace, world population is expected to reach 9.7 billion in 2050 and could peak at nearly 11 billion around 2100". United Nations Department of Economic and Social Affairs. June 17, 2019.
- Vollset, Stein Emil; Goren, Emily; Yuan, Chun-Wei (July 14, 2020). "Fertility, mortality, migration, and population scenarios for 195 countries and territories from 2017 to 2100: a forecasting analysis for the Global Burden of Disease Study". The Lancet.
- "Projected world population by level of education". Our World In Data. 2016.
- Newmark, PA; Sánchez Alvarado, A (2002). "Not your father's planarian: a classic model enters the era of functional genomics". Nat Rev Genet. 3 (3): 210–219. doi:10.1038/nrg759. PMID 11972158. S2CID 28379017.
- Bavestrello, Giorgio; Sommer, Christian; Sarà, Michele (1992). "Bi-directional conversion in Turritopsis nutricula (Hydrozoa)". Scientia Marina. 56 (2–3): 137–140.
- Martínez, DE (1998). "Mortality patterns suggest lack of senescence in hydra". Exp Gerontol. 33 (3): 217–225. doi:10.1016/S0531-5565(97)00113-7. PMID 9615920. S2CID 2009972. In an essay within the 2004 U.N. report, Tim Dyson said: "A rapid increase in life expectancy, which would raise the population pyramids, seems within reach, since it responds to an old and powerful demand for longevity."
- Jason Collins (January 2019). "The heritability of fertility makes world population stabilization unlikely in the foreseeable future". Evolution and Human Behavior. 40 (1): 105–111. doi:10.1016/j.evolhumbehav.2018.09.001. S2CID 149854505.
- Can we be sure the world's population will stop rising?, BBC News, 13 October 2012
- O'Sullivan, Jane Nancy (2023). "Demographic Delusions: World Population Growth Is Exceeding Most Projections and Jeopardising Scenarios for Sustainable Futures". World. 4 (3): 545–568. doi:10.3390/world4030034.
- Hoornweg, Daniel; Pope, Kevin (September 24, 2016). "Population predictions for the world's largest cities in the 21st century". Environment and Urbanization. 29 (1): 195–216. doi:10.1177/0956247816663557. ISSN 0956-2478. S2CID 157602234.