Gamay, Northern Samar
Gamay, officially the Municipality of Gamay (Waray: Bungto san Gamay; Tagalog: Bayan ng Gamay), is a 4th class municipality in the province of Northern Samar, Philippines. According to the 2020 census, it has a population of 23,367 people.[3]
Gamay | |
|---|---|
| Municipality of Gamay | |
 Flag  Seal | |
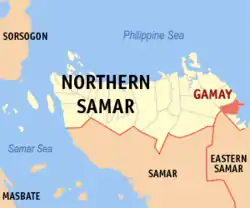 Map of Northern Samar with Gamay highlighted | |
OpenStreetMap | |
.svg.png.webp) Gamay Location within the Philippines | |
| Coordinates: 12°23′N 125°18′E | |
| Country | Philippines |
| Region | Eastern Visayas |
| Province | Northern Samar |
| District | 2nd district |
| Barangays | 26 (see Barangays) |
| Government | |
| • Type | Sangguniang Bayan |
| • Mayor | Timoteo T. Capoquian Jr. |
| • Vice Mayor | Clarita P. Gomba |
| • Representative | Jose L. Ong Jr. |
| • Councilors | List |
| • Electorate | 17,743 voters (2022) |
| Area | |
| • Total | 115.10 km2 (44.44 sq mi) |
| Elevation | 18 m (59 ft) |
| Highest elevation | 172 m (564 ft) |
| Lowest elevation | 0 m (0 ft) |
| Population (2020 census)[3] | |
| • Total | 23,367 |
| • Density | 200/km2 (530/sq mi) |
| • Households | 5,696 |
| Economy | |
| • Income class | 4th municipal income class |
| • Poverty incidence | 33.45 |
| • Revenue | ₱ 119.9 million (2020) |
| • Assets | ₱ 489.2 million (2020) |
| • Expenditure | ₱ 99.37 million (2020) |
| • Liabilities | ₱ 120 million (2020) |
| Service provider | |
| • Electricity | Northern Samar Electric Cooperative (NORSAMELCO) |
| Time zone | UTC+8 (PST) |
| ZIP code | 6422 |
| PSGC | |
| IDD : area code | +63 (0)55 |
| Native languages | Waray Tagalog |
In the east, it is bounded by the Pacific Ocean, in the south by Lapinig, in the north-west by Mapanas and Catubig.
Geography
Barangays
Gamay is politically subdivided into 26 barangays. Each barangay consists of puroks and some have sitios.
- Anito
- Bangon
- Bato
- Baybay (Poblacion)
- Bonifacio
- Burabod (Poblacion)
- Cabarasan
- Cadac-an (Calingnan)
- Cade-an
- Cagamutan del Norte
- Cagamutan del Sur
- Central (Poblacion)
- Dao
- G. M. Osias
- Guibuangan
- Henogawe
- Libertad (Poblacion)
- Lonoy
- Luneta
- Malidong
- Occidental I (Poblacion)
- Occidental II (Poblacion)
- Oriental I (Poblacion)
- Oriental II (Poblacion)
- Rizal
- San Antonio
Climate
| Climate data for Gamay, Northern Samar | |||||||||||||
|---|---|---|---|---|---|---|---|---|---|---|---|---|---|
| Month | Jan | Feb | Mar | Apr | May | Jun | Jul | Aug | Sep | Oct | Nov | Dec | Year |
| Average high °C (°F) | 27 (81) |
27 (81) |
28 (82) |
29 (84) |
30 (86) |
30 (86) |
30 (86) |
30 (86) |
29 (84) |
29 (84) |
28 (82) |
27 (81) |
29 (84) |
| Average low °C (°F) | 23 (73) |
22 (72) |
22 (72) |
23 (73) |
24 (75) |
24 (75) |
24 (75) |
24 (75) |
24 (75) |
24 (75) |
24 (75) |
23 (73) |
23 (74) |
| Average precipitation mm (inches) | 105 (4.1) |
67 (2.6) |
65 (2.6) |
53 (2.1) |
86 (3.4) |
129 (5.1) |
135 (5.3) |
113 (4.4) |
131 (5.2) |
163 (6.4) |
167 (6.6) |
162 (6.4) |
1,376 (54.2) |
| Average rainy days | 17.6 | 13.2 | 15.5 | 14.9 | 19.6 | 24.3 | 26.6 | 25.4 | 24.9 | 25.4 | 22.9 | 20.9 | 251.2 |
| Source: Meteoblue[5] | |||||||||||||
Demographics
| Year | Pop. | ±% p.a. |
|---|---|---|
| 1948 | 14,962 | — |
| 1960 | 12,156 | −1.72% |
| 1970 | 12,297 | +0.12% |
| 1975 | 15,370 | +4.58% |
| 1980 | 17,247 | +2.33% |
| 1990 | 15,764 | −0.90% |
| 1995 | 19,457 | +4.02% |
| 2000 | 21,314 | +1.97% |
| 2007 | 21,537 | +0.14% |
| 2010 | 22,425 | +1.48% |
| 2015 | 23,511 | +0.90% |
| 2020 | 23,367 | −0.12% |
| Source: Philippine Statistics Authority[6][7][8][9] | ||
Economy
References
- Municipality of Gamay | (DILG)
- "2015 Census of Population, Report No. 3 – Population, Land Area, and Population Density" (PDF). Philippine Statistics Authority. Quezon City, Philippines. August 2016. ISSN 0117-1453. Archived (PDF) from the original on May 25, 2021. Retrieved July 16, 2021.
- Census of Population (2020). "Region VIII (Eastern Visayas)". Total Population by Province, City, Municipality and Barangay. Philippine Statistics Authority. Retrieved 8 July 2021.
- "PSA Releases the 2018 Municipal and City Level Poverty Estimates". Philippine Statistics Authority. 15 December 2021. Retrieved 22 January 2022.
- "Gamay, Northern Samar : Average Temperatures and Rainfall". Meteoblue. Retrieved 6 January 2019.
- Census of Population (2015). "Region VIII (Eastern Visayas)". Total Population by Province, City, Municipality and Barangay. Philippine Statistics Authority. Retrieved 20 June 2016.
- Census of Population and Housing (2010). "Region VIII (Eastern Visayas)" (PDF). Total Population by Province, City, Municipality and Barangay. National Statistics Office. Retrieved 29 June 2016.
- Censuses of Population (1903–2007). "Region VIII (Eastern Visayas)". Table 1. Population Enumerated in Various Censuses by Province/Highly Urbanized City: 1903 to 2007. National Statistics Office.
- "Province of Northern Samar". Municipality Population Data. Local Water Utilities Administration Research Division. Retrieved 17 December 2016.
- "Poverty incidence (PI):". Philippine Statistics Authority. Retrieved December 28, 2020.
- "Estimation of Local Poverty in the Philippines" (PDF). Philippine Statistics Authority. 29 November 2005.
- "2003 City and Municipal Level Poverty Estimates" (PDF). Philippine Statistics Authority. 23 March 2009.
- "City and Municipal Level Poverty Estimates; 2006 and 2009" (PDF). Philippine Statistics Authority. 3 August 2012.
- "2012 Municipal and City Level Poverty Estimates" (PDF). Philippine Statistics Authority. 31 May 2016.
- "Municipal and City Level Small Area Poverty Estimates; 2009, 2012 and 2015". Philippine Statistics Authority. 10 July 2019.
- "PSA Releases the 2018 Municipal and City Level Poverty Estimates". Philippine Statistics Authority. 15 December 2021. Retrieved 22 January 2022.
External links
- Philippine Standard Geographic Code
- Philippine Census Information
- Local Governance Performance Management System Archived 2016-03-04 at the Wayback Machine
Places adjacent to Gamay, Northern Samar | |
|---|---|
Catarman (capital and largest municipality) | |
| Municipalities | |
This article is issued from Wikipedia. The text is licensed under Creative Commons - Attribution - Sharealike. Additional terms may apply for the media files.