Hanging man (candlestick pattern)
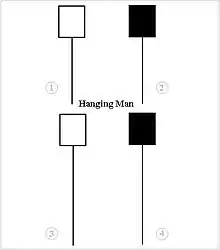
A hanging man is a type of candlestick pattern in financial technical analysis. It is a bearish reversal pattern made up of just one candle. It has a long lower wick and a short body at the top of the candlestick with little or no upper wick. In order for a candle to be a valid hanging man most traders say the lower wick must be two times greater than the size of the body portion of the candle, and the body of the candle must be at the upper end of the trading range.

Long Lower Shadow: The candle has a long lower shadow, which represents the intraday low that was tested during the session.
Small Real Body: The real body, i.e., the difference between the open and close prices, is relatively small compared to the entire candlestick's range.
No Upper Shadow: The candle has little to no upper shadow, indicating a lack of significant price movement to the upside.
It is important for traders to consider the context in which the Hanging Man pattern appears when interpreting it. Keep these points in mind
- Location: The pattern is more relevant when it occurs after a sustained uptrend, indicating potential exhaustion in buying pressure.
- Volume: Volume plays a crucial role in validating the pattern's significance. Higher volume during the candlestick formation adds weight to the bearish signal.
Here are a few trading strategies that involve the Hanging Man
- Bearish Reversal Signal : The Hanging Man pattern serves as a bearish reversal signal. Traders can initiate short positions or liquidate long positions when this pattern appears in a relevant context and is confirmed by subsequent price action.
- Stop Loss Placement :- For traders who already hold long positions, spotting an Hanging Man can serve as a signal to place a tight stop loss just above the candlestick's high. This helps protect gains in case of a sudden trend reversal.
While the Hanging Man pattern can be a valuable tool in a trader's arsenal, it is not without its limitations. Like any technical indicator, it is not foolproof and may generate false signals from time to time. Therefore, it is crucial to use this pattern in conjunction with other indicators and perform thorough analysis before making trading decisions. [1]
See also
- Hammer — Hanging man pattern found in a downtrend
References
- "Trading Strategies Utilizing the Hanging Man Pattern". Prathamesh Tawde. 2023-07-27. Retrieved 2023-07-27.
External links
- Video and chart examples of hanging man pattern
- Hanging man pattern at onlinetradingconcepts.com
- Hanging man definition at investopedia.com
- Hanging Man Information at candlecharts.com