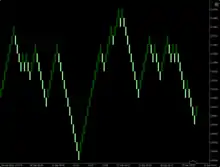
Renko chart
A Renko chart[1] (Japanese: 練行足, romanized: renkōashi, also written 練り足 neriashi) is a type of financial chart of Japanese origin used in technical analysis that measures and plots price changes. A renko chart consists of bricks (煉瓦, renga), which proponents say more clearly show market trends and increase the signal-to-noise ratio compared to typical candlestick charts.[2]

Renko chart example in Forex market for EUR/USD pair
Construction
Renko charting is similar to point-and-figure in that time doesn't play a role in Renko charts. Renko blocks (or bricks) are plotted using the following rules:[3][4]
- A brick size is determined, e.g. 10 points. All bricks are drawn to be of that size.
- Once the price surpasses the lower or upper border of the current brick by the brick size, a new brick is drawn either above or below the previous one — never on the same line.
- The new brick is always drawn farther to the right on the horizontal axis.
- If the price surpasses the previous brick by more than one chosen size, the respective number of bricks is plotted on the chart.
- Partial bricks are not plotted until complete brick size distance is covered by the price.
Similarly to Kagi charts, Renko charts help chartists to cancel out the noise present on time-based charts, focus on important price levels, detect support and resistance, and identify market trends.[5]
References
- Nison, Steve (1994-11-10). Beyond Candlesticks: New Japanese Charting Techniques Revealed. John Wiley & Sons. ISBN 9780471007203.
- Mitchell, Cory. "Renko Chart Definition and Uses". Investopedia. Retrieved 2019-09-23.
- Mitchell, Cory. "How to Use Renko Charts in Your Trading". The Balance. Retrieved 2019-09-23.
- "Exotic Types of Charts in Forex". www.earnforex.com. Retrieved 2019-09-23.
- "Renko Charts [ChartSchool]". school.stockcharts.com. Retrieved 2019-09-23.
This article is issued from Wikipedia. The text is licensed under Creative Commons - Attribution - Sharealike. Additional terms may apply for the media files.