Jeanne-Mance–Viger
Jeanne-Mance–Viger is a provincial electoral district in the Montreal region of Quebec, Canada that elects members to the National Assembly of Quebec. It corresponds exactly to the territory of the Saint-Léonard borough of the city of Montreal. The current MNA is Filomenna Rotiroti who was first elected in 2008.
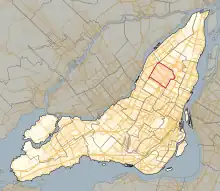 Location in Montreal | |||
| Provincial electoral district | |||
| Legislature | National Assembly of Quebec | ||
| MNA |
Liberal | ||
| District created | 2001 | ||
| First contested | 2003 | ||
| Last contested | 2022 | ||
| Demographics | |||
| Electors (2021)[1] | 49,517 | ||
| Area (km²)[2] | 13.5 | ||
| Census division(s) | Montreal (part) | ||
| Census subdivision(s) | Montreal (part) | ||
It was created for the 2003 election from Jeanne-Mance and part of Viger and has remained a Liberal stronghold ever since. It is the safest Liberal electoral district in Montreal's east end.
In the change from the 2001 to the 2011 electoral map, its territory was unchanged. It borders the electoral districts of Viau to west, Anjou-Louis Riel to the east and southeast, Rosemont to the southwest, and Bourassa-Sauve to the north.
It was named for Jeanne Mance and jointly for Denis-Benjamin Viger and Jacques Viger (1787–1858).[3]
Members of the National Assembly
| Legislature | Years | Member | Party | |
|---|---|---|---|---|
| Riding created from Jeanne-Mance and Viger | ||||
| 37th | 2003–2007 | Michel Bissonnet | Liberal | |
| 38th | 2007–2008 | |||
| 39th | 2008–2012 | Filomena Rotiroti | ||
| 40th | 2012–2014 | |||
| 41st | 2014–2018 | |||
| 42nd | 2018–2022 | |||
| 43rd | 2022–Present | |||
Election results
| 2022 Quebec general election | ||||||||
|---|---|---|---|---|---|---|---|---|
| Party | Candidate | Votes | % | ±% | ||||
| Liberal | Filomena Rotiroti | 14,471 | 53.93 | -12.39 | ||||
| Coalition Avenir Québec | Julie De Martino | 4,455 | 16.60 | +0.52 | ||||
| Conservative | Chakib Saad | 3,113 | 11.60 | +10.18 | ||||
| Québec solidaire | Marie-Josée Forget | 2,858 | 10.65 | +2.50 | ||||
| Parti Québécois | Laurence Massey | 1,122 | 4.18 | -1.37 | ||||
| Canadian | Giovanni Manfredi | 496 | 1.85 | +1.85 | ||||
| Green | Alessandra Szilagyi | 319 | 1.19 | -0.89 | ||||
| Total valid votes | 26,834 | 98.19 | ||||||
| Total rejected ballots | 495 | 1.81 | -0.11 | |||||
| Turnout | 27,329 | 55.01 | -0.26 | |||||
| Electors on the lists | 49,683 | |||||||
| Liberal hold | Swing | – | ||||||
| Source:[4] | ||||||||
| 2018 Quebec general election | ||||||||
|---|---|---|---|---|---|---|---|---|
| Party | Candidate | Votes | % | ±% | ||||
| Liberal | Filomena Rotiroti | 18,215 | 66.32 | -12.21 | ||||
| Coalition Avenir Québec | Sarah Petrari | 4,445 | 16.18 | +7.98 | ||||
| Québec solidaire | Ismaël Seck | 2,237 | 8.15 | +4.79 | ||||
| Parti Québécois | Marie-Josée Bruneau | 1,523 | 5.55 | -3.05 | ||||
| Green | Sylvie Hétu | 570 | 2.08 | +0.98 | ||||
| Conservative | Sylvain Dallaire | 391 | 1.42 | |||||
| Marxist–Leninist | Garnet Colly | 83 | 0.3 | +0.09 | ||||
| Total valid votes | 27,464 | 98.08 | ||||||
| Total rejected ballots | 538 | 1.92 | ||||||
| Turnout | 28,002 | 55.27 | ||||||
| Eligible voters | 50,660 | |||||||
| Liberal hold | Swing | -10.095 | ||||||
| 2014 Quebec general election | ||||||||
|---|---|---|---|---|---|---|---|---|
| Party | Candidate | Votes | % | ±% | ||||
| Liberal | Filomena Rotiroti | 27,007 | 78.53 | +13.14 | ||||
| Parti Québécois | Joanie Harnois | 2,956 | 8.60 | -4.83 | ||||
| Coalition Avenir Québec | Mario Parent | 2,820 | 8.20 | -6.32 | ||||
| Québec solidaire | Stéphanie Charpentier | 1,154 | 3.36 | -1.70 | ||||
| Green | Melissa Miscione | 379 | 1.10 | – | ||||
| Marxist–Leninist | Garnet Colly | 73 | 0.21 | -0.12 | ||||
| Total valid votes | 34,389 | 98.97 | – | |||||
| Total rejected ballots | 394 | 1.13 | – | |||||
| Turnout | 34,783 | 71 | +3.59 | |||||
| Electors on the lists | 48,925 | – | – | |||||
| Liberal hold | Swing | – | ||||||
| Source:[5] | ||||||||
| 2012 Quebec general election | ||||||||
|---|---|---|---|---|---|---|---|---|
| Party | Candidate | Votes | % | ±% | ||||
| Liberal | Filomena Rotiroti | 20,912 | 65.39 | -7.66 | ||||
| Coalition Avenir Québec | Jean-François Gagné | 4,643 | 14.52 | +6.85 | ||||
| Parti Québécois | Nicolas Bonami | 4,295 | 13.43 | -1.59 | ||||
| Québec solidaire | Marie-Chantal Locas | 1,618 | 5.06 | +2.60 | ||||
| Option nationale | Julie Surprenant | 410 | 1.28 | – | ||||
| Marxist–Leninist | Garnet Colly | 104 | 0.33 | -0.23 | ||||
| Total valid votes | 31,982 | 98.71 | – | |||||
| Total rejected ballots | 419 | 1.29 | – | |||||
| Turnout | 32,401 | 67.41 | ||||||
| Electors on the lists | 48,069 | – | – | |||||
^ Change is from redistributed results. CAQ change is from ADQ.
| Party | Candidate | Votes | % | ±% | |
|---|---|---|---|---|---|
| Liberal | Filomena Rotiroti | 16433 | 73.05 | ||
| Parti Québécois | Christine Normandin | 3379 | 15.02 | ||
| Action démocratique | Luigi Verrelli | 1726 | 7.67 | ||
| Québec solidaire | Celine Gingras | 554 | 2.46 | ||
| } | Independent | Katia Proulx | 281 | 1.25 | |
| People's Front | Garnet Colly | 124 | 0.55 | ||
| Total valid votes | 22,497 | 98.57 | |||
| Total rejected ballots | 326 | 1.43 | |||
| Turnout | 22,823 | 46.95 | |||
| Electors on the lists | 48,609 | ||||
| Party | Candidate | Votes | % | ±% | |
|---|---|---|---|---|---|
| Liberal | Michel Bissonnet | 20716 | 68.00 | -11.89 | |
| Action démocratique | Carole Giroux | 4565 | 14.98 | +8.78 | |
| Parti Québécois | Kamal El Batal | 3659 | 12.01 | -0.82 | |
| Green | Hamadou Abdel Kader Nikiema | 790 | 2.59 | – | |
| Québec solidaire | Ramon Villaruel | 635 | 2.08 | ||
| People's Front | Stéphane Chénier | 101 | 0.33 | ||
| Total valid votes | 30,466 | 98.87 | |||
| Total rejected ballots | 349 | 1.13 | |||
| Turnout | 30,815 | 63.26 | |||
| Electors on the lists | 48,710 | ||||
| Party | Candidate | Votes | % | ±% | |
|---|---|---|---|---|---|
| Liberal | Michel Bissonnet | 26801 | 79.89 | ||
| Parti Québécois | Robert La Rose | 4303 | 12.83 | ||
| Action démocratique | Carole Giroux | 2080 | 6.20 | ||
| Bloc Pot | Eddy Guarino | 365 | 1.09 | ||
References
- http://www.electionsquebec.qc.ca/english/provincial/electoral-map/general-information-on-the-provincial-electoral-divisions-2011.php?bsq=429§ion=population
- http://www.electionsquebec.qc.ca/english/provincial/electoral-map/general-information-on-the-provincial-electoral-divisions-2011.php?bsq=429§ion=superficie
- "Circonscription électorale de Jeanne-Mance–Viger". Commission de toponymie du Québec (in French). September 2015. Retrieved 2016-01-06.
- "Results and statistics".
- "Results and statistics".
External links
- Information
- Election results
- Election results (National Assembly)
- Maps
- 2011 map (PDF)
- 2001 map (Flash)
- 2001–2011 changes (Flash)
- 1992–2001 changes to Jeanne-Mance (Flash)
- 1992–2001 changes to Viger (Flash)
- Electoral map of Montréal region
- Quebec electoral map, 2011
Neighbouring electoral districts | ||||||||||||||||
|---|---|---|---|---|---|---|---|---|---|---|---|---|---|---|---|---|
| ||||||||||||||||