Marguerite-Bourgeoys
Marguerite-Bourgeoys is a provincial electoral district in the Montreal region of Quebec, Canada that elects members to the National Assembly of Quebec. It comprises the LaSalle borough of the city of Montreal.
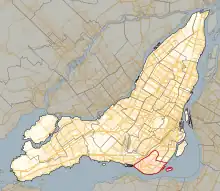 Location in Montreal | |||
| Provincial electoral district | |||
| Legislature | National Assembly of Quebec | ||
| MNA |
Liberal | ||
| District created | 1965 | ||
| First contested | 1966 | ||
| Last contested | 2022 | ||
| Demographics | |||
| Population (2016)[1] | 76,860 | ||
| Electors (2018)[1] | 53,442 | ||
| Area (km²)[2] | 25.1 | ||
| Pop. density (per km²) | 3,062.2 | ||
| Census division(s) | Montreal (part) | ||
| Census subdivision(s) | Montreal (part) | ||
It was created for the 1966 election from parts of Jacques-Cartier and Montréal–Notre-Dame-de-Grâce electoral districts.
In the change from the 2001 to the 2011 electoral map, it gained some territory from Marquette electoral district.
It was named after Saint Marguerite Bourgeoys.
Members of the Legislative Assembly / National Assembly
| Legislature | Years | Member | Party | |
|---|---|---|---|---|
| Riding created from Jacques-Cartier and Montréal–Notre-Dame-de-Grâce |
||||
| 28th | 1966–1970 | Marie-Claire Kirkland | Liberal | |
| 29th | 1970–1973 | |||
| 30th | 1973–1976 | Fernand Lalonde | ||
| 31st | 1976–1981 | |||
| 32nd | 1981–1984 | |||
| 1984–1985 | Gilles Fortin | |||
| 33rd | 1985–1989 | |||
| 34th | 1989–1994 | Liza Frulla-Hébert | ||
| 35th | 1994–1998 | |||
| 36th | 1998–2003 | Monique Jérôme-Forget | ||
| 37th | 2003–2007 | |||
| 38th | 2007–2008 | |||
| 39th | 2008–2009 | |||
| 2009–2012 | Clément Gignac | |||
| 40th | 2012–2014 | Robert Poëti | ||
| 41st | 2014–2018 | |||
| 42nd | 2018–2022 | Hélène David | ||
| 43rd | 2022–Present | Fred Beauchemin | ||
Election results
| 2022 Quebec general election | ||||||||
|---|---|---|---|---|---|---|---|---|
| Party | Candidate | Votes | % | ±% | ||||
| Liberal | Fred Beauchemin | 12,635 | 44.78 | -8.61 | ||||
| Coalition Avenir Québec | Vicky Michaud | 6,533 | 23.15 | -0.33 | ||||
| Conservative | Aleksa Drakul | 3,103 | 11.00 | – | ||||
| Québec solidaire | Angélique Soleil Lavoie | 2,898 | 10.27 | -0.49 | ||||
| Parti Québécois | Suzanne Tremblay | 1,966 | 6.97 | -1.48 | ||||
| Bloc Montreal | Keeton Clarke | 549 | 1.95 | – | ||||
| Green | Carole Thériault | 409 | 1.45 | -0.90 | ||||
| Climat Québec | Serge Bellemare | 123 | 0.44 | – | ||||
| Total valid votes | 28,216 | 98.66 | – | |||||
| Total rejected ballots | 382 | 1.34 | – | |||||
| Turnout | 28,598 | 54.71 | -0.09 | |||||
| Electors on the lists | 52,274 | – | – | |||||
| 2018 Quebec general election | ||||||||
|---|---|---|---|---|---|---|---|---|
| Party | Candidate | Votes | % | ±% | ||||
| Liberal | Hélène David | 15,361 | 53.39 | -16.69 | ||||
| Coalition Avenir Québec | Vicky Michaud | 6,756 | 23.48 | +13.57 | ||||
| Québec solidaire | Camille St-Laurent | 3,095 | 10.76 | +6.73 | ||||
| Parti Québécois | Jeannot Desbiens | 2,430 | 8.45 | -5.41 | ||||
| Green | Smail Louardiane | 675 | 2.35 | +0.70 | ||||
| New Democratic | Nashaat Elsayed | 456 | 1.58 | – | ||||
| Total valid votes | 28,773 | 98.24 | ||||||
| Total rejected ballots | 514 | 1.76 | ||||||
| Turnout | 29,287 | 54.80 | -17.54 | |||||
| Eligible voters | 53,442 | |||||||
| Liberal hold | Swing | -15.13 | ||||||
| 2014 Quebec general election | ||||||||
|---|---|---|---|---|---|---|---|---|
| Party | Candidate | Votes | % | ±% | ||||
| Liberal | Robert Poëti | 26,251 | 70.08 | +13.17 | ||||
| Parti Québécois | Richard Leboeuf-McGregor | 5,191 | 13.86 | -5.91 | ||||
| Coalition Avenir Québec | Zoubir Bouchaala | 3,711 | 9.91 | -7.46 | ||||
| Québec solidaire | Alexandre Emond | 1,508 | 4.03 | -0.05 | ||||
| Green | Stéphanie Stevenson | 619 | 1.65 | – | ||||
| Option nationale | Myriam Drouin | 177 | 0.47 | -1.08 | ||||
| Total valid votes | 37,457 | 98.87 | – | |||||
| Total rejected ballots | 428 | 1.13 | – | |||||
| Turnout | 37,885 | 72.34 | +3.29 | |||||
| Electors on the lists | 52,371 | – | – | |||||
| Liberal hold | Swing | +9.54 | ||||||
| 2012 Quebec general election | ||||||||
|---|---|---|---|---|---|---|---|---|
| Party | Candidate | Votes | % | ±% | ||||
| Liberal | Robert Poëti | 19,993 | 56.91 | -10.74 | ||||
| Parti Québécois | Jessica Riggi | 6,944 | 19.77 | +2.63 | ||||
| Coalition Avenir Québec | Michael Delisle | 6,104 | 17.37 | +12.39 | ||||
| Québec solidaire | Yebo Romaric Okou | 1,434 | 4.08 | +1.58 | ||||
| Option nationale | Véronique Pelletier | 543 | 1.55 | – | ||||
| Marxist–Leninist | Yves Le Seigle | 113 | 0.32 | +0.22 | ||||
| Total valid votes | 35,131 | 98.81 | – | |||||
| Total rejected ballots | 423 | 1.19 | – | |||||
| Turnout | 35,554 | 69.05 | ||||||
| Electors on the lists | 51,493 | – | – | |||||
| Liberal hold | Swing | -5.05 | ||||||
^ Change is from redistributed results. CAQ change is from ADQ.
| Quebec provincial by-election, June 22, 2009 | ||||||||
|---|---|---|---|---|---|---|---|---|
| Party | Candidate | Votes | % | ±% | ||||
| Liberal | Clément Gignac | 7,753 | 72.41 | +6.22 | ||||
| Parti Québécois | Christine Normandin | 1,835 | 17.14 | -4.56 | ||||
| Action démocratique | Diane Charbonneau | 384 | 3.59 | -5.08 | ||||
| Green | Julien Leclerc | 290 | 2.71 | – | ||||
| Québec solidaire | Valérie Black St-Laurent | 265 | 2.48 | -0.96 | ||||
| Independent | Sylvie R. Tremblay | 73 | 0.68 | – | ||||
| Parti indépendantiste | Érik Poulin | 66 | 0.62 | – | ||||
| Independent | Régent Millette | 41 | 0.38 | – | ||||
| Total valid votes | 10,707 | 99.19 | – | |||||
| Total rejected ballots | 87 | 0.81 | – | |||||
| Turnout | 10,794 | 23.22 | -24.87 | |||||
| Electors on the lists | 46,478 | – | – | |||||
| 2008 Quebec general election | ||||||||
|---|---|---|---|---|---|---|---|---|
| Party | Candidate | Votes | % | ±% | ||||
| Liberal | Monique Jérôme-Forget | 14,490 | 66.19 | +9.05 | ||||
| Parti Québécois | Félix Sylvestre-Kentzinger | 4,750 | 21.70 | +5.68 | ||||
| Action démocratique | Michel Beaudoin | 1,899 | 8.67 | -10.25 | ||||
| Québec solidaire | Elena Tapia | 752 | 3.44 | +0.99 | ||||
| Total valid votes | 21,891 | 98.32 | – | |||||
| Total rejected ballots | 373 | 1.68 | – | |||||
| Turnout | 22,264 | 48.09 | -15.04 | |||||
| Electors on the lists | 46,297 | – | – | |||||
| 2007 Quebec general election | ||||||||
|---|---|---|---|---|---|---|---|---|
| Party | Candidate | Votes | % | ±% | ||||
| Liberal | Monique Jérôme-Forget | 16,752 | 57.14 | -13.30 | ||||
| Action démocratique | Martin Marquis | 5,547 | 18.92 | +11.12 | ||||
| Parti Québécois | Siou Fan Houang | 4,697 | 16.02 | -3.52 | ||||
| Green | Serge Bellemare | 1,454 | 4.96 | +3.68 | ||||
| Québec solidaire | Jocelyne Desautels | 717 | 2.45 | – | ||||
| Christian Democracy | Marc Veilleux | 97 | 0.33 | +0.04 | ||||
| Marxist–Leninist | Yves Le Seigle | 56 | 0.19 | -0.02 | ||||
| Total valid votes | 29,320 | 99.05 | – | |||||
| Total rejected ballots | 282 | 0.95 | – | |||||
| Turnout | 29,602 | 63.13 | -5.01 | |||||
| Electors on the lists | 46,887 | – | – | |||||
| 2003 Quebec general election | ||||||||
|---|---|---|---|---|---|---|---|---|
| Party | Candidate | Votes | % | ±% | ||||
| Liberal | Monique Jérôme-Forget | 22,807 | 70.44 | +2.29 | ||||
| Parti Québécois | Suzanne Groulx | 6,327 | 19.54 | -3.12 | ||||
| Action démocratique | Brigitte De Laroche | 2,524 | 7.80 | +1.16 | ||||
| Green | Adam Jastrzebski | 415 | 1.28 | – | ||||
| Equality | Paul Domagala | 142 | 0.44 | -0.78 | ||||
| Christian Democracy | Marc Veilleux | 94 | 0.29 | – | ||||
| Marxist–Leninist | Yves Le Seigle | 68 | 0.21 | – | ||||
| Total valid votes | 32,377 | 98.89 | – | |||||
| Total rejected ballots | 364 | 1.11 | – | |||||
| Turnout | 32,741 | 68.14 | -11.79 | |||||
| Electors on the lists | 48,049 | – | – | |||||
| 1998 Quebec general election | ||||||||
|---|---|---|---|---|---|---|---|---|
| Party | Candidate | Votes | % | ±% | ||||
| Liberal | Monique Jérôme-Forget | 23,234 | 68.15 | -2.19 | ||||
| Parti Québécois | Alain Therrien | 7,724 | 22.66 | -0.30 | ||||
| Action démocratique | Valérie St-Jean | 2,263 | 6.64 | +3.13 | ||||
| Equality | Giuliana Pendenza | 417 | 1.22 | -0.16 | ||||
| Natural Law | Céline Chamard | 292 | 0.86 | +0.20 | ||||
| Socialist Democracy | Robert Aillaud | 161 | 0.47 | -0.68 | ||||
| Total valid votes | 34,091 | 99.03 | – | |||||
| Total rejected ballots | 333 | 0.97 | – | |||||
| Turnout | 34,424 | 79.93 | -6.14 | |||||
| Electors on the lists | 43,070 | – | – | |||||
^ PDS change is from NPD.
| 1994 Quebec general election | ||||||||
|---|---|---|---|---|---|---|---|---|
| Party | Candidate | Votes | % | ±% | ||||
| Liberal | Liza Frulla | 24,046 | 70.34 | +20.46 | ||||
| Parti Québécois | Alain Therrien | 7,850 | 22.96 | -0.86 | ||||
| Action démocratique | Horace A. Sirois | 1,200 | 3.51 | – | ||||
| Equality | Giuliana Pendenza | 472 | 1.38 | -22.81 | ||||
| New Democratic | Claudine Ricard | 392 | 1.15 | – | ||||
| Natural Law | Ronald Bessette | 226 | 0.66 | – | ||||
| Total valid votes | 34,186 | 98.85 | – | |||||
| Total rejected ballots | 398 | 1.15 | – | |||||
| Turnout | 34,584 | 86.07 | +10.92 | |||||
| Electors on the lists | 40,182 | – | – | |||||
| 1989 Quebec general election | ||||||||
|---|---|---|---|---|---|---|---|---|
| Party | Candidate | Votes | % | ±% | ||||
| Liberal | Liza Frulla-Hébert | 12,722 | 49.88 | -23.56 | ||||
| Equality | Philip Chrysafidis | 6,171 | 24.19 | – | ||||
| Parti Québécois | Charles Duhamel | 6,075 | 23.82 | +0.74 | ||||
| Progressive Conservative | Louis Marie Lacoste | 538 | 2.11 | – | ||||
| Total valid votes | 25,506 | 96.96 | – | |||||
| Total rejected ballots | 801 | 3.04 | – | |||||
| Turnout | 26,307 | 75.15 | +1.12 | |||||
| Electors on the lists | 35,006 | – | – | |||||
| 1985 Quebec general election | ||||||||
|---|---|---|---|---|---|---|---|---|
| Party | Candidate | Votes | % | ±% | ||||
| Liberal | Gilles Fortin | 19,469 | 73.44 | -9.71 | ||||
| Parti Québécois | Maurice Maisonneuve | 6,119 | 23.08 | +7.69 | ||||
| New Democratic | John Commins | 795 | 3.00 | – | ||||
| Christian Socialist | Gilles Rivest | 128 | 0.48 | – | ||||
| Total valid votes | 26,511 | 98.32 | – | |||||
| Total rejected ballots | 453 | 1.68 | – | |||||
| Turnout | 26,964 | 74.03 | +27.25 | |||||
| Electors on the lists | 36,421 | – | – | |||||
| Quebec provincial by-election, June 18, 1984 | ||||||||
|---|---|---|---|---|---|---|---|---|
| Party | Candidate | Votes | % | ±% | ||||
| Liberal | Gilles Fortin | 13,030 | 83.15 | +15.64 | ||||
| Parti Québécois | Maurice Maisonneuve | 2,412 | 15.39 | -15.65 | ||||
| Republican | Louise Gravel | 229 | 1.46 | – | ||||
| Total valid votes | 15,671 | 98.44 | – | |||||
| Total rejected ballots | 248 | 1.56 | – | |||||
| Turnout | 15,919 | 46.78 | -35.96 | |||||
| Electors on the lists | 34,030 | – | – | |||||
| 1981 Quebec general election | ||||||||
|---|---|---|---|---|---|---|---|---|
| Party | Candidate | Votes | % | ±% | ||||
| Liberal | Fernand Lalonde | 19,511 | 67.51 | +30.86 | ||||
| Parti Québécois | Maurice Maisonneuve | 8,970 | 31.04 | -3.58 | ||||
| Union Nationale | Serge Carrier | 355 | 1.23 | -25.20 | ||||
| Marxist–Leninist | Christiane Robidoux | 64 | 0.22 | – | ||||
| Total valid votes | 28,900 | 98.88 | – | |||||
| Total rejected ballots | 328 | 1.12 | – | |||||
| Turnout | 29,228 | 82.74 | -2.17 | |||||
| Electors on the lists | 35,324 | – | – | |||||
| 1976 Quebec general election | ||||||||
|---|---|---|---|---|---|---|---|---|
| Party | Candidate | Votes | % | ±% | ||||
| Liberal | Fernand Lalonde | 14,551 | 36.65 | -29.85 | ||||
| Parti Québécois | Gérard Kentzinger | 13,745 | 34.62 | +6.32 | ||||
| Union Nationale | Domenico Izzi | 10,492 | 26.43 | +25.07 | ||||
| Ralliement créditiste | Raymond Jacques | 603 | 1.52 | -1.65 | ||||
| NDP - RMS Coalition | Thomas Rufh | 312 | 0.78 | – | ||||
| Total valid votes | 39,703 | 97.50 | – | |||||
| Total rejected ballots | 1,017 | 2.50 | – | |||||
| Turnout | 40,720 | 84.91 | +4.51 | |||||
| Electors on the lists | 47,955 | – | – | |||||
| 1973 Quebec general election | ||||||||
|---|---|---|---|---|---|---|---|---|
| Party | Candidate | Votes | % | ±% | ||||
| Liberal | Fernand Lalonde | 23,848 | 66.50 | -2.35 | ||||
| Parti Québécois | Michel Boileau | 10,148 | 28.30 | +9.33 | ||||
| Parti créditiste | Gilles Roberge | 1,137 | 3.17 | +1.13 | ||||
| Union Nationale | Alain Laroche | 488 | 1.36 | -7.24 | ||||
| Independent | J.-A. dit Gus Callaghan | 242 | 0.67 | – | ||||
| Total valid votes | 35,863 | 97.99 | – | |||||
| Total rejected ballots | 737 | 2.01 | – | |||||
| Turnout | 36,600 | 80.40 | -4.01 | |||||
| Electors on the lists | 45,524 | – | – | |||||
| 1970 Quebec general election | ||||||||
|---|---|---|---|---|---|---|---|---|
| Party | Candidate | Votes | % | ±% | ||||
| Liberal | Claire Kirkland-Casgrain | 28,694 | 68.85 | +6.71 | ||||
| Parti Québécois | Gilles Gasse | 7,907 | 18.97 | – | ||||
| Union Nationale | Normand Bourdeau | 3,584 | 8.60 | -11.22 | ||||
| Ralliement créditiste | David Haines | 850 | 2.04 | – | ||||
| New Democratic | Roland Morin | 378 | 0.91 | – | ||||
| Independent | George McLeod | 262 | 0.63 | – | ||||
| Total valid votes | 41,675 | 97.74 | – | |||||
| Total rejected ballots | 962 | 2.26 | – | |||||
| Turnout | 42,637 | 84.41 | +22.11 | |||||
| Electors on the lists | 50,512 | – | – | |||||
| 1966 Quebec general election | ||||||||
|---|---|---|---|---|---|---|---|---|
| Party | Candidate | Votes | % | |||||
| Liberal | Claire Kirkland-Casgrain | 14,603 | 62.14 | |||||
| Union Nationale | Bernard Couture | 4,659 | 19.82 | |||||
| Independent | Joseph Patrick Miller | 2,769 | 11.78 | |||||
| RIN | Jean Martineau | 1,297 | 5.52 | |||||
| Ralliement national | Roland Limoges | 173 | 0.74 | |||||
| Total valid votes | 23,501 | 97.47 | ||||||
| Total rejected ballots | 609 | 2.53 | ||||||
| Turnout | 24,110 | 62.30 | ||||||
| Electors on the lists | 38,700 | – | ||||||
References
External links
- Information
- Election results
- Election results (National Assembly)
- Maps
- 2011 map (PDF)
- 2001 map (Flash)
- 2001–2011 changes (Flash)
- 1992–2001 changes (Flash)
- Electoral map of Montreal region
- Quebec electoral map, 2011
Neighbouring electoral districts | ||||||||||||||||
|---|---|---|---|---|---|---|---|---|---|---|---|---|---|---|---|---|
| ||||||||||||||||
This article is issued from Wikipedia. The text is licensed under Creative Commons - Attribution - Sharealike. Additional terms may apply for the media files.