Kanata—Carleton
Kanata—Carleton is a federal electoral district in Ottawa, Ontario.[2]
 | |||
| Federal electoral district | |||
| Legislature | House of Commons | ||
| MP |
Liberal | ||
| District created | 2013 | ||
| First contested | 2015 | ||
| Last contested | 2021 | ||
| District webpage | profile, map | ||
| Demographics | |||
| Population (2016)[1] | 110,960 | ||
| Electors (2015) | 78,431 | ||
| Area (km²)[1] | 795 | ||
| Pop. density (per km²) | 139.6 | ||
| Census division(s) | Ottawa | ||
| Census subdivision(s) | Ottawa | ||
Kanata—Carleton was created by the 2012 federal electoral boundaries redistribution and was legally defined in the 2013 representation order. It came into effect upon the call of the 2015 federal election. The new riding contains almost all of the portion of the former Carleton—Mississippi Mills located in Ottawa, except for the portion south of Highway 7/Highway 417 that transferred to Carleton. A small fraction came from Nepean—Carleton surrounding the Bridlewood neighbourhood.
Geography
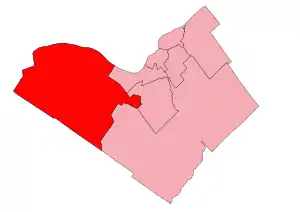
The riding covers an area within a boundary defined as follows: Western limit of Ottawa starting at Highway 7. NE along Highway7 to Highway 417. NE along Highway 417 to Maple Grove Road. NE along Maple Grove Road to the Carp River. SE along the Carp River to the SW section of Spearman Lane. NE along Spearman Lane to Terry Fox Drive. SE along Terry Fox to Hope Side Road. NE along Hope Side Road to Richmond Road. N along Richmond Road to West Hunt Club Road. NW to Haanel Drive with Robertson Road. SW along Robertson Road to Eagleson Road. NW along Eagleson Road to March Road, Herzberg Road and March Valley Road to Riddell Road to the interprovincial boundary between Ontario and Quebec. along the boundary to the north limit of the city of Ottawa then SW and SE along the northern and western limits of the city to the point of commencement.
Demographics
- According to the Canada 2021 Census[3]
Ethnic groups: 66.4% White, 8.0% Chinese, 7.0% South Asian, 3.8% Black, 3.4% Arab, 3.7% Indigenous, 1.8% Southeast Asian, 1.7% West Asian, 1.3% Latin American, 1.0% Filipino
Languages: 65.4% English, 6.0% French, 4.7% Mandarin, 2.6% Arabic, 1.5% Russian, 1.2% Cantonese, 1.2% Spanish
Religions: 51.2% Christian (26.3% Catholic, 5.4% Anglican, 4.4% United Church, 2.1% Christian Orthodox, 1.2% Presbyterian, 11.8% Other), 7.7% Muslim, 2.6% Hindu, 1.2% Buddhist, 35.1% None.
Median income: $54,400 (2020)
Average income: $69,100 (2020)
Members of Parliament
This riding has elected the following Members of Parliament:
| Parliament | Years | Member | Party | |
|---|---|---|---|---|
| Kanata—Carleton Riding created from Carleton—Mississippi Mills and Nepean—Carleton |
||||
| 42nd | 2015–2019 | Karen McCrimmon | Liberal | |
| 43rd | 2019–2021 | |||
| 44th | 2021–present | Jenna Sudds | ||
Election results
| 2021 Canadian federal election | ||||||||
|---|---|---|---|---|---|---|---|---|
| Party | Candidate | Votes | % | ±% | Expenditures | |||
| Liberal | Jenna Sudds | 26,394 | 41.8 | -1.5 | $88,313.94 | |||
| Conservative | Jennifer McAndrew | 24,373 | 38.6 | +2.1 | $89,188.03 | |||
| New Democratic | Melissa Coenraad | 8,822 | 14.0 | +1.5 | $21,505.67 | |||
| People's | Scott Miller | 1,858 | 2.9 | +1.5 | $7,855.45 | |||
| Green | Jennifer Purdy | 1,709 | 2.7 | -3.9 | $6,771.03 | |||
| Total valid votes | 63,156 | |||||||
| Total rejected ballots | 372 | |||||||
| Turnout | 63,528 | 73.52 | ||||||
| Eligible voters | 86,404 | |||||||
| Liberal hold | Swing | -1.8 | ||||||
| Source: Elections Canada[4] | ||||||||
| 2019 Canadian federal election | ||||||||
|---|---|---|---|---|---|---|---|---|
| Party | Candidate | Votes | % | ±% | Expenditures | |||
| Liberal | Karen McCrimmon | 28,746 | 43.05 | -8.24 | $101,971.36 | |||
| Conservative | Justina McCaffrey | 24,361 | 36.48 | -2.73 | none listed | |||
| New Democratic | Melissa Coenraad | 8,317 | 12.46 | +5.64 | $17,833.67 | |||
| Green | Jennifer Purdy | 4,387 | 6.57 | +3.88 | $15,580.62 | |||
| People's | Scott Miller | 961 | 1.44 | $0.00 | ||||
| Total valid votes/expense limit | 66,772 | 99.35 | ||||||
| Total rejected ballots | 438 | 0.65 | +0.35 | |||||
| Turnout | 67,210 | 77.00 | -1.96 | |||||
| Eligible voters | 87,281 | |||||||
| Liberal hold | Swing | -2.76 | ||||||
| Source: Elections Canada[5][6] | ||||||||
| 2015 Canadian federal election | ||||||||
|---|---|---|---|---|---|---|---|---|
| Party | Candidate | Votes | % | ±% | Expenditures | |||
| Liberal | Karen McCrimmon | 32,447 | 51.29 | +24.82 | $114,216.22 | |||
| Conservative | Walter Pamic | 24,829 | 39.21 | -14.50 | $98,315.02 | |||
| New Democratic | John Hansen | 4,313 | 6.81 | -8.48 | $24,279.11 | |||
| Green | Andrew West | 1,704 | 2.69 | -1.85 | $8,506.35 | |||
| Total valid votes/Expense limit | 63,323 | 99.70 | $214,203.12 | |||||
| Total rejected ballots | 191 | 0.30 | – | |||||
| Turnout | 63,514 | 78.97 | – | |||||
| Eligible voters | 80,433 | |||||||
| Liberal notional gain from Conservative | Swing | +19.66 | ||||||
| Source: Elections Canada[7][8][9] | ||||||||
| 2011 federal election redistributed results[10] | |||
|---|---|---|---|
| Party | Vote | % | |
| Conservative | 27,285 | 53.71 | |
| Liberal | 13,445 | 26.46 | |
| New Democratic | 7,766 | 15.29 | |
| Green | 2,307 | 4.54 | |
References
- Statistics Canada: 2012
- Final Report – Ontario
- Government of Canada, Statistics Canada (February 9, 2022). "Profile table, Census Profile, 2021 Census of Population - Kanata--Carleton [Federal electoral district (2013 Representation Order)], Ontario". www12.statcan.gc.ca. Retrieved March 8, 2023.
- "Official Voting Results". Elections Canada. Retrieved October 2, 2021.
- "List of confirmed candidates". Elections Canada. Retrieved October 3, 2019.
- "Official Voting Results". Elections Canada. Retrieved August 10, 2021.
- Elections Canada – Confirmed candidates for Kanata—Carleton, 30 September 2015
- Elections Canada – Preliminary Election Expenses Limits for Candidates Archived 2015-08-15 at the Wayback Machine
- "Résultats du soir d'élection - Circonscriptions".
- Pundits' Guide to Canadian Elections