Lac du Bonnet (electoral district)
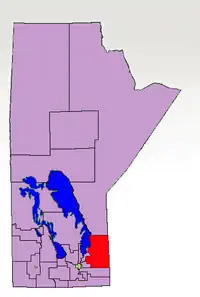
Lac du Bonnet is a provincial electoral division in the Canadian province of Manitoba. It was created by redistribution in 1957, and has formally existed since the provincial election of 1958. It is a relatively large constituency, located to the northeast of Winnipeg.
 | |||
| Provincial electoral district | |||
| Legislature | Legislative Assembly of Manitoba | ||
| MLA |
Progressive Conservative | ||
| District created | 1957 | ||
| First contested | 1958 | ||
| Last contested | 2019 | ||
| Demographics | |||
| Population (2016) | 23,005 | ||
| Electors (2019) | 15,477 | ||
| Area (km²) | 11,337 | ||
| Pop. density (per km²) | 2 | ||
Lac du Bonnet is bordered to the west by Red River North and Dawson Trail, to the south by La Verendrye, to the north by Keewatinook and to the east by the Ontario border. Communities in the riding include Lac Du Bonnet, Pinawa, Beausejour (known as the birthplace of Edward Schreyer), Whitemouth, Tyndall, Hadashville, Ste. Rita, and Powerview-Pine Falls.[1]
The riding is currently regarded as a Progressive Conservative/New Democratic Party marginal. The Tories have held the seat since 1988, though they retained it by only a narrow majority in 2003.
Demographics
The riding's population in 1996 was 20,035. In 1999, the average family income was $45,693, and the unemployment rate was 9.00%. There are a number of diverse economic communities in the riding, including farming, forestry and nuclear research. The service sector accounted for 12% of the riding's industry in 1999, followed by 10% in health and social services.
Lac Du Bonnet is an ethnically diverse riding. Eighteen per cent of the riding's residents are aboriginal, along with 9% German and 6% Ukrainian. Six per cent of the riding's residents are francophone.
List of provincial representatives
This riding has elected the following MLAs:
| Parliament | Years | Member | Party | |
|---|---|---|---|---|
| Riding created from Rupertsland, St. Clements, and Springfield | ||||
| 22nd | 1958–1959 | A.A. Trapp | Liberal-Progressive | |
| 23rd | 1959–1962 | Oscar Bjornson | Progressive Conservative | |
| 24th | 1962–1966 | |||
| 25th | 1966–1969 | |||
| 26th | 1969–1973 | Sam Uskiw | New Democratic | |
| 27th | 1973–1977 | |||
| 28th | 1977–1981 | |||
| 29th | 1981–1986 | |||
| 30th | 1986–1988 | Clarence Baker | ||
| 31st | 1988–1990 | Darren Praznik | Progressive Conservative | |
| 32nd | 1990–1995 | |||
| 33rd | 1995–1999 | |||
| 34th | 1999–2002 | |||
| 2002–2003 | Gerald Hawranik | |||
| 35th | 2003–2007 | |||
| 36th | 2007–2011 | |||
| 37th | 2011–2016 | Wayne Ewasko | ||
| 38th | 2016–2019 | |||
| 39th | 2019- | |||
Electoral results
1958 general election
| 1958 Manitoba general election | ||||||||
|---|---|---|---|---|---|---|---|---|
| Party | Candidate | Votes | % | |||||
| Liberal–Progressive | A. A. Trapp | 1,526 | 40.76 | |||||
| Progressive Conservative | Glen Stewart | 1,350 | 36.06 | |||||
| Co-operative Commonwealth | Harry Olensky | 569 | 15.20 | |||||
| Social Credit | Lawrence Schlamp | 299 | 7.99 | |||||
| Total valid votes | 3,744 | – | ||||||
| Rejected | 35 | – | ||||||
| Eligible voters / Turnout | 5,696 | 66.34 | ||||||
Source(s)
Source: Manitoba. Chief Electoral Officer (1999). Statement of Votes for the 37th Provincial General Election, September 21, 1999 (PDF) (Report). Winnipeg: Elections Manitoba. | ||||||||
1959 general election
| 1959 Manitoba general election | ||||||||
|---|---|---|---|---|---|---|---|---|
| Party | Candidate | Votes | % | ±% | ||||
| Progressive Conservative | Oscar Bjornson | 1,357 | 33.98 | -2.07 | ||||
| Liberal–Progressive | John Ateah | 1,272 | 31.86 | -8.90 | ||||
| Co-operative Commonwealth | Donald H. MacLean | 1,018 | 25.49 | 10.30 | ||||
| Independent | Stanley Copp | 346 | 8.67 | – | ||||
| Total valid votes | 3,993 | – | – | |||||
| Rejected | 8 | – | ||||||
| Eligible voters / Turnout | 5,622 | 71.17 | 4.82 | |||||
Source(s)
Source: Manitoba. Chief Electoral Officer (1999). Statement of Votes for the 37th Provincial General Election, September 21, 1999 (PDF) (Report). Winnipeg: Elections Manitoba. | ||||||||
1962 general election
| 1962 Manitoba general election | ||||||||
|---|---|---|---|---|---|---|---|---|
| Party | Candidate | Votes | % | ±% | ||||
| Progressive Conservative | Oscar Bjornson | 1,740 | 45.23 | 11.25 | ||||
| Liberal | John Ateah | 1,264 | 32.86 | 1.00 | ||||
| New Democratic | John William Bracken | 843 | 21.91 | -3.58 | ||||
| Total valid votes | 3,847 | – | – | |||||
| Rejected | 9 | – | ||||||
| Eligible voters / Turnout | 5,698 | 67.67 | -3.49 | |||||
Source(s)
Source: Manitoba. Chief Electoral Officer (1999). Statement of Votes for the 37th Provincial General Election, September 21, 1999 (PDF) (Report). Winnipeg: Elections Manitoba. | ||||||||
1966 general election
| 1966 Manitoba general election | ||||||||
|---|---|---|---|---|---|---|---|---|
| Party | Candidate | Votes | % | ±% | ||||
| Progressive Conservative | Oscar Bjornson | 1,342 | 31.73 | -13.50 | ||||
| Liberal | James L. Desilets | 1,262 | 29.84 | -3.02 | ||||
| New Democratic | Walter Zarecki | 1,151 | 27.22 | 5.30 | ||||
| Social Credit | Ruben R. Thomas | 474 | 11.21 | – | ||||
| Total valid votes | 4,229 | – | – | |||||
| Rejected | 14 | – | ||||||
| Eligible voters / Turnout | 6,398 | 66.32 | -1.36 | |||||
Source(s)
Source: Manitoba. Chief Electoral Officer (1999). Statement of Votes for the 37th Provincial General Election, September 21, 1999 (PDF) (Report). Winnipeg: Elections Manitoba. | ||||||||
1969 general election
| 1969 Manitoba general election | ||||||||
|---|---|---|---|---|---|---|---|---|
| Party | Candidate | Votes | % | ±% | ||||
| New Democratic | Sam Uskiw | 4,060 | 66.20 | 38.98 | ||||
| Progressive Conservative | Fred Klym | 1,267 | 20.66 | -11.07 | ||||
| Liberal | Al Tymko | 806 | 13.14 | -16.70 | ||||
| Total valid votes | 6,133 | – | – | |||||
| Rejected | 27 | – | ||||||
| Eligible voters / Turnout | 8,948 | 68.84 | 2.52 | |||||
Source(s)
Source: Manitoba. Chief Electoral Officer (1999). Statement of Votes for the 37th Provincial General Election, September 21, 1999 (PDF) (Report). Winnipeg: Elections Manitoba. | ||||||||
1973 general election
| 1973 Manitoba general election | ||||||||
|---|---|---|---|---|---|---|---|---|
| Party | Candidate | Votes | % | ±% | ||||
| New Democratic | Sam Uskiw | 5,461 | 70.88 | 4.68 | ||||
| Liberal | Jo Anne Hillier | 2,244 | 29.12 | 15.98 | ||||
| Total valid votes | 7,705 | – | – | |||||
| Rejected | 40 | – | ||||||
| Eligible voters / Turnout | 9,885 | 78.35 | 9.51 | |||||
Source(s)
Source: Manitoba. Chief Electoral Officer (1999). Statement of Votes for the 37th Provincial General Election, September 21, 1999 (PDF) (Report). Winnipeg: Elections Manitoba. | ||||||||
1977 general election
| 1977 Manitoba general election | ||||||||
|---|---|---|---|---|---|---|---|---|
| Party | Candidate | Votes | % | ±% | ||||
| New Democratic | Sam Uskiw | 5,037 | 53.89 | -16.99 | ||||
| Progressive Conservative | John Vaags | 3,795 | 40.60 | – | ||||
| Liberal | Robert "Bob" Dyne | 515 | 5.51 | -23.61 | ||||
| Total valid votes | 9,347 | – | – | |||||
| Rejected | 12 | – | ||||||
| Eligible voters / Turnout | 11,731 | 79.78 | 1.43 | |||||
Source(s)
Source: Manitoba. Chief Electoral Officer (1999). Statement of Votes for the 37th Provincial General Election, September 21, 1999 (PDF) (Report). Winnipeg: Elections Manitoba. | ||||||||
1981 general election
| 1981 Manitoba general election | ||||||||
|---|---|---|---|---|---|---|---|---|
| Party | Candidate | Votes | % | ±% | ||||
| New Democratic | Sam Uskiw | 4,682 | 62.50 | 8.61 | ||||
| Progressive Conservative | Berton Trainor | 2,809 | 37.50 | -3.10 | ||||
| Total valid votes | 7,491 | – | – | |||||
| Rejected | 40 | – | ||||||
| Eligible voters / Turnout | 10,708 | 70.33 | -9.45 | |||||
Source(s)
Source: Manitoba. Chief Electoral Officer (1999). Statement of Votes for the 37th Provincial General Election, September 21, 1999 (PDF) (Report). Winnipeg: Elections Manitoba. | ||||||||
1986 general election
| 1986 Manitoba general election | ||||||||
|---|---|---|---|---|---|---|---|---|
| Party | Candidate | Votes | % | ±% | ||||
| New Democratic | Clarence Baker | 3,903 | 46.12 | -16.38 | ||||
| Progressive Conservative | Darren Praznik | 3,601 | 42.55 | 5.05 | ||||
| Liberal | Jerry Fontaine | 959 | 11.33 | – | ||||
| Total valid votes | 8,463 | – | – | |||||
| Rejected | 17 | – | ||||||
| Eligible voters / Turnout | 11,469 | 73.94 | 3.61 | |||||
| New Democratic hold | Swing | |||||||
Source(s)
Source: Manitoba. Chief Electoral Officer (1999). Statement of Votes for the 37th Provincial General Election, September 21, 1999 (PDF) (Report). Winnipeg: Elections Manitoba. | ||||||||
1988 general election
| 1988 Manitoba general election | ||||||||
|---|---|---|---|---|---|---|---|---|
| Party | Candidate | Votes | % | ±% | ||||
| Progressive Conservative | Darren Praznik | 3,773 | 41.48 | -1.07 | ||||
| New Democratic | Clarence Baker | 2,911 | 32.01 | -14.11 | ||||
| Liberal | Peter Raymond | 2,411 | 26.51 | 15.18 | ||||
| Total valid votes | 9,095 | – | – | |||||
| Rejected | 13 | – | ||||||
| Eligible voters / Turnout | 11,757 | 77.47 | 3.53 | |||||
Source(s)
Source: Manitoba. Chief Electoral Officer (1999). Statement of Votes for the 37th Provincial General Election, September 21, 1999 (PDF) (Report). Winnipeg: Elections Manitoba. | ||||||||
1990 general election
| 1990 Manitoba general election | ||||||||
|---|---|---|---|---|---|---|---|---|
| Party | Candidate | Votes | % | ±% | ||||
| Progressive Conservative | Darren Praznik | 5,162 | 53.70 | 12.21 | ||||
| New Democratic | Leonard Kolton | 3,142 | 32.68 | 0.68 | ||||
| Liberal | Frank Thibedeau | 1,309 | 13.62 | -12.89 | ||||
| Total valid votes | 9,613 | – | – | |||||
| Rejected | 27 | – | ||||||
| Eligible voters / Turnout | 13,194 | 73.06 | -4.41 | |||||
Source(s)
Source: Manitoba. Chief Electoral Officer (1999). Statement of Votes for the 37th Provincial General Election, September 21, 1999 (PDF) (Report). Winnipeg: Elections Manitoba. | ||||||||
1995 general election
| 1995 Manitoba general election | ||||||||
|---|---|---|---|---|---|---|---|---|
| Party | Candidate | Votes | % | ±% | ||||
| Progressive Conservative | Darren Praznik | 5,986 | 57.07 | 3.38 | ||||
| New Democratic | Marguerite Ogilvie | 3,463 | 33.02 | 0.33 | ||||
| Liberal | Bill Flett | 1,039 | 9.91 | -3.71 | ||||
| Total valid votes | 10,488 | – | – | |||||
| Rejected | 34 | – | ||||||
| Eligible voters / Turnout | 13,846 | 75.99 | 2.93 | |||||
Source(s)
Source: Manitoba. Chief Electoral Officer (1999). Statement of Votes for the 37th Provincial General Election, September 21, 1999 (PDF) (Report). Winnipeg: Elections Manitoba. | ||||||||
1999 general election
| 1999 Manitoba general election | ||||||||
|---|---|---|---|---|---|---|---|---|
| Party | Candidate | Votes | % | ±% | Expenditures | |||
| Progressive Conservative | Darren Praznik | 4,835 | 50.78 | -6.29 | $26,804.49 | |||
| New Democratic | Michael Hameluck | 4,686 | 49.22 | 16.20 | $29,666.00 | |||
| Total valid votes | 9,521 | – | – | |||||
| Rejected | 64 | – | ||||||
| Eligible voters / turnout | 14,443 | 66.36 | -9.63 | |||||
Source(s)
Source: Manitoba. Chief Electoral Officer (1999). Statement of Votes for the 37th Provincial General Election, September 21, 1999 (PDF) (Report). Winnipeg: Elections Manitoba. | ||||||||
2002 by-election
| Manitoba provincial by-election, March 12, 2002 | ||||||||
|---|---|---|---|---|---|---|---|---|
| Party | Candidate | Votes | % | ±% | ||||
| Progressive Conservative | Gerald Hawranik | 3,398 | 41.04 | -9.74 | ||||
| New Democratic | Michael "Mike" Hameluck | 3,234 | 39.06 | -10.15 | ||||
| Liberal | George William Harbottle | 1,647 | 19.89 | – | ||||
| Total valid votes | 8,279 | – | – | |||||
| Rejected | N/A | – | ||||||
| Eligible voters / Turnout | N/A | – | – | |||||
Source(s)
Source: | ||||||||
2003 general election
| 2003 Manitoba general election | ||||||||
|---|---|---|---|---|---|---|---|---|
| Party | Candidate | Votes | % | ±% | ||||
| Progressive Conservative | Gerald Hawranik | 4,380 | 51.26 | 10.21 | ||||
| New Democratic | Michael Hameluck | 3,875 | 45.35 | 6.29 | ||||
| Liberal | Cheryl Appleyard | 290 | 3.39 | -16.50 | ||||
| Total valid votes | 8,545 | – | – | |||||
| Rejected | 27 | – | ||||||
| Eligible voters / Turnout | 14,164 | 60.52 | – | |||||
Source(s)
Source: Manitoba. Chief Electoral Officer (2003). Statement of Votes for the 38th Provincial General Election, June 3, 2003 (PDF) (Report). Winnipeg: Elections Manitoba. | ||||||||
2007 general election
| 2007 Manitoba general election | ||||||||
|---|---|---|---|---|---|---|---|---|
| Party | Candidate | Votes | % | ±% | Expenditures | |||
| Progressive Conservative | Gerald Hawranik | 4,866 | 59.01 | 7.75 | $24,695.70 | |||
| New Democratic | Patrick O'Connor | 2,773 | 33.63 | -11.72 | $11,782.23 | |||
| Liberal | Christopher Gmiterek | 607 | 7.36 | 3.97 | $340.29 | |||
| Total valid votes | 8,246 | – | – | |||||
| Rejected | 27 | – | ||||||
| Eligible voters / turnout | 14,138 | 58.52 | -2.00 | |||||
Source(s)
Source: Manitoba. Chief Electoral Officer (2007). Statement of Votes for the 39th Provincial General Election, May 22, 2007 (PDF) (Report). Winnipeg: Elections Manitoba. | ||||||||
2011 general election
| 2011 Manitoba general election | ||||||||
|---|---|---|---|---|---|---|---|---|
| Party | Candidate | Votes | % | ±% | Expenditures | |||
| Progressive Conservative | Wayne Ewasko | 4,350 | 54.30 | -4.71 | $20,568.00 | |||
| New Democratic | Elana Spence | 3,087 | 38.53 | 4.91 | $13,574.10 | |||
| Green | Dan Green | 290 | 3.62 | – | $1,517.95 | |||
| Liberal | Charlett Millen | 284 | 3.55 | -3.82 | $2,966.68 | |||
| Total valid votes | 8,011 | – | – | |||||
| Rejected | 24 | – | ||||||
| Eligible voters / turnout | 13,844 | 58.04 | -0.48 | |||||
Source(s)
Source: Manitoba. Chief Electoral Officer (2011). Statement of Votes for the 40th Provincial General Election, October 4, 2011 (PDF) (Report). Winnipeg: Elections Manitoba. "Election Returns: 40th General Election". Elections Manitoba. 2011. Retrieved September 12, 2018. | ||||||||
2016 general election
| 2016 Manitoba general election | ||||||||
|---|---|---|---|---|---|---|---|---|
| Party | Candidate | Votes | % | ±% | Expenditures | |||
| Progressive Conservative | Wayne Ewasko | 5,666 | 77.48 | 23.18 | $25,069.13 | |||
| New Democratic | Wendy Sol | 1,647 | 22.52 | -16.01 | $2,955.31 | |||
| Total valid votes | 7,313 | – | – | |||||
| Rejected | 227 | – | ||||||
| Eligible voters / Turnout | 13,729 | 54.92 | -3.12 | |||||
Source(s)
Source: Manitoba. Chief Electoral Officer (2016). Statement of Votes for the 41st Provincial General Election, April 19, 2016 (PDF) (Report). Winnipeg: Elections Manitoba. "Election Returns: 41st General Election". Elections Manitoba. 2016. Retrieved September 10, 2018. | ||||||||
2019 general election
| 2019 Manitoba general election | ||||||||
|---|---|---|---|---|---|---|---|---|
| Party | Candidate | Votes | % | ±% | Expenditures | |||
| Progressive Conservative | Wayne Ewasko | 6,177 | 65.91 | -11.57 | $23,226.73 | |||
| New Democratic | Sidney Klassen | 1,814 | 19.36 | -3.17 | $1,256.85 | |||
| Liberal | Terry Hayward | 1,381 | 14.74 | – | $4,507.33 | |||
| Total valid votes | 9,372 | – | – | |||||
| Rejected | 106 | – | ||||||
| Eligible voters / Turnout | 15,477 | 61.24 | 6.32 | |||||
Source(s)
Source: Manitoba. Chief Electoral Officer (2019). Statement of Votes for the 42nd Provincial General Election, September 10, 2019 (PDF) (Report). Winnipeg: Elections Manitoba. "Candidate Election Returns". Elections Manitoba. Elections Manitoba. Retrieved March 2, 2020. | ||||||||
Previous boundaries
References
- "What to know about the Lac du Bonnet riding for Manitoba's 2023 election". CBC News. September 1, 2023. Retrieved September 1, 2023.