Leicester urban area
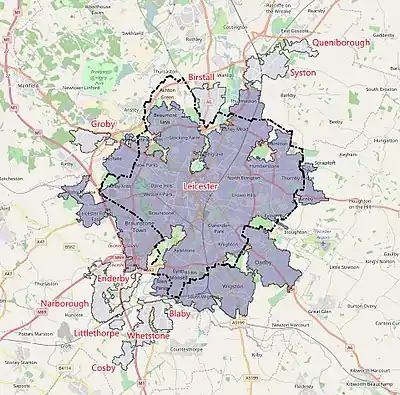
The Leicester Urban Area or Leicester Built Up Area (2011 onwards) is an urban agglomeration defined by the Office of National Statistics (ONS), centred on the City of Leicester in the English Midlands. With a population of 559,017 at the time of the 2021 census,[1] increased from 508,916 at the time of the 2011 census, the Built Up Area is the eleventh largest in England and thirteenth largest in the United Kingdom. It comprises Leicester itself and its suburbs, all of which are contiguous with, or situated in close proximity to, the city.
As at 2011 the Leicester Urban Area was home to 51.8% of the total population of Leicestershire[2] (2001: 48.5%). A 2017 quote from the Leicester City Council website states that "The Greater Leicester urban area is one of the fastest growing in the country, with a population of about 650,000, of which 350,000 live within the city council area"[3].
Analysis: 2011

|
Leicester Built-up Area | ||||||||||||||||||||||||||||||||||||||||||||
|---|---|---|---|---|---|---|---|---|---|---|---|---|---|---|---|---|---|---|---|---|---|---|---|---|---|---|---|---|---|---|---|---|---|---|---|---|---|---|---|---|---|---|---|---|
| Urban subdivision | Population | |||||||||||||||||||||||||||||||||||||||||||
| Leicester ONS |
|
City & inner suburbs 443,760 | ||||||||||||||||||||||||||||||||||||||||||
| Narborough / Enderby | 12,996 | Outer suburbs
65,156 | ||||||||||||||||||||||||||||||||||||||||||
| Syston | 12,804 | |||||||||||||||||||||||||||||||||||||||||||
| Blaby / Whetstone | 12,760 | |||||||||||||||||||||||||||||||||||||||||||
| Birstall | 12,216 | |||||||||||||||||||||||||||||||||||||||||||
| Groby | 6,782 | |||||||||||||||||||||||||||||||||||||||||||
| Cosby | 3,506 | |||||||||||||||||||||||||||||||||||||||||||
| Queniborough | 2,326 | |||||||||||||||||||||||||||||||||||||||||||
| Littlethorpe | 1,766 | |||||||||||||||||||||||||||||||||||||||||||
| Total | 508,916 | |||||||||||||||||||||||||||||||||||||||||||
| Change % from 2001 | ||||||||||||||||||||||||||||||||||||||||||||
Analysis: 2001

|
Leicester Urban Area | ||||||||||||||||||||||||||||||||||||||||
|---|---|---|---|---|---|---|---|---|---|---|---|---|---|---|---|---|---|---|---|---|---|---|---|---|---|---|---|---|---|---|---|---|---|---|---|---|---|---|---|---|
| Urban subdivision | Population | |||||||||||||||||||||||||||||||||||||||
| Leicester ONS |
|
City & inner suburbs 330,574 | ||||||||||||||||||||||||||||||||||||||
| Wigston | 33,116 | Outer suburbs
110,639 | ||||||||||||||||||||||||||||||||||||||
| Oadby | 22,679 | |||||||||||||||||||||||||||||||||||||||
| Blaby / Whetstone | 12,263 | |||||||||||||||||||||||||||||||||||||||
| Birstall | 11,480 | |||||||||||||||||||||||||||||||||||||||
| Kirby Muxloe | 9,500 | |||||||||||||||||||||||||||||||||||||||
| Groby | 6,256 | |||||||||||||||||||||||||||||||||||||||
| Beaumont Leys | 5,579 | |||||||||||||||||||||||||||||||||||||||
| Ratby | 3,862 | |||||||||||||||||||||||||||||||||||||||
| Cosby | 3,647 | |||||||||||||||||||||||||||||||||||||||
| Queniborough | 2,257 | |||||||||||||||||||||||||||||||||||||||
| Total | 441,213 | |||||||||||||||||||||||||||||||||||||||
| Change % from 1991 | ||||||||||||||||||||||||||||||||||||||||
Analysis: 1991

|
Leicester Urban Area | ||||||||||||||||||||||
|---|---|---|---|---|---|---|---|---|---|---|---|---|---|---|---|---|---|---|---|---|---|---|
| Urban subdivision | Population | |||||||||||||||||||||
| Leicester ONS |
|
City & inner suburbs 318,518 | ||||||||||||||||||||
| Wigston | 32,864 | Outer suburbs
98,083 | ||||||||||||||||||||
| Oadby | 18,538 | |||||||||||||||||||||
| Birstall | 11,770 | |||||||||||||||||||||
| Kirby Muxloe | 7,780 | |||||||||||||||||||||
| Groby | 7,183 | |||||||||||||||||||||
| Blaby | 6,538 | |||||||||||||||||||||
| Whetstone | 4,032 | |||||||||||||||||||||
| Ratby | 3,601 | |||||||||||||||||||||
| Cosby | 3,390 | |||||||||||||||||||||
| Queniborough | 2,387 | |||||||||||||||||||||
| Total | 416,601 | |||||||||||||||||||||
| Change % from 1981 | ||||||||||||||||||||||
Analysis: 1981

|
Leicester Urban Area | ||||||||||||||||||||||
|---|---|---|---|---|---|---|---|---|---|---|---|---|---|---|---|---|---|---|---|---|---|---|
| Urban subdivision | Population | |||||||||||||||||||||
| Leicester ONS |
|
City & inner suburbs 324,394 | ||||||||||||||||||||
| Wigston | 32,373 | Outer suburbs
80,008 | ||||||||||||||||||||
| Oadby | 18,331 | |||||||||||||||||||||
| Birstall | 12,519 | |||||||||||||||||||||
| Kirby Muxloe | 6,896 | |||||||||||||||||||||
| Groby | 4,689 | |||||||||||||||||||||
| Ratby | 3,095 | |||||||||||||||||||||
| Queniborough | 2,105 | |||||||||||||||||||||
| Total | 404,402 | |||||||||||||||||||||
Analysis: Notes
The Leicester ONS sub-totals are explained with reference to the following:
- For 2011, there have been certain reclassifications from 'outer' to 'inner suburbs' thus contributing to the increase in population of Leicester ONS compared to 2001 and prior.
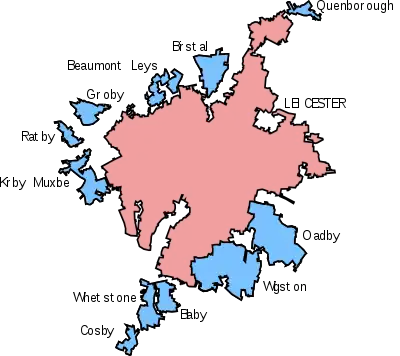
- The ONS's definition of "Leicester" in the 2001 census excluded the northern area of the Beaumont Leys ward, which was counted separately, and amalgamated several surrounding towns and villages. Its boundaries and population were not the same as that of the Leicester UNITARY, which had a separate population of 279,921 at the 2001 Census and includes Beaumont Leys. See the 2001 Leicester ONS analysis.
- Ongoing refinements in methodology between the two census dates meant that contiguous suburbs, external to the city boundaries and which were subdivided up to 2001, were merged into the 2011 Leicester ONS figure. These, along with infilling at the margins, also accounted for the removal of Ratby and the addition of new subdivisions.
- Leicester ONS figures do not include the Ashton Green/Glebelands/Thurcaston Park development (containing 556 residents in 2011). Although within the city boundaries, this incipient addition is in effect a satellite village given that there is 'green separation'. This categorisation is likely to change as future residential expansion planned around the development,[8] converges towards Beaumont Leys and Birstall; both part of the urban area/BUA.
The Kirby Muxloe figures up to 2001 includes the portion of Leicester Forest East which is to the west of the M1 motorway. The eastern section is part of the Leicester ONS subdivision, and is listed separately in the 2001 table.
Although Stoughton is shown as a small leg of the urban area, its figures are not counted.
See also
References
- "UNITED KINGDOM: Urban Areas in England". City Population. Retrieved 26 April 2023.
- Combined city and county
- 'Exhibitions give information about Local Plan' (Published on 11 September 2017)
- "KS101EW (Usual resident population) - Nomis - Official Labour Market Statistics". www.nomisweb.co.uk. Retrieved 2017-06-17.
- "United Kingdom: Urban Areas 2001". ONS. Retrieved 11 November 2016.
- "United Kingdom: Urban Areas 1991". ONS. Retrieved 21 July 2017.
- 1981 Key Statistics for Urban Areas: The Midlands Table 1, Office for National Statistics, 1981.
- "Ashton Green development project". www.leicester.gov.uk.