U.S. state and territory temperature extremes
The following table lists the highest and lowest temperatures recorded in the 50 U.S. states, the District of Columbia, and the 5 inhabited U.S. territories during the past two centuries, in both Fahrenheit and Celsius.[1] If two dates have the same temperature record (e.g. record low of 40 °F or 4.4 °C in 1911 in Aibonito and 1966 in San Sebastian in Puerto Rico), only the most recent date is shown.
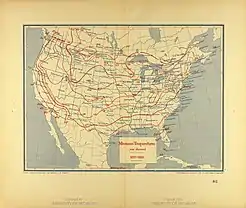
Minimum temperature map of the United States from 1871-1888
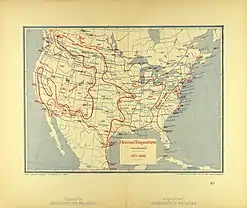
Maximum temperature map of the United States from 1871-1888
Extreme temperatures for each U.S. state and territory
| State, federal district, or territory | Record high temperature | Date | Place(s) | Record low temperature | Date | Place(s) | Difference |
|---|---|---|---|---|---|---|---|
| 112 °F (44.4 °C) | September 6, 1925 | Centreville | −27 °F (−32.8 °C) | January 30, 1966 | New Market | 139 °F (77.2 °C) | |
| 100 °F (37.8 °C) | June 27, 1915 | Fort Yukon | −80 °F (−62.2 °C) | January 23, 1971 | Prospect Creek | 180 °F (100 °C) | |
| 99 °F (37.2 °C) | April 27, 1972[note 2] | Malaeloa/Aitulagi | 53 °F (11.7 °C) | March 28, 1962 | Malaeloa/Aitulagi | 46 °F (25.6 °C) | |
| 128 °F (53.3 °C) | June 29, 1994 | Lake Havasu City | −40 °F (−40 °C) | January 7, 1971 | McNary | 168 °F (93.3 °C) | |
| 120 °F (48.9 °C) | August 10, 1936 | Ozark | −29 °F (−33.9 °C) | February 13, 1905 | Gravette | 149 °F (82.8 °C) | |
| 134.0 °F (56.7 °C) | July 10, 1913 | Greenland Ranch (Death Valley) | −45 °F (−42.8 °C) | January 20, 1937 | Boca | 179 °F (99.4 °C) | |
| 115 °F (46.1 °C) | July 20, 2019 | John Martin Reservoir[3] | −61 °F (−51.7 °C) | February 1, 1985 | Maybell | 176 °F (97.8 °C) | |
| 106 °F (41.1 °C) | July 15, 1995 | Danbury | −37 °F (−38.3 °C) | February 16, 1943 | Norfolk[4] | 143 °F (79.4 °C) | |
| 110 °F (43.3 °C) | July 21, 1930 | Millsboro | −17 °F (−27.2 °C) | January 17, 1893 | Millsboro | 127 °F (70.6 °C) | |
| 106 °F (41.1 °C) | July 20, 1930[note 2] | Washington | −15 °F (−26.1 °C) | February 11, 1899 | Washington | 121 °F (67.2 °C) | |
| 108 °F (42.2 °C) | June 29, 1931 | Monticello | −2 °F (−18.9 °C) | February 13, 1899 | Tallahassee | 111 °F (61.7 °C) | |
| 112 °F (44.4 °C) | August 20, 1983[note 2] | Greenville | −17 °F (−27.2 °C) | January 27, 1940 | Chatsworth | 129 °F (71.7 °C) | |
| 100 °F (37.8 °C) | September 10, 1945 | Sånta Rita-Sumai | 56 °F (13.3 °C) | May 31, 1987 | Inalåhan | 44 °F (24.4 °C) | |
| 100 °F (37.8 °C) | April 27, 1931 | Pahala | 15 °F (−9.4 °C) | January 5, 1975 | Mauna Kea Observatories[7] | 83 °F (46 °C) | |
| 118 °F (47.8 °C) | July 28, 1934 | Orofino | −60 °F (−51.1 °C) | January 18, 1943 | Island Park | 178 °F (98.9 °C) | |
| 117 °F (47.2 °C) | July 14, 1954 | East Saint Louis | −38 °F (−38.9 °C) | January 31, 2019 | Mount Carroll[8] | 155 °F (86.1 °C) | |
| 116 °F (46.7 °C) | July 14, 1936 | Collegeville | −36 °F (−37.8 °C) | January 19, 1994 | New Whiteland | 152 °F (84.4 °C) | |
| 118 °F (47.8 °C) | July 20, 1934 | Keokuk | −47 °F (−43.9 °C) | February 3, 1996[note 2] | Elkader | 165 °F (91.7 °C) | |
| 121 °F (49.4 °C) | July 24, 1936[note 2] | Alton | −40 °F (−40.0 °C) | February 13, 1905 | Lebanon | 161 °F (89.4 °C) | |
| 116 °F (46.7 °C) | July 28, 1930 | Louisville | −37 °F (−38.3 °C) | January 19, 1994 | Shelbyville | 151 °F (83.9 °C) | |
| 114 °F (45.6 °C) | August 10, 1936 | Plain Dealing | −16 °F (−26.7 °C) | February 13, 1899 | Minden | 130 °F (72.2 °C) | |
| 105 °F (40.6 °C) | July 10, 1911[note 2] | North Bridgton | −50 °F (−45.6 °C) | January 16, 2009 | Clayton Lake | 155 °F (86.1 °C) | |
| 109 °F (42.8 °C) | July 10, 1936[note 2] | Cumberland | −40 °F (−40 °C) | January 13, 1912 | Oakland | 149 °F (82.8 °C) | |
| 107 °F (41.7 °C) | August 2, 1975 | New Bedford | −40 °F (−40 °C) | January 22, 1984 | Chester[4] | 147 °F (81.7 °C) | |
| 112 °F (44.4 °C) | July 13, 1936 | Mio | −51 °F (−46.1 °C) | February 9, 1934 | Vanderbilt | 163 °F (90.6 °C) | |
| 115 °F (46.1 °C) | July 29, 1917 | Beardsley | −60 °F (−51.1 °C) | February 2, 1996 | Tower | 175 °F (97.2 °C) | |
| 115 °F (46.1 °C) | July 29, 1930 | Holly Springs | −19 °F (−28.3 °C) | January 30, 1966 | Corinth | 134 °F (74.4 °C) | |
| 118 °F (47.8 °C) | July 14, 1954[note 2] | Warsaw | −40 °F (−40 °C) | February 13, 1905 | Warsaw | 158 °F (87.8 °C) | |
| 117 °F (47.2 °C) | July 5, 1937 | Medicine Lake | −70 °F (−56.7 °C) | January 20, 1954 | Lincoln (Rogers Pass) | 187 °F (103.9 °C) | |
| 118 °F (47.8 °C) | July 24, 1936[note 2] | Minden | −47 °F (−43.9 °C) | December 22, 1989[note 2] | Oshkosh | 165 °F (91.7 °C) | |
| 125 °F (51.7 °C) | June 29, 1994 | Laughlin | −50 °F (−45.6 °C) | January 8, 1937 | San Jacinto | 175 °F (97.2 °C) | |
| 106 °F (41.1 °C) | July 4, 1911 | Nashua | −50 °F (−45.6 °C) | January 22, 1885 | Mount Washington | 156 °F (86.7 °C) | |
| 110 °F (43.3 °C) | July 10, 1936 | Runyon | −34 °F (−36.7 °C) | January 5, 1904 | River Vale | 144 °F (80 °C) | |
| 122 °F (50 °C) | June 27, 1994 | Carlsbad | −50 °F (−45.6 °C) | February 1, 1951 | Gavilan | 172 °F (95.6 °C) | |
| 108 °F (42.2 °C) | July 22, 1926 | Troy | −52 °F (−46.7 °C) | February 18, 1979[note 2] | Old Forge[9] | 160 °F (88.9 °C) | |
| 110 °F (43.3 °C) | August 21, 1983 | Fayetteville | −34 °F (−36.7 °C) | January 21, 1985 | Burnsville | 144 °F (80 °C) | |
| 121 °F (49.4 °C) | July 6, 1936 | Steele | −60 °F (−51.1 °C) | February 15, 1936 | Parshall | 181 °F (100.6 °C) | |
| 99 °F (37.2 °C) | July 8, 2010 | Saipan | 62 °F (16.7 °C) | December 15, 2000 | Saipan | 37 °F (20.6 °C) | |
| 113 °F (45 °C) | July 21, 1934 | Gallipolis | −39 °F (−39.4 °C) | February 10, 1899 | Milligan | 152 °F (84.4 °C) | |
| 120 °F (48.9 °C) | August 12, 1936[note 2] | Altus | −31 °F (−35.0 °C) | February 10, 2011 | Nowata | 151 °F (83.9 °C) | |
| 119 °F (48.3 °C) | June 29, 2021[note 2] | Pelton Dam | −54 °F (−47.8 °C) | February 10, 1933[note 2] | Seneca | 172 °F (96 °C) | |
| 111 °F (43.9 °C) | July 10, 1936[note 2] | Phoenixville | −42 °F (−41.1 °C) | January 5, 1904 | Smethport | 153 °F (85 °C) | |
| 104 °F (40 °C) | July 2, 1996 | Isla de Mona (Mayagüez) | 40 °F (4.4 °C) | January 24, 1966[note 2] | San Sebastián | 64 °F (35.6 °C) | |
| 104 °F (40 °C) | August 2, 1975 | Providence | −28 °F (−33.3 °C) | January 17, 1942 | Richmond | 132 °F (73.3 °C) | |
| 113 °F (45 °C) | June 29, 2012 | Columbia | −22 °F (−30 °C) | January 21, 1985 | Landrum (Hogback Mountain)[4] | 135 °F (75 °C) | |
| 120 °F (48.9 °C) | July 15, 2006[note 2] | Fort Pierre[note 2] | −58 °F (−50 °C) | February 17, 1936 | McIntosh | 178 °F (98.9 °C) | |
| 113 °F (45 °C) | August 9, 1930[note 2] | Perryville | −32 °F (−35.6 °C) | December 30, 1917 | Mountain City | 145 °F (80.6 °C) | |
| 120 °F (48.9 °C) | June 28, 1994[note 2] | Monahans | −23 °F (−30.6 °C) | February 8, 1933[note 2] | Seminole | 143 °F (79.4 °C) | |
| 118 °F (47.8 °C) | July 4, 2007 | St. George | −69 °F (−56.1 °C) | February 1, 1985 | Peter Sinks[11] | 187 °F (103.9 °C) | |
| 105 °F (40.6 °C) | July 4, 1911 | Vernon[4] | −50 °F (−45.6 °C) | December 30, 1933 | Bloomfield | 155 °F (86.1 °C) | |
| 99 °F (37.2 °C) | June 23, 1996[note 2] | Charlotte Amalie West (Cyril E. King Airport) | 51 °F (10.6 °C) | January 31, 1954 | Anna's Hope (Saint Croix) | 48 °F (26.7 °C) | |
| 110 °F (43.3 °C) | July 15, 1954 | Balcony Falls | −30 °F (−34.4 °C) | January 22, 1985 | Pembroke | 140 °F (77.8 °C) | |
| 120 °F (48.9 °C) | June 29, 2021 | Hanford Site | −48 °F (−44.4 °C) | December 30, 1968 | Winthrop | 168 °F (93.3 °C) | |
| 112 °F (44.4 °C) | July 10, 1936[note 2] | Martinsburg | −37 °F (−38.3 °C) | December 30, 1917 | Lewisburg | 149 °F (82.8 °C) | |
| 114 °F (45.6 °C) | July 13, 1936 | Wisconsin Dells | −55 °F (−48.3 °C) | February 4, 1996 | Couderay | 169 °F (93.9 °C) | |
| 115 °F (46.1 °C) | August 8, 1983 | Basin | −63 °F (−52.8 °C) | February 9, 1933 | Moran[4] | 178 °F (98.9 °C) |
Unreferenced data assumed to be from NOAA
See also
- Canadian provincial and territorial temperature extremes
- February 2023 North American cold wave — Mount Washington in New Hampshire experienced a record breaking wind chill of −108 °F (−78 °C).[12]
Notes
- These are the temperature extremes for Tutuila Island. Temperature extremes for other parts of American Samoa, such as the Manuʻa Islands, are unavailable.
- Also on earlier date or dates in that state or territory
- These are the temeperature extremes for Saipan, Tinian and Rota. Temperature extremes for the Northern Islands Municipality are unavailable.
References
- National Climatic Data Center. "State Climate Extremes Committee (SCsEC)". Retrieved February 14, 2015.
- http://scacis.rcc-acis.org/ SC ACIS (Applied Climate Information System). NOAA Regional Climate Centers. Retrieved September 5, 2019.
- Sakas, Michael (October 4, 2019). "It's Official, Colorado's 'Wild Weather Year' Sets New High Temp And Hailstone Records". Retrieved October 5, 2019.
- Christopher C. Burt. "Some Errors in the NCDC U.S.A. State Weather Extreme Records Data: Part 2". wunderground.com. Archived from the original on October 12, 2015.
{{cite web}}: CS1 maint: bot: original URL status unknown (link) - Samenow, Jason (June 29, 2012). "Washington, D.C. shatters all-time June record high, sizzles to 104". The Washington Post. Archived from the original on March 26, 2023.
- https://web.archive.org/web/20101231041158/http://www.erh.noaa.gov/lwx/winter/DC-Winters.htm Watson, Barbara McNaught (November 17, 1999). "Washington Area Winters". National Weather Service. Archived from the original on December 31, 2010.
- Christopher C. Burt. "Some Errors in the NCDC U.S.A. State Weather Extreme Records Data: Part 1". wunderground.com. Archived from the original on October 12, 2015.
{{cite web}}: CS1 maint: bot: original URL status unknown (link) - "Memorandum — Illinois State Record Minimum Temperature at Mt. Carroll" (PDF). NCDC. Retrieved March 7, 2019.
- "UNITED STATES EXTREME RECORD TEMPERATURES & DIFFERENCES. Golden Gate Weather Services. Published 2014. Accessed 19 February 2019".
- https://www.weather.gov/sju/climo_extremes NOAA. National Weather Service. All Time Extremes for PR and VI. Retrieved September 5, 2019.
- "Peter Sinks Temperature Monitoring". Utah Climate Center. Retrieved February 20, 2018.
- Cappucci, Matthew (February 4, 2023). "'Historic Arctic outbreak' crushes records in New England". The Washington Post. Archived from the original on March 30, 2023.
External links
- NOAA Satellite and Information Service, National Climatic Data Center
- NOAA Website — Weather Extremes
- NOAA Website — Record Highest/Lowest Temperatures by State
This article is issued from Wikipedia. The text is licensed under Creative Commons - Attribution - Sharealike. Additional terms may apply for the media files.