Llorente, Eastern Samar
Llorente (IPA: [ˌʎoˈrɛntɛ]), officially the Municipality of Llorente (Waray: Bungto han Llorente; Tagalog: Bayan ng Llorente), is a 3rd class municipality in the province of Eastern Samar, Philippines. According to the 2020 census, it has a population of 21,459 people.[3]
Llorente
Lanang | |
|---|---|
| Municipality of Llorente | |
 Flag | |
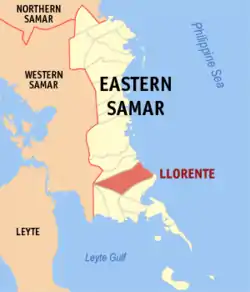 Map of Eastern Samar with Llorente highlighted | |
OpenStreetMap | |
.svg.png.webp) Llorente Location within the Philippines | |
| Coordinates: 11°24′45″N 125°32′45″E | |
| Country | Philippines |
| Region | Eastern Visayas |
| Province | Eastern Samar |
| District | Lone district |
| Named for | Julio Aballe Llorente |
| Barangays | 33 (see Barangays) |
| Government | |
| • Type | Sangguniang Bayan |
| • Mayor | Daniel C. Boco |
| • Vice Mayor | Jonnie A. Condrada |
| • Representative | Maria Fe R. Abunda |
| • Councilors | List |
| • Electorate | 14,151 voters (2022) |
| Area | |
| • Total | 496.07 km2 (191.53 sq mi) |
| Elevation | 21 m (69 ft) |
| Highest elevation | 181 m (594 ft) |
| Lowest elevation | 0 m (0 ft) |
| Population (2020 census)[3] | |
| • Total | 21,459 |
| • Density | 43/km2 (110/sq mi) |
| • Households | 5,333 |
| Economy | |
| • Income class | 3rd municipal income class |
| • Poverty incidence | 51.81 |
| • Revenue | ₱ 185 million (2020) |
| • Assets | ₱ 484 million (2020) |
| • Expenditure | ₱ 134.8 million (2020) |
| • Liabilities | ₱ 85.3 million (2020) |
| Service provider | |
| • Electricity | Eastern Samar Electric Cooperative (ESAMELCO) |
| Time zone | UTC+8 (PST) |
| ZIP code | 6803 |
| PSGC | |
| IDD : area code | +63 (0)55 |
| Native languages | Waray Tagalog |
| Website | www |
The municipality was named after Julio Aballe Llorente (1863–1940), a Cebuano Politician who was instrumental in the establishment of the American Government in Cebu. He was the 1st Governor of Cebu, who once became a Governor of Samar in the early 1900s.
Geography
Barangays
Llorente is politically subdivided into 33 barangays. [5] Each barangay consists of puroks and some have sitios.
- Antipolo
- Babanikhon
- Bacayawan
- Barobo
- Burak
- Can-ato
- Candoros
- Canliwag
- Cantomco
- Hugpa
- Maca-anga
- Magtino
- Mina-anod
- Naubay
- Piliw
- Barangay 1 (Poblacion)
- Barangay 2 (Poblacion)
- Barangay 3 (Poblacion)
- Barangay 4 (Poblacion)
- Barangay 5 (Poblacion)
- Barangay 6 (Poblacion)
- Barangay 7 (Poblacion)
- Barangay 8 (Poblacion)
- Barangay 9 (Poblacion)
- Barangay 10 (Poblacion)
- Barangay 11 (Poblacion)
- Barangay 12 (Poblacion)
- San Jose
- San Miguel
- San Roque
- So-ong
- Tabok
- Waso
Climate
| Climate data for Llorente, Eastern Samar | |||||||||||||
|---|---|---|---|---|---|---|---|---|---|---|---|---|---|
| Month | Jan | Feb | Mar | Apr | May | Jun | Jul | Aug | Sep | Oct | Nov | Dec | Year |
| Average high °C (°F) | 28 (82) |
28 (82) |
29 (84) |
30 (86) |
30 (86) |
30 (86) |
29 (84) |
30 (86) |
30 (86) |
29 (84) |
29 (84) |
28 (82) |
29 (84) |
| Average low °C (°F) | 22 (72) |
22 (72) |
22 (72) |
23 (73) |
24 (75) |
24 (75) |
24 (75) |
24 (75) |
24 (75) |
24 (75) |
23 (73) |
23 (73) |
23 (74) |
| Average precipitation mm (inches) | 90 (3.5) |
67 (2.6) |
82 (3.2) |
70 (2.8) |
97 (3.8) |
145 (5.7) |
152 (6.0) |
127 (5.0) |
132 (5.2) |
152 (6.0) |
169 (6.7) |
144 (5.7) |
1,427 (56.2) |
| Average rainy days | 17.0 | 13.5 | 16.0 | 16.5 | 20.6 | 24.3 | 26.0 | 25.4 | 25.2 | 26.4 | 23.0 | 21.1 | 255 |
| Source: Meteoblue[6] | |||||||||||||
Demographics
| Year | Pop. | ±% p.a. |
|---|---|---|
| 1903 | 5,731 | — |
| 1918 | 8,270 | +2.48% |
| 1939 | 11,570 | +1.61% |
| 1948 | 13,955 | +2.10% |
| 1960 | 13,958 | +0.00% |
| 1970 | 16,291 | +1.56% |
| 1975 | 15,639 | −0.82% |
| 1980 | 19,091 | +4.07% |
| 1990 | 18,278 | −0.43% |
| 1995 | 16,071 | −2.38% |
| 2000 | 19,336 | +4.04% |
| 2007 | 18,257 | −0.79% |
| 2010 | 19,101 | +1.66% |
| 2015 | 20,149 | +1.02% |
| 2020 | 21,459 | +1.25% |
| Source: Philippine Statistics Authority[7][8][9][10] | ||
The population of Llorente in the 2020 census was 21,459 people,[3] with a density of 43 inhabitants per square kilometre or 110 inhabitants per square mile.
Economy
References
- Municipality of Llorente | (DILG)
- "2015 Census of Population, Report No. 3 – Population, Land Area, and Population Density" (PDF). Philippine Statistics Authority. Quezon City, Philippines. August 2016. ISSN 0117-1453. Archived (PDF) from the original on May 25, 2021. Retrieved July 16, 2021.
- Census of Population (2020). "Region VIII (Eastern Visayas)". Total Population by Province, City, Municipality and Barangay. Philippine Statistics Authority. Retrieved 8 July 2021.
- "PSA Releases the 2018 Municipal and City Level Poverty Estimates". Philippine Statistics Authority. 15 December 2021. Retrieved 22 January 2022.
- "Province: Eastern Samar". PSGC Interactive. Quezon City, Philippines: Philippine Statistics Authority. Retrieved 12 November 2016.
- "Llorente, Eastern Samar : Average Temperatures and Rainfall". Meteoblue. Retrieved 31 December 2018.
- Census of Population (2015). "Region VIII (Eastern Visayas)". Total Population by Province, City, Municipality and Barangay. Philippine Statistics Authority. Retrieved 20 June 2016.
- Census of Population and Housing (2010). "Region VIII (Eastern Visayas)". Total Population by Province, City, Municipality and Barangay. National Statistics Office. Retrieved 29 June 2016.
- Censuses of Population (1903–2007). "Region VIII (Eastern Visayas)". Table 1. Population Enumerated in Various Censuses by Province/Highly Urbanized City: 1903 to 2007. National Statistics Office.
- "Province of Eastern Samar". Municipality Population Data. Local Water Utilities Administration Research Division. Retrieved 17 December 2016.
- "Poverty incidence (PI):". Philippine Statistics Authority. Retrieved December 28, 2020.
- "Estimation of Local Poverty in the Philippines" (PDF). Philippine Statistics Authority. 29 November 2005.
- "2003 City and Municipal Level Poverty Estimates" (PDF). Philippine Statistics Authority. 23 March 2009.
- "City and Municipal Level Poverty Estimates; 2006 and 2009" (PDF). Philippine Statistics Authority. 3 August 2012.
- "2012 Municipal and City Level Poverty Estimates" (PDF). Philippine Statistics Authority. 31 May 2016.
- "Municipal and City Level Small Area Poverty Estimates; 2009, 2012 and 2015". Philippine Statistics Authority. 10 July 2019.
- "PSA Releases the 2018 Municipal and City Level Poverty Estimates". Philippine Statistics Authority. 15 December 2021. Retrieved 22 January 2022.
External links
- Philippine Standard Geographic Code
- Philippine Census Information
- Local Governance Performance Management System
Places adjacent to Llorente, Eastern Samar | |
|---|---|
Borongan (capital and largest city) | |
| Municipalities | |
| Component city | |