Maslog
Maslog, officially the Municipality of Maslog (Waray: Bungto han Maslog; Tagalog: Bayan ng Maslog), is a 5th class municipality in the province of Eastern Samar, Philippines. According to the 2020 census, it has a population of 5,463 people.[3]
Maslog | |
|---|---|
| Municipality of Maslog | |
 Flag | |
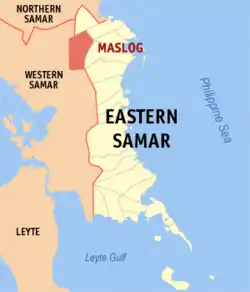 Map of Eastern Samar with Maslog highlighted | |
OpenStreetMap | |
.svg.png.webp) Maslog Location within the Philippines | |
| Coordinates: 12°09′33″N 125°14′49″E | |
| Country | Philippines |
| Region | Eastern Visayas |
| Province | Eastern Samar |
| District | Lone district |
| Barangays | 12 (see Barangays) |
| Government | |
| • Type | Sangguniang Bayan |
| • Mayor | Heraclio C. Santiago |
| • Vice Mayor | Septemio Bok C. Santiago |
| • Representative | Maria Fe R. Abunda |
| • Councilors | List |
| • Electorate | 3,535 voters (2022) |
| Area | |
| • Total | 249.8 km2 (96.4 sq mi) |
| Elevation | 73 m (240 ft) |
| Highest elevation | 329 m (1,079 ft) |
| Lowest elevation | 7 m (23 ft) |
| Population (2020 census)[3] | |
| • Total | 5,463 |
| • Density | 22/km2 (57/sq mi) |
| • Households | 1,148 |
| Economy | |
| • Income class | 5th municipal income class |
| • Poverty incidence | 73.43 |
| • Revenue | ₱ 106.8 million (2020) |
| • Assets | ₱ 188.3 million (2020) |
| • Expenditure | ₱ 84.68 million (2020) |
| • Liabilities | ₱ 29.76 million (2020) |
| Service provider | |
| • Electricity | Eastern Samar Electric Cooperative (ESAMELCO) |
| Time zone | UTC+8 (PST) |
| ZIP code | 6820 |
| PSGC | |
| IDD : area code | +63 (0)55 |
| Native languages | Waray Tagalog |
| Website | www |
Geography
Barangays
Maslog is politically subdivided into 12 barangays. [5] Each barangay consists of puroks and some have sitios.
Climate
| Climate data for Maslog, Eastern Samar | |||||||||||||
|---|---|---|---|---|---|---|---|---|---|---|---|---|---|
| Month | Jan | Feb | Mar | Apr | May | Jun | Jul | Aug | Sep | Oct | Nov | Dec | Year |
| Average high °C (°F) | 27 (81) |
27 (81) |
28 (82) |
29 (84) |
30 (86) |
30 (86) |
29 (84) |
29 (84) |
29 (84) |
29 (84) |
28 (82) |
28 (82) |
29 (83) |
| Average low °C (°F) | 22 (72) |
22 (72) |
22 (72) |
23 (73) |
24 (75) |
24 (75) |
24 (75) |
24 (75) |
24 (75) |
24 (75) |
23 (73) |
23 (73) |
23 (74) |
| Average precipitation mm (inches) | 97 (3.8) |
64 (2.5) |
69 (2.7) |
58 (2.3) |
98 (3.9) |
161 (6.3) |
167 (6.6) |
140 (5.5) |
158 (6.2) |
171 (6.7) |
169 (6.7) |
154 (6.1) |
1,506 (59.3) |
| Average rainy days | 17.1 | 13.4 | 14.8 | 15.2 | 21.1 | 25.2 | 26.8 | 25.4 | 25.5 | 26.5 | 23.0 | 20.3 | 254.3 |
| Source: Meteoblue[6] | |||||||||||||
Demographics
| Year | Pop. | ±% p.a. |
|---|---|---|
| 1918 | 408 | — |
| 1939 | 769 | +3.06% |
| 1948 | 1,131 | +4.38% |
| 1960 | 1,593 | +2.89% |
| 1970 | 1,988 | +2.24% |
| 1975 | 1,886 | −1.05% |
| 1980 | 1,956 | +0.73% |
| 1990 | 3,089 | +4.68% |
| 1995 | 3,634 | +3.09% |
| 2000 | 4,009 | +2.13% |
| 2007 | 4,788 | +2.48% |
| 2010 | 4,781 | −0.05% |
| 2015 | 5,407 | +2.37% |
| 2020 | 5,463 | +0.20% |
| Source: Philippine Statistics Authority[7][8][9][10] | ||
The population of Maslog in the 2020 census was 5,463 people,[3] with a density of 22 inhabitants per square kilometre or 57 inhabitants per square mile.
Economy
References
- Municipality of Maslog | (DILG)
- "2015 Census of Population, Report No. 3 – Population, Land Area, and Population Density" (PDF). Philippine Statistics Authority. Quezon City, Philippines. August 2016. ISSN 0117-1453. Archived (PDF) from the original on May 25, 2021. Retrieved July 16, 2021.
- Census of Population (2020). "Region VIII (Eastern Visayas)". Total Population by Province, City, Municipality and Barangay. Philippine Statistics Authority. Retrieved 8 July 2021.
- "PSA Releases the 2018 Municipal and City Level Poverty Estimates". Philippine Statistics Authority. 15 December 2021. Retrieved 22 January 2022.
- "Province: Eastern Samar". PSGC Interactive. Quezon City, Philippines: Philippine Statistics Authority. Retrieved 12 November 2016.
- "Maslog, Eastern Samar : Average Temperatures and Rainfall". Meteoblue. Retrieved 31 December 2018.
- Census of Population (2015). "Region VIII (Eastern Visayas)". Total Population by Province, City, Municipality and Barangay. Philippine Statistics Authority. Retrieved 20 June 2016.
- Census of Population and Housing (2010). "Region VIII (Eastern Visayas)". Total Population by Province, City, Municipality and Barangay. National Statistics Office. Retrieved 29 June 2016.
- Censuses of Population (1903–2007). "Region VIII (Eastern Visayas)". Table 1. Population Enumerated in Various Censuses by Province/Highly Urbanized City: 1903 to 2007. National Statistics Office.
- "Province of Eastern Samar". Municipality Population Data. Local Water Utilities Administration Research Division. Retrieved 17 December 2016.
- "Poverty incidence (PI):". Philippine Statistics Authority. Retrieved December 28, 2020.
- "Estimation of Local Poverty in the Philippines" (PDF). Philippine Statistics Authority. 29 November 2005.
- "2003 City and Municipal Level Poverty Estimates" (PDF). Philippine Statistics Authority. 23 March 2009.
- "City and Municipal Level Poverty Estimates; 2006 and 2009" (PDF). Philippine Statistics Authority. 3 August 2012.
- "2012 Municipal and City Level Poverty Estimates" (PDF). Philippine Statistics Authority. 31 May 2016.
- "Municipal and City Level Small Area Poverty Estimates; 2009, 2012 and 2015". Philippine Statistics Authority. 10 July 2019.
- "PSA Releases the 2018 Municipal and City Level Poverty Estimates". Philippine Statistics Authority. 15 December 2021. Retrieved 22 January 2022.
External links
- Philippine Standard Geographic Code
- Philippine Census Information
- Local Governance Performance Management System
Places adjacent to Maslog | |
|---|---|
Borongan (capital and largest city) | |
| Municipalities | |
| Component city | |
This article is issued from Wikipedia. The text is licensed under Creative Commons - Attribution - Sharealike. Additional terms may apply for the media files.