Mahaplag
Mahaplag (IPA: [mɐ'hɐplɐg]), officially the Municipality of Mahaplag; (Waray: Bungto han Mahaplag ; Cebuano: Dakbayan sa Mahaplag ; Tagalog: Bayan ng Mahaplag), is a 4th class municipality in the province of Leyte, Philippines. According to the 2020 census, it has a population of 27,865 people.[3]
Mahaplag | |
|---|---|
| Municipality of Mahaplag | |
 Flag | |
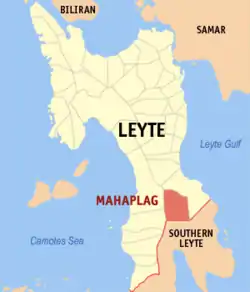 Map of Leyte with Mahaplag highlighted | |
OpenStreetMap | |
.svg.png.webp) Mahaplag Location within the Philippines | |
| Coordinates: 10°36′26″N 124°57′49″E | |
| Country | Philippines |
| Region | Eastern Visayas |
| Province | Leyte |
| District | 5th district |
| Barangays | 28 (see Barangays) |
| Government | |
| • Type | Sangguniang Bayan |
| • Mayor | Daisy A. Lleve |
| • Vice Mayor | Myra P. Solis |
| • Representative | Carl Nicolas C. Cari |
| • Councilors | List |
| • Electorate | 19,313 voters (2022) |
| Area | |
| • Total | 104.79 km2 (40.46 sq mi) |
| Elevation | 238 m (781 ft) |
| Highest elevation | 964 m (3,163 ft) |
| Lowest elevation | 6 m (20 ft) |
| Population (2020 census)[3] | |
| • Total | 27,865 |
| • Density | 270/km2 (690/sq mi) |
| • Households | 6,713 |
| Economy | |
| • Income class | 4th municipal income class |
| • Poverty incidence | 31.86 |
| • Revenue | ₱ 113.2 million (2020) |
| • Assets | ₱ 270.6 million (2020) |
| • Expenditure | ₱ 152.4 million (2020) |
| • Liabilities | ₱ 147.8 million (2020) |
| Service provider | |
| • Electricity | Don Orestes Romualdez Electric Coperative (DORELCO) |
| Time zone | UTC+8 (PST) |
| ZIP code | 6512 |
| PSGC | |
| IDD : area code | +63 (0)53 |
| Native languages | Waray Tagalog |
Geography
Barangays
Mahaplag is politically subdivided into 28 barangays. [5] Each barangay consists of puroks and some have sitios.
- Campin
- Cuatro De Agosto
- Hilusig
- Himamara
- Hinaguimitan
- Liberacion
- Mabuhay
- Mabunga
- Magsuganao
- Mahayag
- Mahayahay
- Malinao
- Malipoon
- Palanogan
- Paril
- Pinamonoan
- Poblacion
- Polahongon
- San Isidro
- San Juan
- Santa Cruz
- Tagaytay
- Uguis
- Union
- Upper Mahaplag
- Hiluctogan
- Maligaya
- Santo Niño
Climate
| Climate data for Mahaplag, Leyte | |||||||||||||
|---|---|---|---|---|---|---|---|---|---|---|---|---|---|
| Month | Jan | Feb | Mar | Apr | May | Jun | Jul | Aug | Sep | Oct | Nov | Dec | Year |
| Average high °C (°F) | 28 (82) |
28 (82) |
29 (84) |
30 (86) |
30 (86) |
29 (84) |
29 (84) |
29 (84) |
29 (84) |
29 (84) |
29 (84) |
29 (84) |
29 (84) |
| Average low °C (°F) | 22 (72) |
22 (72) |
22 (72) |
23 (73) |
24 (75) |
25 (77) |
25 (77) |
25 (77) |
25 (77) |
24 (75) |
24 (75) |
23 (73) |
24 (75) |
| Average precipitation mm (inches) | 78 (3.1) |
57 (2.2) |
84 (3.3) |
79 (3.1) |
118 (4.6) |
181 (7.1) |
178 (7.0) |
169 (6.7) |
172 (6.8) |
180 (7.1) |
174 (6.9) |
128 (5.0) |
1,598 (62.9) |
| Average rainy days | 16.7 | 13.8 | 17.3 | 18.5 | 23.2 | 26.5 | 27.1 | 26.0 | 26.4 | 27.5 | 24.6 | 21.0 | 268.6 |
| Source: Meteoblue[6] | |||||||||||||
Demographics
|
| |||||||||||||||||||||||||||||||||||||||
| Source: Philippine Statistics Authority [7][8][9][10] | ||||||||||||||||||||||||||||||||||||||||
In the 2020 census, the population of Mahaplag was 27,865 people,[3] with a density of 270 inhabitants per square kilometre or 700 inhabitants per square mile.
Economy
References
- Municipality of Mahaplag | (DILG)
- "2015 Census of Population, Report No. 3 – Population, Land Area, and Population Density" (PDF). Philippine Statistics Authority. Quezon City, Philippines. August 2016. ISSN 0117-1453. Archived (PDF) from the original on May 25, 2021. Retrieved July 16, 2021.
- Census of Population (2020). "Region VIII (Eastern Visayas)". Total Population by Province, City, Municipality and Barangay. Philippine Statistics Authority. Retrieved 8 July 2021.
- "PSA Releases the 2018 Municipal and City Level Poverty Estimates". Philippine Statistics Authority. 15 December 2021. Retrieved 22 January 2022.
- "Province:". PSGC Interactive. Quezon City, Philippines: Philippine Statistics Authority. Retrieved 12 November 2016.
- "Mahaplag: Average Temperatures and Rainfall". Meteoblue. Retrieved 29 February 2020.
- Census of Population (2015). "Region VIII (Eastern Visayas)". Total Population by Province, City, Municipality and Barangay. Philippine Statistics Authority. Retrieved 20 June 2016.
- Census of Population and Housing (2010). "Region VIII (Eastern Visayas)". Total Population by Province, City, Municipality and Barangay. National Statistics Office. Retrieved 29 June 2016.
- Censuses of Population (1903–2007). "Region VIII (Eastern Visayas)". Table 1. Population Enumerated in Various Censuses by Province/Highly Urbanized City: 1903 to 2007. National Statistics Office.
- "Province of". Municipality Population Data. Local Water Utilities Administration Research Division. Retrieved 17 December 2016.
- "Poverty incidence (PI):". Philippine Statistics Authority. Retrieved December 28, 2020.
- "Estimation of Local Poverty in the Philippines" (PDF). Philippine Statistics Authority. 29 November 2005.
- "2003 City and Municipal Level Poverty Estimates" (PDF). Philippine Statistics Authority. 23 March 2009.
- "City and Municipal Level Poverty Estimates; 2006 and 2009" (PDF). Philippine Statistics Authority. 3 August 2012.
- "2012 Municipal and City Level Poverty Estimates" (PDF). Philippine Statistics Authority. 31 May 2016.
- "Municipal and City Level Small Area Poverty Estimates; 2009, 2012 and 2015". Philippine Statistics Authority. 10 July 2019.
- "PSA Releases the 2018 Municipal and City Level Poverty Estimates". Philippine Statistics Authority. 15 December 2021. Retrieved 22 January 2022.
External links
- Philippine Standard Geographic Code
- Philippine Census Information
- Local Governance Performance Management System
Places adjacent to Mahaplag | ||||||||||||||||
|---|---|---|---|---|---|---|---|---|---|---|---|---|---|---|---|---|
| ||||||||||||||||
Tacloban (capital and largest city) | |
| Municipalities |
|
| Component city | |
| Independent component city |
|
| Highly urbanized city |
|
This article is issued from Wikipedia. The text is licensed under Creative Commons - Attribution - Sharealike. Additional terms may apply for the media files.