Maubourguet
Maubourguet (pronounced [mobuʁɡɛ]; Gascon: Mauborguet) is a commune in the Hautes-Pyrénées department in south-western France, in the Occitanie region.
Maubourguet | |
|---|---|
 The town hall of Maubourguet | |
.svg.png.webp) Coat of arms | |
Location of Maubourguet | |
 Maubourguet 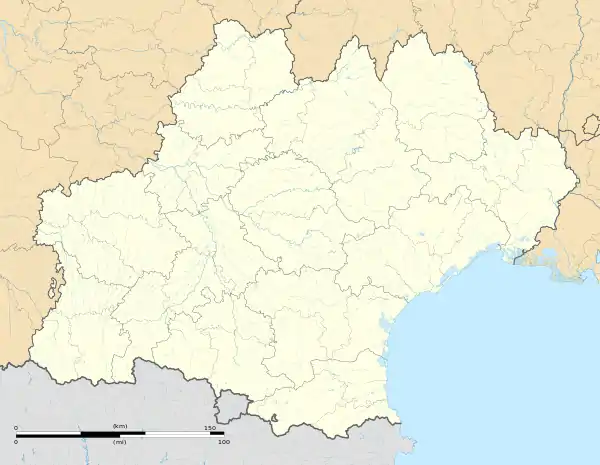 Maubourguet | |
| Coordinates: 43°28′09″N 0°02′11″E | |
| Country | France |
| Region | Occitania |
| Department | Hautes-Pyrénées |
| Arrondissement | Tarbes |
| Canton | Val d'Adour-Rustan-Madiranais |
| Intercommunality | Adour Madiran |
| Government | |
| • Mayor (2020–2026) | Jean Nadal[1] |
| Area 1 | 22.04 km2 (8.51 sq mi) |
| Population | 2,254 |
| • Density | 100/km2 (260/sq mi) |
| Time zone | UTC+01:00 (CET) |
| • Summer (DST) | UTC+02:00 (CEST) |
| INSEE/Postal code | 65304 /65700 |
| Elevation | 164–285 m (538–935 ft) (avg. 181 m or 594 ft) |
| 1 French Land Register data, which excludes lakes, ponds, glaciers > 1 km2 (0.386 sq mi or 247 acres) and river estuaries. | |
Historically, Maubourguet belonged to the County of Bigorre. The town is situated at the crossing of two major roads, Auch-Pau and Bordeaux-Tarbes.
Geography
Maubourguet is situated in Occitanie, in the north of the Hautes-Pyrénées department. It is mainly located on the shores of the Adour river.
The town is located 625 km (as the crow flies) southwest of the French capital, Paris, 115 km southwest of the regional capital, Toulouse and 26.2 km north-west of the prefecture of the department, Tarbes.
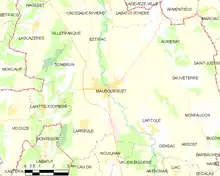
Communal boundaries
Maubourguet borders on nine different communes.
To the north: Estirac and Sombrun
To the east: Auriébat, Sauveterre and Lafitole
To the south: Vic-en-Bigorre, Nouilhan and Larreule
To the west: Lahitte-Toupière
Topography and Geology
Maubourguet is located south of the Aquitaine Basin, a vast sedimentary geological region of the south-west of France, close to the Pyrénées, and in the valley of the Adour, before its bend towards the Atlantic.
The territory of Maubourguet extends over 22.04 km2; its elevation varies between 164 and 285 meters. The highest point of the commune is in the west, on the hills overlooking the plain of the Adour. The minimum elevation is at the level of the Adour when it leaves the territory in the north.
Climate
Maubourguet has a oceanic climate (Köppen climate classification Cfb) closely bordering on a humid subtropical climate (Cfa). The average annual temperature in Maubourguet is 13.5 °C (56.3 °F). The average annual rainfall is 904.3 mm (35.60 in) with November as the wettest month. The temperatures are highest on average in August, at around 21.6 °C (70.9 °F), and lowest in January, at around 5.9 °C (42.6 °F). The highest temperature ever recorded in Maubourguet was 44.0 °C (111.2 °F) on 11 August 1947; the coldest temperature ever recorded was −15.5 °C (4.1 °F) on 21 February 1956.
| Climate data for Maubourguet (1991−2020 normals, extremes 1886−present) | |||||||||||||
|---|---|---|---|---|---|---|---|---|---|---|---|---|---|
| Month | Jan | Feb | Mar | Apr | May | Jun | Jul | Aug | Sep | Oct | Nov | Dec | Year |
| Record high °C (°F) | 23.2 (73.8) |
26.9 (80.4) |
30.5 (86.9) |
34.5 (94.1) |
37.0 (98.6) |
42.2 (108.0) |
42.9 (109.2) |
44.0 (111.2) |
39.7 (103.5) |
35.5 (95.9) |
28.2 (82.8) |
23.4 (74.1) |
44.0 (111.2) |
| Average high °C (°F) | 10.8 (51.4) |
12.4 (54.3) |
15.9 (60.6) |
18.3 (64.9) |
22.0 (71.6) |
25.7 (78.3) |
27.9 (82.2) |
28.2 (82.8) |
25.2 (77.4) |
20.6 (69.1) |
14.4 (57.9) |
11.4 (52.5) |
19.4 (66.9) |
| Daily mean °C (°F) | 5.9 (42.6) |
6.8 (44.2) |
10.0 (50.0) |
12.5 (54.5) |
16.2 (61.2) |
19.7 (67.5) |
21.5 (70.7) |
21.6 (70.9) |
18.3 (64.9) |
14.3 (57.7) |
9.2 (48.6) |
6.4 (43.5) |
13.5 (56.3) |
| Average low °C (°F) | 1.1 (34.0) |
1.3 (34.3) |
4.0 (39.2) |
6.6 (43.9) |
10.4 (50.7) |
13.6 (56.5) |
15.2 (59.4) |
15.0 (59.0) |
11.5 (52.7) |
8.1 (46.6) |
4.0 (39.2) |
1.5 (34.7) |
7.7 (45.9) |
| Record low °C (°F) | −15.1 (4.8) |
−15.5 (4.1) |
−9.6 (14.7) |
−3.9 (25.0) |
−0.9 (30.4) |
3.1 (37.6) |
6.2 (43.2) |
3.4 (38.1) |
0.0 (32.0) |
−4.2 (24.4) |
−11.0 (12.2) |
−13.0 (8.6) |
−15.5 (4.1) |
| Average precipitation mm (inches) | 87.2 (3.43) |
69.7 (2.74) |
75.2 (2.96) |
86.8 (3.42) |
89.1 (3.51) |
69.8 (2.75) |
59.4 (2.34) |
55.8 (2.20) |
61.6 (2.43) |
67.7 (2.67) |
99.6 (3.92) |
82.4 (3.24) |
904.3 (35.60) |
| Average precipitation days (≥ 1.0 mm) | 11.4 | 10.0 | 10.0 | 11.1 | 11.1 | 8.5 | 7.5 | 7.3 | 8.0 | 9.4 | 11.8 | 10.7 | 116.8 |
| Source: Météo-France[3] | |||||||||||||
Population
| Year | Pop. | ±% p.a. |
|---|---|---|
| 1968 | 2,479 | — |
| 1975 | 2,583 | +0.59% |
| 1982 | 2,573 | −0.06% |
| 1990 | 2,472 | −0.50% |
| 1999 | 2,412 | −0.27% |
| 2007 | 2,506 | +0.48% |
| 2012 | 2,441 | −0.52% |
| 2017 | 2,377 | −0.53% |
| Source: INSEE[4] | ||
References
- "Répertoire national des élus: les maires" (in French). data.gouv.fr, Plateforme ouverte des données publiques françaises. 13 September 2022.
- "Populations légales 2020". The National Institute of Statistics and Economic Studies. 29 December 2022.
- "Fiche Climatologique Statistiques 1991-2020 et records" (PDF) (in French). Météo-France. Retrieved September 12, 2022.
- Population en historique depuis 1968, INSEE
External links