1998 Minnesota gubernatorial election
The 1998 Minnesota gubernatorial election took place on November 3, 1998. Reform Party candidate Jesse Ventura defeated Republican Party challenger Norm Coleman and Minnesota Democratic–Farmer–Labor Party challenger Hubert H. "Skip" Humphrey III. Ventura governed with a DFL-controlled state Senate and a Republican-controlled state House. As of 2023, this is the only time that a Reform Party candidate has been elected to Statewide office.
| |||||||||||||||||||||||||
| |||||||||||||||||||||||||
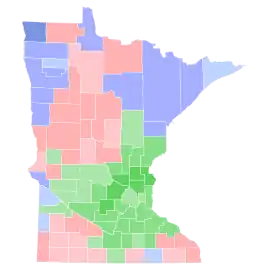
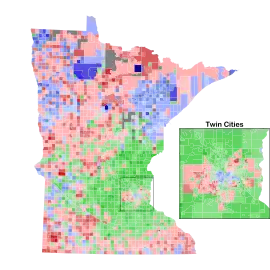
  Ventura: 30–40% 40–50% 50–60% 60–70% 70–80% >90% Coleman: 30–40% 40–50% 50–60% 60–70% 70–80% 80–90% >90% Humphrey: 30–40% 40–50% 50–60% 60–70% 70–80% 80–90% >90% Other: 40–50% 60–70% Tie: 30–40% 40–50% 50% No votes | |||||||||||||||||||||||||
| |||||||||||||||||||||||||
| Elections in Minnesota |
|---|
 |
Ventura's victory as a third-party candidate was considered a historic major upset. He ran on the Reform Party ticket, a party which had been founded by two-time presidential candidate Ross Perot who had received 24% of the vote in Minnesota in the 1992 presidential election and 12% in the 1996 election.[1]
Candidates
DFL
- Skip Humphrey: Attorney General of Minnesota and son of former Vice President Hubert Humphrey and former U.S. Senator Muriel Humphrey.
- Ted Mondale: Minnesota State Senator and son of former Vice President Walter Mondale.
- Mike Freeman: Hennepin County Attorney and son of Orville Freeman who was the former Governor of Minnesota and United States Secretary of Agriculture.
- Doug Johnson: Minnesota State Senator
- Mark Dayton: State Auditor and heir to the Dayton's fortune.[2]
Republican
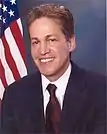
- Norm Coleman: Won the Republican nomination for governor, by winning the primary with token opposition.[3] He was the Mayor of St. Paul. He was elected mayor in 1993 as a Democrat with almost 55% of the vote. In 1996, he switched parties to become a Republican after years of heat from his party.[4] He won re-election as mayor in the heavily liberal city (70% registered Democrats) with almost 59% of the vote in 1997.
- Bill Dahn: Retired auto mechanic, around the same age as Coleman.[5]
Reform
- Jesse Ventura: Won the Reform Party nomination with no opposition. He was elected mayor in 1990 of Brooklyn Park, Minnesota, a city with a population of over 70,000.
Other third-parties
- Ken Pentel of the Green Party
- Frank Germann of the Libertarian Party
- Chris Wright Grassroots Party
- "Fancy" Ray McCloney, "People's Champion"
- Thomas Fiske of the Socialist Workers Party
Primary results (September 15)
DFL
| Party | Candidate | Votes | % | |
|---|---|---|---|---|
| Democratic (DFL) | Skip Humphrey | 154,037 | 37 | |
| Democratic (DFL) | Mike Freeman | 78,895 | 19 | |
| Democratic (DFL) | Doug Johnson | 78,041 | 19 | |
| Democratic (DFL) | Mark Dayton | 74,706 | 18 | |
| Democratic (DFL) | Ted Mondale | 29,749 | 7 | |
| Invalid or blank votes | ||||
| Total votes | 415,428 | 100 | ||
| Turnout | ||||
Republican
| Party | Candidate | Votes | % | |
|---|---|---|---|---|
| Republican | Norm Coleman | 107,989 | 91 | |
| Republican | Bill Dahn | 10,505 | 9 | |
| Invalid or blank votes | ||||
| Total votes | 118,494 | 100 | ||
| Turnout | ||||
General election
Campaign
Ventura spent around $300,000 and combined it with an aggressive grassroots campaign that featured a statewide bus tour, pioneered use of the Internet for political purposes, and aired quirky TV ads designed by Bill Hillsman, who forged the phrase "Don't vote for politics as usual."[6] Unable to afford many television ads, Ventura mainly focused on televised debates and public appearances, preaching his brand of libertarian politics. His speech at a parade in rural Minnesota during the summer attracted what organizers of the annual event described as one of its largest audiences. He ran on cutting taxes, reducing state government, and reducing public school classroom sizes to a 17 to 1 ratio. He also supported a public debate on the viability of legalized prostitution.[7]
Polling
A poll taken in June showed that Coleman would defeat any other Democratic candidate than Humphrey; Humphrey would defeat Coleman 44% to 34%. However, Ventura polled in the double digits. No other candidate in the Reform Party's brief history in Minnesota has received more than 5 percent of the votes in a statewide election.[8] Following the primary election in September, a poll on October 20 showed Humphrey leading 35% to Coleman (34%) and Ventura (21%). But the Star Tribune poll suggested that Ventura's surge with the voters had come mostly at Humphrey's expense. Since the primary, Humphrey's support among likely voters had dropped by 14 percentage points, while Coleman's had increased by 5 percentage points.[9]
Results


| Party | Candidate | Votes | % | ±% | |
|---|---|---|---|---|---|
| Reform | Jesse Ventura | 773,713 | 36.99% | New | |
| Republican | Norm Coleman | 717,350 | 34.29% | -29.04% | |
| Democratic (DFL) | Skip Humphrey | 587,528 | 28.09% | -6.02% | |
| Green | Ken Pentel | 7,034 | 0.34% | n/a | |
| Libertarian | Frank Germann | 1,932 | 0.09% | -0.80% | |
| Grassroots | Chris Wright | 1,727 | 0.08% | -1.12% | |
| People's Champion | Fancy Ray McCloney | 919 | 0.04% | n/a | |
| Socialist Workers | Thomas Fiske | 787 | 0.04% | -0.14% | |
| Write-ins | 776 | n/a | |||
| Majority | 56,363 | 2.69% | |||
| Turnout | 2,091,766 | 60% | |||
| Reform gain from Republican | Swing | ||||
Results Breakdown
| County | Coleman | Votes | Humphrey | Votes | Ventura | Votes | Others | Votes |
|---|---|---|---|---|---|---|---|---|
| Aitkin | 31.6% | 2,447 | 30.3% | 2,347 | 37.4% | 2,897 | 0.6% | 47 |
| Anoka | 29.3% | 37,111 | 19.7% | 24,975 | 50.7% | 64,100 | 0.3% | 363 |
| Becker | 41.4% | 5,030 | 35.7% | 4,349 | 22.4% | 2,721 | 0.5% | 62 |
| Beltrami | 39.8% | 5,872 | 35.9% | 5,289 | 23.0% | 3,387 | 1.3% | 195 |
| Benton | 33.2% | 4,388 | 20.8% | 2,750 | 45.6% | 6,027 | 0.4% | 47 |
| Big Stone | 31.9% | 912 | 40.0% | 1,144 | 27.5% | 786 | 0.5% | 15 |
| Blue Earth | 30.9% | 7,031 | 24.9% | 5,666 | 43.8% | 9,973 | 0.6% | 111 |
| Brown | 45.2% | 5,150 | 21.2% | 2,417 | 33.3% | 3,794 | 0.4% | 44 |
| Carlton | 31.0% | 3,929 | 42.9% | 5,439 | 25.5% | 3,226 | 0.6% | 70 |
| Carver | 39.9% | 11,479 | 16.1% | 4,621 | 43.8% | 12,606 | 0.3% | 88 |
| Cass | 32.0% | 4,781 | 28.1% | 3,288 | 28.7% | 3,268 | 0.5% | 55 |
| Chippewa | 28.3% | 1,721 | 34.0% | 2,064 | 37.4% | 2,271 | 0.3% | 19 |
| Chisago | 28.0% | 5,376 | 18.9% | 3,621 | 52.8% | 10,138 | 0.4% | 71 |
| Clay | 34.7% | 6,200 | 43.5% | 7,766 | 21.8% | 3,797 | 0.5% | 91 |
| Clearwater | 44.8% | 1,439 | 35.0% | 1,124 | 19.5% | 625 | 0.7% | 24 |
| Cook | 38.6% | 1,010 | 39.6% | 1,046 | 18.0% | 474 | 3.8% | 100 |
| Cottonwood | 39.6% | 2,420 | 30.8% | 1,884 | 29.2% | 1,788 | 0.5% | 29 |
| Crow Wing | 39.7% | 9,559 | 26.0% | 6,257 | 33.9% | 8,162 | 0.4% | 104 |
| Dakota | 37.3% | 56,242 | 22.0% | 33,253 | 40.4% | 60,909 | 0.3% | 484 |
| Dodge | 37.4% | 2,619 | 21.2% | 1,484 | 41.0% | 2,867 | 0.4% | 27 |
| Douglas | 42.1% | 6,323 | 23.3% | 3,503 | 34.3% | 5,162 | 0.3% | 41 |
| Faribault | 34.2% | 2,778 | 29.3% | 2,382 | 36.0% | 2,923 | 0.4% | 34 |
| Fillmore | 39.7% | 3,359 | 33.4% | 2,823 | 26.2% | 2,219 | 0.7% | 56 |
| Freeborn | 39.5% | 5,463 | 33.3% | 4,605 | 26.9% | 3,706 | 0.5% | 65 |
| Goodhue | 33.9% | 6,786 | 22.7% | 4,547 | 43.0% | 8,610 | 0.5% | 92 |
| Grant | 30.6% | 1,055 | 31.6% | 1,089 | 37.5% | 1,294 | 0.3% | 10 |
| Hennepin | 31.9% | 155,311 | 30.2% | 147,059 | 36.9% | 179,954 | 1.0% | 4,778 |
| Houston | 48.8% | 3,616 | 37.7% | 2,797 | 12.0% | 891 | 1.5% | 111 |
| Hubbard | 42.6% | 3,697 | 30.1% | 2,609 | 26.7% | 2,317 | 0.7% | 57 |
| Isanti | 27.3% | 3,719 | 19.6% | 2,665 | 52.9% | 7,209 | 0.3% | 36 |
| Itasca | 37.8% | 7,181 | 41.6% | 7,911 | 19.8% | 3,768 | 0.8% | 143 |
| Jackson | 34.9% | 1,796 | 33.5% | 1,728 | 31.1% | 1,605 | 0.5% | 24 |
| Kanabec | 29.0% | 1,895 | 21.1% | 1,374 | 49.6% | 3,238 | 0.3% | 17 |
| Kandiyohi | 34.5% | 6,287 | 29.3% | 5,337 | 35.9% | 6,530 | 0.2% | 45 |
| Kittson | 32.2% | 757 | 50.3% | 1,185 | 16.5% | 389 | 1.0% | 23 |
| Koochiching | 46.4% | 2,721 | 34.9% | 2,347 | 18.1% | 1,064 | 0.56% | 31 |
| Lac Qui | 27.6% | 1,133 | 39.5% | 1,621 | 32.4% | 1,330 | 0.4% | 16 |
| Lake | 30.1% | 1,766 | 42.2% | 2,472 | 26.4% | 1,545 | 1.3% | 75 |
| LOTW | 41.5% | 837 | 42.2% | 852 | 14.3% | 288 | 2.1% | 41 |
| Le Sueur | 30.4% | 3,582 | 22.2% | 2,614 | 47.1% | 5,551 | 0.3% | 35 |
| Lincoln | 36.4% | 1,129 | 36.7% | 1,136 | 26.3% | 815 | 0.6% | 18 |
| Lyon | 39.1% | 4,043 | 28.7% | 2,966 | 31.7% | 3,277 | 0.6% | 66 |
| McLeod | 30.9% | 4,754 | 15.9% | 2,449 | 52.8% | 8,126 | 0.3% | 50 |
| Mahnomen | 41.8% | 821 | 36.5% | 716 | 20.7% | 406 | 1.1% | 21 |
| Marshall | 40.5% | 1,959 | 41.5% | 2,008 | 17.2% | 834 | 0.8% | 38 |
| Martin | 38.8% | 3,676 | 26.7% | 2,534 | 34.2% | 3,243 | 0.2% | 23 |
| Meeker | 31.3% | 3,320 | 19.7% | 2,083 | 48.6% | 5,153 | 0.4% | 39 |
| Mille Lacs | 31.0% | 2,898 | 21.4% | 1,998 | 47.2% | 4,404 | 0.4% | 39 |
| Morrison | 40.6% | 5,377 | 21.9% | 2,899 | 37.0% | 4,905 | 0.6% | 78 |
| Mower | 34.9% | 5,529 | 39.3% | 6,234 | 25.2% | 3,990 | 0.7% | 111 |
| Murray | 38.7% | 1,819 | 34.5% | 1,620 | 26.2% | 1,233 | 0.6% | 30 |
| Nicollet | 33.2% | 4,345 | 25.9% | 3,384 | 40.3% | 5,272 | 0.6% | 78 |
| Nobles | 39.0% | 3,265 | 31.8% | 2,664 | 28.7% | 2,404 | 0.4% | 34 |
| Norman | 31.4% | 1,024 | 49.7% | 1,621 | 18.3% | 596 | 0.6% | 19 |
| Olmsted | 42.7% | 19,480 | 26.8% | 12,205 | 30.1% | 13,710 | 0.4% | 199 |
| Otter Tail | 45.0% | 10,785 | 29.1% | 6,982 | 25.3% | 6,069 | 0.5% | 116 |
| Pennington | 38.8% | 2,226 | 39.3% | 2,253 | 21.4% | 1,226 | 0.6% | 35 |
| Pine | 26.9% | 2,869 | 25.6% | 2,730 | 47.1% | 5,027 | 0.4% | 48 |
| Pipestone | 46.8% | 2,127 | 35.7% | 1,621 | 16.6% | 752 | 0.9% | 43 |
| Polk | 40.7% | 4,462 | 43.5% | 2,347 | 15.5% | 1,699 | 0.4% | 44 |
| Pope | 33.6% | 1,954 | 32.9% | 1,738 | 36.1% | 2,099 | 0.3% | 17 |
| Ramsey | 32.4% | 69,240 | 32.1% | 68,619 | 34.6% | 73,993 | 0.8% | 1,714 |
| Red Lake | 39.6% | 842 | 43.3% | 920 | 16.0% | 339 | 1.1% | 24 |
| Redwood | 42.8% | 3,140 | 22.5% | 1,654 | 34.5% | 2,533 | 0.2% | 17 |
| Renville | 30.7% | 2,514 | 25.4% | 2,079 | 43.7% | 3,583 | 0.3% | 24 |
| Rice | 29.7% | 6,732 | 28.5% | 6,518 | 41.3% | 9,444 | 0.7% | 170 |
| Rock | 47.7% | 1,832 | 36.1% | 1,384 | 15.5% | 596 | 0.7% | 25 |
| Roseau | 49.8% | 2,975 | 31.2% | 1,863 | 18.1% | 1,081 | 1.0% | 57 |
| St. Louis | 28.1% | 24,439 | 47.3% | 41,208 | 23.8% | 20,682 | 0.8% | 17 |
| Scott | 34.9% | 12,075 | 16.7% | 5,787 | 48.1% | 16,612 | 0.3% | 97 |
| Sherburne | 32.1% | 8,139 | 16.4% | 4,163 | 51.2% | 13,004 | 0.3% | 73 |
| Sibley | 32.1% | 2,261 | 17.9% | 1,262 | 49.7% | 3,497 | 0.3% | 24 |
| Stearns | 38.5% | 20,731 | 21.7% | 11,696 | 39.2% | 21,116 | 0.6% | 320 |
| Steele | 38.5% | 5,399 | 21.6% | 3,022 | 39.7% | 5,559 | 0.3% | 37 |
| Stevens | 40.7% | 2,052 | 29.9% | 1,507 | 28.9% | 1,455 | 0.5% | 25 |
| Swift | 26.7% | 1,410 | 35.1% | 1,852 | 38.0% | 2,006 | 0.2% | 11 |
| Todd | 39.3% | 4,293 | 22.4% | 2,426 | 37.9% | 4,146 | 0.5% | 60 |
| Traverse | 34.3% | 733 | 33.7% | 733 | 31.5% | 674 | 0.7% | 14 |
| Wabasha | 35.8% | 3,363 | 23.6% | 2,221 | 40.2% | 3,776 | 0.4% | 41 |
| Wadena | 43.1% | 2,563 | 25.9% | 1,537 | 30.3% | 1,782 | 1.1% | 63 |
| Waseca | 35.8% | 3,064 | 22.3% | 1,904 | 41.4% | 3,543 | 0.5% | 42 |
| Washington | 35.8% | 32,565 | 22.2% | 20,205 | 41.7% | 37,910 | 0.3% | 300 |
| Watonwan | 33.4% | 1,711 | 27.9% | 1,429 | 38.3% | 1,965 | 0.4% | 19 |
| Wilkin | 43.2% | 1,181 | 32.6% | 892 | 23.4% | 639 | 0.8% | 22 |
| Winona | 42.9% | 7,856 | 33.7% | 6,176 | 22.1% | 4,039 | 1.3% | 235 |
| Wright | 32.1% | 11,957 | 16.2% | 6,027 | 51.4% | 19,124 | 0.3% | 106 |
| Yellow | 29.8% | 1,628 | 33.7% | 1,838 | 36.0% | 1,966 | 0.5% | 25 |
| Totals | 34.29% | 717,350 | 28.09% | 587,528 | 36.99% | 773,713 | 0.63% | 13,175 |
References
- "A 'Bad Boy' Wrestler's Unscripted Upset". The New York Times. November 5, 1998.
- "Three famous sons and heir to a fortune battle in governor's race". Minnesota Daily. Retrieved August 27, 2022.
- "COLEMAN: AFTER AN EASY PRIMARY SEASON, GOP NOMINEE HAS TO GET DOWN TO BUSINESS".
- "Speculation Follows St. Paul Mayor's Switch to Republicans". The New York Times. December 20, 1996.
- "Minnesota primary results - September 15, 1998". CNN.
- "Brian Howey: Time to Take Over the Indiana Libertarian Party | Howey Politics Indiana". Archived from the original on August 18, 2009. Retrieved June 26, 2009.
- "Washingtonpost.com: 'The Body' Slams Into Politics". The Washington Post.
- "Minnesota Poll: Humphrey holds lead in primary and general election races | StarTribune.com". Star Tribune. Archived from the original on June 7, 2011. Retrieved July 19, 2009.
- "NEW POLL: HUMPHREY, COLEMAN IN DEAD HEAT".
- Leip, David. "Dave Leip's Atlas of U.S. Presidential Elections".
- "Archived copy" (PDF). Archived from the original (PDF) on November 27, 2008. Retrieved January 11, 2009.
{{cite web}}: CS1 maint: archived copy as title (link)
.jpg.webp)

.jpg.webp)