Mississauga—Malton
Mississauga—Malton is a federal electoral district in Ontario. It encompasses a portion of Ontario previously included in the electoral districts of Bramalea—Gore—Malton, Mississauga—Brampton South and Mississauga—Streetsville.[3]
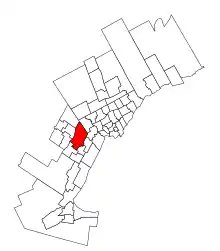 Mississauga—Malton in relation to other Greater Toronto Area districts | |||
| Federal electoral district | |||
| Legislature | House of Commons | ||
| MP |
Liberal | ||
| District created | 2013 | ||
| First contested | 2015 | ||
| Last contested | 2021 | ||
| District webpage | profile, map | ||
| Demographics | |||
| Population (2016)[1] | 118,240 | ||
| Electors (2015) | 73,591 | ||
| Area (km²)[2] | 102 | ||
| Pop. density (per km²) | 1,159.2 | ||
| Census division(s) | Peel | ||
| Census subdivision(s) | Mississauga | ||
Mississauga—Malton was created by the 2012 federal electoral boundaries redistribution and was legally defined in the 2013 representation order. It came into effect upon the call of the 42nd Canadian federal election, scheduled for October 2015.[4]
Demographics
According to the 2021 Canada Census[5]
Ethnic groups: 42.8% South Asian, 18.4% White, 11.0% Black, 5.6% Chinese, 5.5% Filipino, 3.8% Arab, 3.6% Southeast Asian, 2.1% Latin American, 1.0% West Asian
Languages: 39.0% English, 10.2% Punjabi, 5.8% Urdu, 2.8% Arabic, 2.8% Tagalog, 2.6% Hindi, 2.4% Vietnamese, 2.4% Tamil, 2.3% Gujarati, 2.1% Cantonese, 2.0% Mandarin, 1.7% Spanish, 1.6% Italian, 1.5% Portuguese, 1.5% Polish
Religions: 40.2% Christian (23.6% Catholic, 2.0% Christian Orthodox, 1.8% Pentecostal, 1.0% Anglican, 11.8% Other), 17.1% Muslim, 14.8% Hindu, 12.0% Sikh, 2.9% Buddhist, 12.3% None
Median income: $34,800 (2020)
Average income: $44,920 (2020)
Members of Parliament
This riding has elected the following Members of Parliament:
| Parliament | Years | Member | Party | |
|---|---|---|---|---|
| Mississauga—Malton Riding created from Bramalea—Gore—Malton, Mississauga—Brampton South and Mississauga—Streetsville |
||||
| 42nd | 2015–2019 | Navdeep Bains | Liberal | |
| 43rd | 2019–2021 | |||
| 44th | 2021–present | Iqwinder Gaheer | ||
Election results
| 2021 Canadian federal election | ||||||||
|---|---|---|---|---|---|---|---|---|
| Party | Candidate | Votes | % | ±% | Expenditures | |||
| Liberal | Iqwinder Gaheer | 21,766 | 52.8 | -4.7 | $75,599.65 | |||
| Conservative | Clyde Roach | 12,625 | 30.6 | +4.8 | $36,598.37 | |||
| New Democratic | Waseem Ahmed | 5,771 | 14.0 | +1.4 | $36,233.25 | |||
| Green | Mark Davidson | 811 | 2.0 | -0.6 | $0.00 | |||
| Marxist–Leninist | Frank Chilelli | 275 | 0.7 | +0.5 | $0.00 | |||
| Total valid votes/Expense limit | 41,248 | – | – | $109,482.72 | ||||
| Total rejected ballots | 435 | |||||||
| Turnout | 41,683 | 54.1 | ||||||
| Eligible voters | 77,095 | |||||||
| Liberal hold | Swing | -4.7 | ||||||
| Source: Elections Canada[6] | ||||||||
| 2019 Canadian federal election | ||||||||
|---|---|---|---|---|---|---|---|---|
| Party | Candidate | Votes | % | ±% | Expenditures | |||
| Liberal | Navdeep Bains | 27,890 | 57.5 | -1.62 | $76,024.88 | |||
| Conservative | Tom Varughese | 12,528 | 25.8 | -0.64 | $86,705.72 | |||
| New Democratic | Nikki Clarke | 6,103 | 12.6 | +0.29 | $12,952.47 | |||
| Green | Christina Porter | 1,251 | 2.6 | +0.93 | $4.98 | |||
| People's | Tahir Gora | 369 | 0.8 | none listed | ||||
| United | Prudence Buchanan | 306 | 0.6 | $0.00 | ||||
| Marxist–Leninist | Frank Chilelli | 90 | 0.2 | $0.00 | ||||
| Total valid votes/expense limit | 48,537 | 100.0 | ||||||
| Total rejected ballots | 500 | |||||||
| Turnout | 49,037 | 62.0 | ||||||
| Eligible voters | 79,034 | |||||||
| Liberal hold | Swing | -0.49 | ||||||
| Source: Elections Canada[7][8] | ||||||||
| 2015 Canadian federal election | ||||||||
|---|---|---|---|---|---|---|---|---|
| Party | Candidate | Votes | % | ±% | Expenditures | |||
| Liberal | Navdeep Bains | 26,165 | 59.12 | +22.33 | $103,144.90 | |||
| Conservative | Jagdish Grewal[9] | 11,701 | 26.44 | -11.00 | $126,893.52 | |||
| New Democratic | Dianne Douglas | 5,450 | 12.31 | -11.12 | $5,226.05 | |||
| Green | Heather Mercer | 737 | 1.67 | -0.37 | – | |||
| Independent | Naresh Tharani | 210 | 0.46 | – | $8,153.79 | |||
| Total valid votes/Expense limit | 44,256 | 100.00 | $207,082.35 | |||||
| Total rejected ballots | 237 | 0.53 | – | |||||
| Turnout | 44,493 | 59.76 | – | |||||
| Eligible voters | 74,448 | |||||||
| Liberal notional gain from Conservative | Swing | +16.67 | ||||||
| Source: Elections Canada[10][11] | ||||||||
| 2011 federal election redistributed results[12] | |||
|---|---|---|---|
| Party | Vote | % | |
| Conservative | 13,715 | 37.44 | |
| Liberal | 13,477 | 36.79 | |
| New Democratic | 8,584 | 23.43 | |
| Green | 744 | 2.03 | |
| Others | 113 | 0.31 | |
References
- Statistics Canada: 2016
- Statistics Canada: 2016
- Final Report – Ontario
- Timeline for the Redistribution of Federal Electoral Districts
- Government of Canada, Statistics Canada (February 9, 2022). "Profile table, Census Profile, 2021 Census of Population - Mississauga--Malton [Federal electoral district (2013 Representation Order)], Ontario". www12.statcan.gc.ca. Retrieved March 8, 2023.
- "List of confirmed candidates – September 20, 2021 Federal Election". Elections Canada. Retrieved September 2, 2021.
- "List of confirmed candidates". Elections Canada. Retrieved October 4, 2019.
- "Election Night Results". Elections Canada. Retrieved November 4, 2019.
- The Conservative Party dropped Grewal after an editorial he wrote was criticized. His name still appeared on the ballot. Jennifer Ditchburn (October 6, 2015). "Tories dump candidate who touts therapies to turn gay youth straight". CBC News. Retrieved October 6, 2015.
- Elections Canada – Confirmed candidates for Mississauga—Malton, 30 September 2015
- Elections Canada – Preliminary Election Expenses Limits for Candidates Archived 2016-03-04 at the Wayback Machine
- Pundits' Guide to Canadian Elections