New Jersey's 3rd congressional district
New Jersey's 3rd congressional district is represented by Democrat Andy Kim of Moorestown[4] who has served in Congress since 2019.
| New Jersey's 3rd congressional district | |||
|---|---|---|---|
Interactive map of district boundaries since January 3, 2023 | |||
| Representative |
| ||
| Distribution |
| ||
| Population (2022) | 773,328 [1] | ||
| Median household income | $106,253[2] | ||
| Ethnicity |
| ||
| Cook PVI | D+5[3] | ||
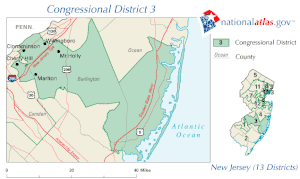
Under the 2020 census map, the 3rd district lost all of its towns in Ocean County, and gained several towns in Burlington County, Mercer County, and Monmouth County. [5]
Counties and municipalities in the district
For the 118th and successive Congresses (based on redistricting following the 2020 Census), the district contains all or portions of three counties and 53 municipalities.[6]
Burlington County (38):
- Bass River, Beverly, Bordentown City, Bordentown Township, Burlington City, Burlington Township, Chesterfield Township, Cinnaminson Township, Delanco Township, Delran Township, Eastampton Township, Edgewater Park Township, Evesham Township, Fieldsboro, Florence Township, Hainesport Township, Lumberton Township, Mansfield Township, Medford Lakes, Medford Township, Moorestown Township, Mount Holly Township, Mount Laurel Township, New Hanover Township, North Hanover Township, Pemberton Borough, Pemberton Township, Riverside Township, Riverton Borough, Shamong Township, Southampton Township, Springfield Township, Tabernacle Township, Washington Township, Westampton Township, Willingboro Township, Woodland Township and Wrightstown
Mercer County (5):
- East Windsor, Hamilton, Hightstown, Lawrence, and Robbinsville.
Monmouth County (10):
- Allentown, Englishtown, Freehold Borough, Freehold Township (part; also 4th), Holmdel, Manalapan, Marlboro, Millstone, Roosevelt, and Upper Freehold
Recent election results in statewide races
- Results under current lines (since 2023)
| Year | Office | Result |
|---|---|---|
| 2016 | President | Clinton 53.0% - 43.5% |
| 2017 | Governor | Murphy 53.0% - 45.2% |
| 2018 | Senator | Menendez 50.8% - 45.9% |
| 2020 | President | Biden 56.4% - 42.3% |
| 2020 | Senator | Booker 55.6% - 43.0% |
| 2021 | Governor | Murphy 50.5% - 48.8% |
- Results under old lines
| Year | Office | Results |
|---|---|---|
| 2000 | President | Gore 54 – 43% |
| 2004 | President | Bush 51 – 49% |
| 2008 | President | Obama 52 – 47% |
| 2012 | President | Obama 52 – 47% |
| 2016 | President | Trump 51 – 45% |
| 2017 | Governor | Guadagno 51.3% - 46.7% |
| 2020 | President | Trump 49.4 – 49.2% |
| 2020 | Senate | Mehta 49.4% - 49.0% |
| 2021 | Governor | Ciattarelli 56.2% - 42.5% |
List of members representing the district
1799–1801: one seat
| Member (District home) |
Party | Years | Cong ress |
Electoral history | Counties/towns |
|---|---|---|---|---|---|
| District organized from New Jersey's At-large congressional district in 1799 | |||||
| James Linn (Trenton) |
Democratic-Republican | March 4, 1799 – March 3, 1801 |
6th | Elected in 1798. Retired. |
Hunterdon and Somerset Counties |
| District organized to New Jersey's At-large congressional district in 1801 | |||||
1813–1815: two seats
From 1813 to 1815, two seats were apportioned, elected at-large on a general ticket. This district was organized from New Jersey's At-large congressional district.
| Years | Cong ress |
Seat A | Seat B | District location | |||||||
|---|---|---|---|---|---|---|---|---|---|---|---|
| Member (District home) |
Party | Electoral history | Member (District home) |
Party | Electoral history | ||||||
| March 4, 1813 – May 20, 1814 |
13th | William Coxe Jr. (Burlington) |
Federalist | Elected in 1813. Retired. |
Jacob Hufty (Salem) |
Federalist | Redistricted from the at-large district and re-elected in 1813. Died. |
Burlington, Cape May, Cumberland, Gloucester, and Salem Counties | |||
| May 20, 1814 – November 2, 1814 |
Vacant | ||||||||||
| November 2, 1814 – March 3, 1815 |
Thomas Bines (Pennsville) |
Democratic-Republican | Elected to finish Hufty's term. Retired. | ||||||||
District organized to New Jersey's At-large congressional district in 1815
1843–present: one seat
- Remainder of Middlesex County was moved to the new 15th district in 1962.
Recent election results
2012
| Party | Candidate | Votes | % | |
|---|---|---|---|---|
| Republican | Jon Runyan (incumbent) | 174,253 | 53.7 | |
| Democratic | Shelley Adler | 145,509 | 44.9 | |
| Independent | Robert Forchion | 1,965 | 0.6 | |
| Independent | Robert Shapiro | 1,104 | 0.3 | |
| Independent | Frederick John Lavergne | 770 | 0.2 | |
| Independent | Robert Witterschein | 530 | 0.2 | |
| Independent | Christopher Dennick | 280 | 0.1 | |
| Total votes | 324,411 | 100.0 | ||
| Republican hold | ||||
2014
| Party | Candidate | Votes | % | |
|---|---|---|---|---|
| Republican | Tom MacArthur | 100,471 | 54.0 | |
| Democratic | Aimee Belgard | 82,537 | 44.3 | |
| Independent | Frederick John Lavergne | 3,095 | 1.7 | |
| Total votes | 186,103 | 100.0 | ||
| Republican hold | ||||
2016
| Party | Candidate | Votes | % | |
|---|---|---|---|---|
| Republican | Tom MacArthur (incumbent) | 194,596 | 59.3 | |
| Democratic | Frederick John Lavergne | 127,526 | 38.9 | |
| Constitution | Lawrence W. Berlinski Jr. | 5,938 | 1.8 | |
| Total votes | 328,060 | 100.0 | ||
| Republican hold | ||||
2018
| Party | Candidate | Votes | % | |
|---|---|---|---|---|
| Democratic | Andy Kim | 153,473 | 50.0 | |
| Republican | Tom MacArthur (incumbent) | 149,500 | 48.7 | |
| Constitution | Larry Berlinski | 3,902 | 1.3 | |
| Total votes | 306,875 | 100.0 | ||
| Democratic gain from Republican | ||||
2020
| Party | Candidate | Votes | % | |
|---|---|---|---|---|
| Democratic | Andy Kim (incumbent) | 229,840 | 53.2 | |
| Republican | David Richter | 196,327 | 45.5 | |
| Independent | Martin Weber | 3,724 | 0.9 | |
| Independent | Robert Shapiro | 1,871 | 0.4 | |
| Total votes | 431,762 | 100.0 | ||
| Democratic hold | ||||
2022
| Party | Candidate | Votes | % | |
|---|---|---|---|---|
| Democratic | Andy Kim (incumbent) | 150,498 | 55.5 | |
| Republican | Bob Healey | 118,415 | 43.6 | |
| Libertarian | Christopher Russomanno | 1,347 | 0.5 | |
| Independent | Gregory Sobocinski | 1,116 | 0.4 | |
| Total votes | 271,376 | 100.0 | ||
| Democratic hold | ||||
References
- "Congressional District 3 (118th Congress), New Jersey" (under "People" header), census.gov. Note: Also source for population by ethnicity/(race) (%s). Retrieved 2023-01-28.
- "Congressional District 3 (118th Congress), New Jersey" (under "Socio-Economic" header), census.gov. Retrieved 2023-01-27.
- "2022 Cook PVI: District Map and List".
- Wildstein, David. "Andy Kim amasses towering $3.3 warchest for re-election bid". Retrieved January 25, 2022.
- "New Jersey Congressional Districts: 2022-2031" (PDF). New Jersey Redistricting Commission. December 22, 2021. Retrieved December 29, 2021.
- , New Jersey Redistricting Commission, December 23, 2021. Accessed November 5, 2022.
- "Election Information" (PDF). NJ Department of State. November 6, 2012. Retrieved March 9, 2018.
- "Election Information" (PDF). NJ Department of State. December 2, 2014. Retrieved February 8, 2020.
- "Election Information" (PDF). NJ Department of State. November 8, 2016. Retrieved December 8, 2016.
- Johnson, Cheryl L. (February 28, 2019). "Statistics of the Congressional Election of November 6, 2018". Clerk of the U.S. House of Representatives. Retrieved April 27, 2019.
- "Official General Election Results: U.S. House of Representatives" (PDF). New Jersey Department of Elections. Retrieved December 7, 2020.
- "2022 Official General Election Results: U.S. House of Representatives" (PDF). New Jersey Department of State - Division of Elections. Retrieved December 7, 2022.
- Martis, Kenneth C. (1989). The Historical Atlas of Political Parties in the United States Congress. New York: Macmillan Publishing Company.
- Martis, Kenneth C. (1982). The Historical Atlas of United States Congressional Districts. New York: Macmillan Publishing Company.
- Congressional Biographical Directory of the United States 1774–present
.svg.png.webp)
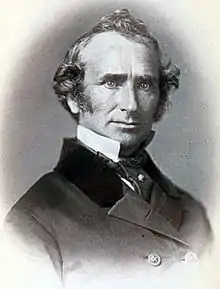
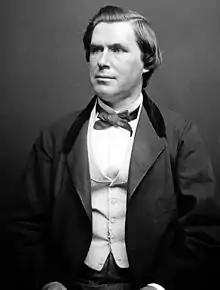
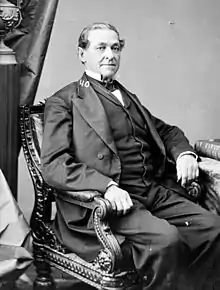
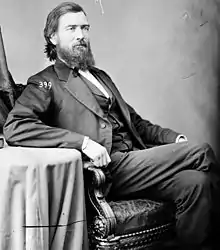

.jpg.webp)
.jpg.webp)
.jpg.webp)
.jpg.webp)




.svg.png.webp)
.jpg.webp)

_(new_version).svg.png.webp)