New Westminster—Burnaby
New Westminster—Burnaby is a federal electoral district in British Columbia, Canada, that was represented in the House of Commons of Canada from 1988 to 1997 and since 2015.
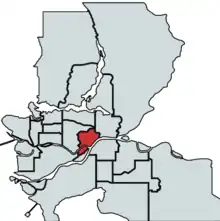 New Westminster—Burnaby in Relation to other Federal electoral ridings in the Vancouver area | |||
| Federal electoral district | |||
| Legislature | House of Commons | ||
| MP |
New Democratic | ||
| District created | 2013 | ||
| First contested | 2015 | ||
| Last contested | 2021 | ||
| District webpage | profile, map | ||
| Demographics | |||
| Population (2016)[1] | 115,340 | ||
| Electors (2019) | 85,807 | ||
| Area (km²)[2] | 29 | ||
| Pop. density (per km²) | 3,977.2 | ||
| Census division(s) | Metro Vancouver | ||
| Census subdivision(s) | Burnaby, New Westminster | ||
History
The 1988–1997 edition of this riding was created in 1987 from parts of Burnaby and New Westminster—Coquitlam ridings. The riding consisted of the City of New Westminster and the southern part of the District Municipality of Burnaby. It was abolished in 1996 when it was merged into New Westminster—Coquitlam—Burnaby.
The riding was recreated following the 2012 federal electoral boundaries redistribution and was legally defined in the 2013 representation order.[3] It was created from parts of Burnaby—New Westminster and New Westminster—Coquitlam. Its boundaries were legally defined in the 2013 representation order, which came into effect upon the call of the 42nd Canadian federal election, scheduled for October 2015.[4]
Demographics
| Panethnic group |
2021[5] | 2016[6] | 2011[7] | |||||||||||
|---|---|---|---|---|---|---|---|---|---|---|---|---|---|---|
| Pop. | % | Pop. | % | Pop. | % | |||||||||
| European[lower-alpha 1] | 50,165 | 40.74% | 52,345 | 46.25% | 53,995 | 50.57% | ||||||||
| East Asian[lower-alpha 2] | 25,840 | 20.98% | 23,265 | 20.55% | 19,605 | 18.36% | ||||||||
| South Asian | 13,970 | 11.34% | 11,635 | 10.28% | 11,360 | 10.64% | ||||||||
| Southeast Asian[lower-alpha 3] | 13,625 | 11.06% | 11,650 | 10.29% | 10,340 | 9.68% | ||||||||
| African | 4,595 | 3.73% | 3,170 | 2.8% | 2,415 | 2.26% | ||||||||
| Middle Eastern[lower-alpha 4] | 4,290 | 3.48% | 3,190 | 2.82% | 2,880 | 2.7% | ||||||||
| Latin American | 3,590 | 2.92% | 2,465 | 2.18% | 1,895 | 1.77% | ||||||||
| Indigenous | 3,120 | 2.53% | 3,335 | 2.95% | 2,960 | 2.77% | ||||||||
| Other[lower-alpha 5] | 3,940 | 3.2% | 2,140 | 1.89% | 1,330 | 1.25% | ||||||||
| Total responses | 123,140 | 98.31% | 113,190 | 98.14% | 106,780 | 98.28% | ||||||||
| Total population | 125,253 | 100% | 115,340 | 100% | 108,652 | 100% | ||||||||
| Notes: Totals greater than 100% due to multiple origin responses. Demographics based on 2012 Canadian federal electoral redistribution riding boundaries. | ||||||||||||||
Members of Parliament
| Parliament | Years | Member | Party | |
|---|---|---|---|---|
| Riding created from Burnaby and New Westminster—Coquitlam | ||||
| 34th | 1988–1993 | Dawn Black | New Democratic | |
| 35th | 1993–1997 | Paul Forseth | Reform | |
| Riding dissolved into New Westminster—Coquitlam—Burnaby, Vancouver South—Burnaby and Burnaby—Douglas |
||||
| Riding re-created from Burnaby—New Westminster and New Westminster—Coquitlam |
||||
| 42nd | 2015–2019 | Peter Julian | New Democratic | |
| 43rd | 2019–2021 | |||
| 44th | 2021–present | |||
Election results
New Westminster—Burnaby, 2015–present
| 2021 Canadian federal election | ||||||||
|---|---|---|---|---|---|---|---|---|
| Party | Candidate | Votes | % | ±% | Expenditures | |||
| New Democratic | Peter Julian | 24,054 | 48.8 | +4.6 | $87,163.56 | |||
| Liberal | Rozina Jaffer | 11,685 | 23.7 | +0.3 | $847.24 | |||
| Conservative | Paige Munro | 9,710 | 19.7 | -1.9 | $22,984.40 | |||
| Green | David Macdonald | 2,035 | 4.1 | -4.2 | $957.72 | |||
| People's | Kevin Heide | 1,840 | 3.7 | +2.1 | $0.00 | |||
| Total valid votes/Expense limit | 49,324 | 99.1 | – | $116,281.29 | ||||
| Total rejected ballots | 462 | 0.9 | ||||||
| Turnout | 49,786 | 57.1 | ||||||
| Eligible voters | 87,208 | |||||||
| New Democratic hold | Swing | +2.2 | ||||||
| Source: Elections Canada[8] | ||||||||
| 2019 Canadian federal election | ||||||||
|---|---|---|---|---|---|---|---|---|
| Party | Candidate | Votes | % | ±% | Expenditures | |||
| New Democratic | Peter Julian | 23,437 | 44.20 | +0.74 | $92,007.20 | |||
| Liberal | Will Davis | 12,414 | 23.40 | -5.57 | $46,165.54 | |||
| Conservative | Megan Veck | 11,439 | 21.60 | +1.63 | $21,181.03 | |||
| Green | Suzanne de Montigny | 4,378 | 8.30 | +3.58 | $7,597.20 | |||
| People's | Hansen Ginn | 862 | 1.60 | – | none listed | |||
| Libertarian | Neeraj Murarka | 307 | 0.60 | -2.00 | none listed | |||
| Independent | Ahmad Passyar | 83 | 0.20 | – | none listed | |||
| Marxist–Leninist | Joseph Theriault | 57 | 0.10 | -0.18 | none listed | |||
| Total valid votes/expense limit | 52,977 | 100.0 | ||||||
| Total rejected ballots | 452 | 0.85 | ||||||
| Turnout | 53,429 | 62.26 | ||||||
| Eligible voters | 85,807 | |||||||
| New Democratic hold | Swing | +3.16 | ||||||
| Source: Elections Canada[9][10] | ||||||||
| 2015 Canadian federal election | ||||||||
|---|---|---|---|---|---|---|---|---|
| Party | Candidate | Votes | % | ±% | Expenditures | |||
| New Democratic | Peter Julian | 22,876 | 43.46 | -8.32 | $93,602.98 | |||
| Liberal | Sasha Ramnarine | 15,253 | 28.97 | +20.27 | $11,829.89 | |||
| Conservative | Chloé Ellis | 10,512 | 19.97 | -14.79 | $16,364.97 | |||
| Green | Kyle Routledge | 2,487 | 4.72 | +0.40 | $1,669.47 | |||
| Libertarian | Rex Brocki | 1,368 | 2.60 | – | – | |||
| Marxist–Leninist | Joseph Theriault | 146 | 0.28 | – | – | |||
| Total valid votes/expense limit | 52,642 | 100.00 | $213,160.28 | |||||
| Total rejected ballots | 363 | 0.68 | – | |||||
| Turnout | 53,005 | 66.95 | – | |||||
| Eligible voters | 79,176 | |||||||
| New Democratic hold | Swing | -14.30 | ||||||
| Source: Elections Canada[11][12] | ||||||||
| 2011 federal election redistributed results[13] | |||
|---|---|---|---|
| Party | Vote | % | |
| New Democratic | 21,200 | 51.78 | |
| Conservative | 14,230 | 34.75 | |
| Liberal | 3,563 | 8.70 | |
| Green | 1,772 | 4.33 | |
| Others | 179 | 0.44 | |
New Westminster—Burnaby, 1988–1997
| 1993 Canadian federal election | ||||||||
|---|---|---|---|---|---|---|---|---|
| Party | Candidate | Votes | % | ±% | ||||
| Reform | Paul E. Forseth | 16,254 | 29.33 | +26.32 | ||||
| Liberal | Leanore Copeland | 15,430 | 27.84 | +8.57 | ||||
| New Democratic | Dawn Black | 14,442 | 26.06 | -17.56 | ||||
| Progressive Conservative | Neil MacKay | 6,419 | 11.58 | -19.92 | ||||
| National | P. Jeffery Jewell | 1,775 | 3.20 | – | ||||
| Natural Law | Carolyn Grayson | 374 | 0.67 | – | ||||
| Green | Todd E. Romaine | 313 | 0.56 | -0.02 | ||||
| Libertarian | Robert Fong | 267 | 0.48 | -0.07 | ||||
| Independent | Jess P. Lee | 73 | 0.13 | – | ||||
| Commonwealth of Canada | Geoff Dakin | 70 | 0.13 | – | ||||
| Total valid votes | 55,417 | 100.0 | ||||||
| Reform gain from New Democratic | Swing | +8.88 | ||||||
| 1988 Canadian federal election | ||||||||
|---|---|---|---|---|---|---|---|---|
| Party | Candidate | Votes | % | |||||
| New Democratic | Dawn Black | 24,933 | 43.62 | |||||
| Progressive Conservative | Marie Taylor | 18,007 | 31.50 | |||||
| Liberal | Carlos Brito | 11,013 | 19.27 | |||||
| Reform | Bill Anderson | 1,722 | 3.01 | |||||
| Social Credit | Randall Rush | 718 | 1.26 | |||||
| Green | Richard Bidwell | 332 | 0.58 | |||||
| Libertarian | Paul Geddes | 316 | 0.55 | |||||
| Communist | Elsie Dean | 116 | 0.20 | |||||
| Total valid votes | 57,157 | 100.0 | ||||||
| This riding was created from parts of Burnaby and New Westminster—Coquitlam, both of which elected a New Democrat in the last election. | ||||||||
See also
Notes
- Statistic includes all persons that did not make up part of a visible minority or an indigenous identity.
- Statistic includes total responses of "Chinese", "Korean", and "Japanese" under visible minority section on census.
- Statistic includes total responses of "Filipino" and "Southeast Asian" under visible minority section on census.
- Statistic includes total responses of "West Asian" and "Arab" under visible minority section on census.
- Statistic includes total responses of "Visible minority, n.i.e." and "Multiple visible minorities" under visible minority section on census.
References
- Statistics Canada: 2016
- Statistics Canada: 2011
- Final Report – British Columbia
- Timeline for the Redistribution of Federal Electoral Districts
- Government of Canada, Statistics Canada (October 26, 2022). "Census Profile, 2021 Census of Population". www12.statcan.gc.ca. Retrieved February 14, 2023.
- Government of Canada, Statistics Canada (October 27, 2021). "Census Profile, 2016 Census". www12.statcan.gc.ca. Retrieved February 14, 2023.
- Government of Canada, Statistics Canada (November 27, 2015). "NHS Profile". www12.statcan.gc.ca. Retrieved February 14, 2023.
- "Confirmed candidates — New Westminster—Burnaby". Elections Canada. September 1, 2021. Retrieved September 6, 2021.
- "List of confirmed candidates". Elections Canada. Retrieved October 4, 2019.
- "Election Night Results". Elections Canada. Retrieved November 16, 2019.
- Elections Canada – Confirmed candidates for New Westminster—Burnaby, 30 September 2015
- Elections Canada – Preliminary Election Expenses Limits for Candidates
- Pundits' Guide to Canadian Elections
External links
- Riding history from the Library of Parliament
- Website of the Parliament of Canada