New York's 4th congressional district
New York's 4th congressional district is a congressional district for the United States House of Representatives in central and southern Nassau County, represented by Republican Anthony D'Esposito since 2023.
| New York's 4th congressional district | |||
|---|---|---|---|
Interactive map of district boundaries since January 3, 2023 | |||
| Representative |
| ||
| Distribution |
| ||
| Population (2022) | 771,912[1] | ||
| Median household income | $131,291[2] | ||
| Ethnicity |
| ||
| Cook PVI | D+5[3] | ||
NY-04 is the second-wealthiest congressional district in New York, and among the wealthiest nationally.[4] As of 2023, this district, alongside California's 22nd, is the most Democratic-leaning congressional district represented by a Republican, with a partisan lean of D+5.[3] It was also one of 18 districts that would have voted for Joe Biden in the 2020 presidential election had they existed in their current configuration while being won or held by a Republican in 2022.
Composition
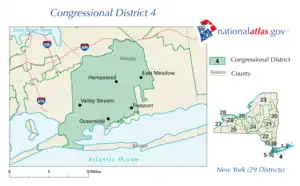
The district includes the communities of Elmont, Baldwin, Bellmore, East Rockaway, East Meadow, Five Towns, Lynbrook, Floral Park, Franklin Square, Garden City, Garden City Park, Hempstead, Atlantic Beach, Long Beach, Malverne, Freeport, Merrick, Carle Place, New Hyde Park, Oceanside, Rockville Centre, Roosevelt, Seaford, Uniondale, Wantagh, West Hempstead, Westbury, and Valley Stream.
Recent statewide election results
| Election results from presidential races | ||
|---|---|---|
| Year | Office | Results |
| 1992 | President | Clinton 47–41% |
| 1996 | President | Clinton 56–36% |
| 2000 | President | Gore 59–38% |
| 2004 | President | Kerry 55–44% |
| 2008 | President | Obama 55–44% |
| 2012 | President | Obama 56–43% |
| 2016 | President | Clinton 53–44% |
| 2020 | President | Biden 56-42% |
Historical district boundaries
.tif.png.webp)
- 1789–1913:
- Parts of Manhattan
- 1913–1945:
- Parts of Brooklyn
- 1945–1963:
- Parts of Queens
- 1963–present:
- Parts of Nassau County
In the 1960s, 1970s and 1980s much of this area was in the 5th District. The 4th District then included many towns in eastern Nassau County now in the 3rd District.
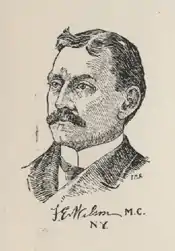
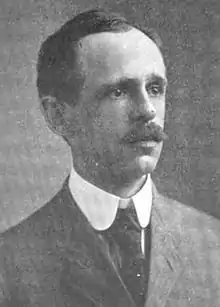
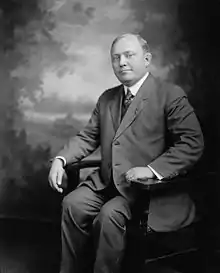
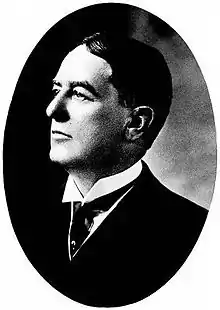
List of members representing the district
Election results
In New York electoral politics there are numerous smaller parties at various points on the political spectrum. Certain parties invariably endorse either the Republican or Democratic candidate for every office, hence the state electoral results contain both the party votes, and the final candidate votes (Listed as "Recap").
| Party | Candidate | Votes | % | ±% | |
|---|---|---|---|---|---|
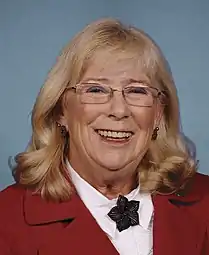
| Democratic | Carolyn McCarthy | 127,060 | 57.5 | ||
| Republican | Daniel Frisa (incumbent) | 89,542 | 40.5 | ||
| Right to Life | Vincent P. Garbitelli | 3,252 | 1.5 | ||
| Liberal | Robert S. Berkowitz | 1,162 | 0.5 | ||
| Majority | 37,518 | 17.0 | |||
| Turnout | 221,016 | 100 | |||
| Party | Candidate | Votes | % | ±% | |
|---|---|---|---|---|---|
| Democratic | Carolyn McCarthy (incumbent) | 90,256 | 52.6 | -4.9 | |
| Republican | Gregory R. Becker | 79,984 | 46.6 | +6.1 | |
| Liberal | Patricia M. Maher | 1,343 | 0.8 | +0.3 | |
| Majority | 10,272 | 6.0 | -11.0 | ||
| Turnout | 171,583 | 100 | -22.4 | ||
| Party | Candidate | Votes | % | ±% | |
|---|---|---|---|---|---|
| Democratic | Carolyn McCarthy (incumbent) | 136,703 | 60.6 | +8.0 | |
| Republican | Gregory R. Becker | 87,830 | 38.9 | -7.7 | |
| Liberal | Barbara Vitanza | 1,222 | 0.5 | -0.3 | |
| Majority | 48,873 | 21.6 | +15.6 | ||
| Turnout | 225,755 | 100 | +31.6 | ||
| Party | Candidate | Votes | % | ±% | |
|---|---|---|---|---|---|
| Democratic | Carolyn McCarthy (incumbent) | 94,806 | 56.3 | -4.3 | |
| Republican | Marilyn F. O'Grady | 72,882 | 43.2 | +4.3 | |
| Green | Tim Derham | 852 | 0.5 | +0.5 | |
| Majority | 21,924 | 13.0 | -8.6 | ||
| Turnout | 168,540 | 100 | -25.3 | ||
| Party | Candidate | Votes | % | ±% | |
|---|---|---|---|---|---|
| Democratic | Carolyn McCarthy (incumbent) | 159,969 | 63.0 | +6.7 | |
| Republican | James Garner | 94,141 | 37.0 | -6.2 | |
| Majority | 65,828 | 25.9 | +12.9 | ||
| Turnout | 254,110 | 100 | +50.8 | ||
| Party | Candidate | Votes | % | ±% | |
|---|---|---|---|---|---|
| Democratic | Carolyn McCarthy (incumbent) | 101,861 | 64.9 | +1.9 | |
| Republican | Martin W. Blessinger | 55,050 | 35.1 | -1.9 | |
| Majority | 46,811 | 29.8 | +3.9 | ||
| Turnout | 156,911 | 100 | -38.3 | ||
| Party | Candidate | Votes | % | ±% | |
|---|---|---|---|---|---|
| Democratic | Carolyn McCarthy (incumbent) | 164,028 | 64.0 | -0.9 | |
| Republican | Jack Martins | 92,242 | 36.0 | +0.9 | |
| Majority | 71,786 | 28 | -1.8 | ||
| Turnout | 256,270 | 100 | +63.3 | ||
| Party | Candidate | Votes | % | ±% | |
|---|---|---|---|---|---|
| Democratic | Carolyn McCarthy (incumbent) | 94,483 | 53.6 | -10.4 | |
| Republican | Fran Becker | 81,718 | 46.4 | +10.4 | |
| Majority | 12,765 | 7.2 | -20.8 | ||
| Turnout | 176,201 | 100 | -31.2 | ||
| Party | Candidate | Votes | % | ±% | |
|---|---|---|---|---|---|
| Democratic | Carolyn McCarthy (incumbent) | 163,955 | 61.8 | +8.2 | |
| Republican | Fran Becker | 85,693 | 32.3 | -14.1 | |
| Conservative | Frank Scaturro | 15,603 | 5.9 | +5.9 | |
| Majority | 62,659 | 23.6 | +16.4 | ||
| Turnout | 265,251 | 100 | +50.5 | ||
| Party | Candidate | Votes | % | ±% | |
|---|---|---|---|---|---|
| Democratic | Kathleen M. Rice | 89,793 | 52.8 | -9.0 | |
| Republican | Bruce Blakeman | 80,127 | 47.2 | +14.9 | |
| Party | Candidate | Votes | % | ±% | |
|---|---|---|---|---|---|
| Democratic | Kathleen Rice (incumbent) | 185,286 | 59.5 | +6.7 | |
| Republican | David Gurfein | 125,865 | 40.5 | -6.7 | |
| Party | Candidate | Votes | % | ±% | |
|---|---|---|---|---|---|
| Democratic | Kathleen Rice (incumbent) | 159,535 | 61.0 | +1.5 | |
| Republican | Ameer Benno | 100,571 | 39.0 | -1.5 | |
| Party | Candidate | Votes | % | |
|---|---|---|---|---|
| Democratic | Kathleen Rice (incumbent) | 199,762 | 56.1 | |
| Republican | Douglas Tuman | 139,559 | 39.2 | |
| Conservative | Douglas Tuman | 13,448 | 3.8 | |
| Total | Douglas Tuman | 153,007 | 43.0 | |
| Green | Joseph R. Naham | 3,024 | 0.9 | |
| Total votes | 355,793 | 100.0 | ||
| Democratic hold | ||||
See also
References
- "New York congressional districts by urban and rural population and land area". United States Census Bureau. June 8, 2017. Archived from the original on November 21, 2019. Retrieved November 21, 2019.
- "My Congressional District".
- "2022 Cook PVI: District Map and List". Cook Political Report. Retrieved January 10, 2023.
- DePietro, Andrew. "The Wealthiest Congressional Districts Of 2022". Forbes. Retrieved December 2, 2022.
- Rogers, Alex (February 15, 2022). "Kathleen Rice becomes 30th House Democrat to not seek reelection in 2022". CNN. Retrieved February 15, 2022.
- "Ballotpedia: The Encyclopedia of Citizen-Controlled Democracy (Alpha Stage Two Development)". Archived from the original on October 13, 2007.
- "Ballotpedia: The Encyclopedia of Citizen-Controlled Democracy (Alpha Stage Two Development)". Archived from the original on October 13, 2007.
- 1996 House election data, Clerk of the House of Representatives
- 1998 House election data, "
- 2000 House election data, "
- 2002 House election data, "
- 2004 House election data, "
- 2006 House election data, "
- Martis, Kenneth C. (1989). The Historical Atlas of Political Parties in the United States Congress. New York: Macmillan Publishing Company.
- Martis, Kenneth C. (1982). The Historical Atlas of United States Congressional Districts. New York: Macmillan Publishing Company.
- Congressional Biographical Directory of the United States 1774–present
- National atlas congressional maps
.svg.png.webp)
.jpg.webp)
.jpg.webp)

.jpg.webp)
.jpg.webp)
.jpg.webp)
.jpg.webp)






.jpg.webp)


.tif.png.webp)
.jpg.webp)

_(since_2023).svg.png.webp)