Nord-du-Québec
Nord-du-Québec (French pronunciation: [nɔʁ dy kebɛk]; English: Northern Quebec) is the largest, but the least populous, of the seventeen administrative regions of Quebec, Canada. With nearly 750,000 square kilometres (290,000 sq mi) of land area, and very extensive lakes and rivers, it covers much of the Labrador Peninsula and about 55% of the total land surface area of Quebec, while containing a little more than 0.5% of the population.
Nord-du-Québec | |
|---|---|
Region; also Census division | |
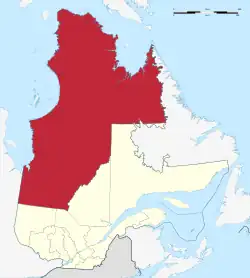 Location within Quebec and Canada (inset) | |
| Coordinates: 56°10′N 74°25′W[1][2] | |
| Country | Canada |
| Province | Quebec |
| Area | |
| • Land | 747,191.93 km2 (288,492.42 sq mi) |
| Population (2021)[3] | |
| • Total | 45,740 |
| • Density | 0.06/km2 (0.2/sq mi) |
| • Change (2016–2021) | |
| • Dwellings | 17,325 |
| Website | Services Québec: Nord-du-Québec |
| [4] | |
Before 1912, the northernmost part of this region was part of the Ungava District of the Northwest Territories, and until 1987 it was referred to as Nouveau-Québec, or New Quebec.
It is bordered by Hudson Bay and James Bay in the west, Hudson Strait and Ungava Bay in the north, Labrador in the northeast, and the administrative regions of Abitibi-Témiscamingue, Mauricie, Saguenay–Lac-Saint-Jean, and Côte-Nord in the south and southeast.
The Nord-du-Québec region is part of the territory covered by the James Bay and Northern Quebec Agreement of 1975; other regions covered (in part) by this Agreement include Côte-Nord, Mauricie and Abitibi-Témiscamingue administrative regions.
Geography
Nord-du-Québec region is divided for statistical and other purposes into three territories equivalent to a regional county municipality (TEs):
- Kativik (or Nunavik) north of the 55th parallel, predominantly Inuit
- Eeyou Istchee non-contiguously enclaved within Jamésie (with one community in Kativik), predominantly Cree
- Jamésie south of the 55th parallel
From the Canada 2011 Census, Eeyou Istchee has a land area of 5,586.25 km2 and a population of 16,350; Jamésie has a land area of 298,202.78 km2 and a population of 14,139; Kativik has a land area of 443,372.20 km2 and a population of 12,090. However, when the Grand Council of the Crees speaks of "Eeyou Istchee", they refer to a much larger and contiguous traditional territory and homeland that covers much of Jamésie.
The most populous community overall is the city of Chibougamau, which is in Jamésie. The most populous community in Eeyou Istchee is Chisasibi. And the most populous community in Kativik is Kuujjuaq.
Jamésie, extending from the eastern shore of James Bay to the Otish Mountains of the Laurentian Plateau, is mainly boreal forest. Eeyou Istchee is largely enclaved within Jamésie, although one of its communities is slightly to the north of the 55th parallel and geographically enclaved within Kativik. Kativik has some boreal forest in its southern portion but is mainly tundra which covers the entire Ungava Peninsula.
Local government
The administrative structure of Nord-du-Québec is divided between three equivalent territories to a regional municipality: Kativik, Eeyou Istchee, and Jamésie. At the local level exists five municipalities: The towns of Chibougamau (the largest town in this region), Chapais, Lebel-sur-Quévillon, and Matagami, and the special municipality of Eeyou Istchee James Bay, which was formerly the local municipality of Baie-James before a 2012 restructure of the government.
Kativik offers regional services to its 14 northern villages and associated Inuit reserved lands as well as the Naskapi village municipality of Kawawachikamach. Eeyou Istchee offers regional services to its 9 Cree village municipalities and their associated Cree reserved lands. The four towns of Jamésie are not covered by a regional government, and supply their own services. The special local municipality of Eeyou Istchee James Bay is governed jointly by the Eeyou Istchee James Bay Regional Government, which consists of 11 representatives from Eeyou Istche and 11 representatives from Jamésie.
Demographics
In the 2021 Census of Population conducted by Statistics Canada, the Nord-du-Québec region had a population of 45,740 living in 14,543 of its 17,325 total private dwellings, a change of +2.6% from its 2016 population of 44,561. With a land area of 707,306.52 km2 (273,092.57 sq mi), it had a population density of 0.1/km2 (0.2/sq mi) in 2021.[5] If the region were its own province, it would be larger than all other Canadian provinces except for Ontario and British Columbia.
The median age is 29.8, as opposed to 41.6 for all of Canada. It is the youngest region of Québec.
Most residents (58.7%) spoke Indigenous languages as their mother tongue. The Cree-Innu languages were the mother tongue of 31.7%, followed by Inuktitut at 26.9%. From Canada's official languages, French was the mother tongue of 29.9% of residents in 2021, while English was for 6.6%. 3.0% reported both English and a non-official language as their mother tongue, 0.4% reported both English and French as their first language, and 0.3% reported both French and a non-official language as their mother tongue.
As of 2021, Indigenous peoples comprised 68.5% of the population, and visible minorities contributed 1.9%. The largest visible minority groups in Saguenay–Lac-Saint-Jean are Black (0.9%), Arab (0.3%), and Filipino (0.3%).
In 2021, 72.2% of the population identified as Christian. 36.3% were Anglican, 24.1% were Catholic, and 6.2% were Pentecostal. 24.9% said they had no religious affiliation. Traditional North American Indigenous spirituality practitioners were the largest non-Christian religious minority, making up 1.9% of the population.
Counting both single and multiple responses, the most commonly identified ethnocultural ancestries were:
| Ethnic origin | 2021 |
|---|---|
| Cree | 34.0% |
| Inuit | 28.8% |
| Canadian | 12.7% |
| Québécois | 7.6% |
| French | 7.5% |
| First Nations | 6.4% |
| French Canadian | 3.9% |
| Scottish | 2.3% |
| Irish | 1.9% |
(Percentages may total more than 100% due to rounding and multiple responses).
| Visible minority and Aboriginal population (Canada 2021 Census) | |||
|---|---|---|---|
| Population group | Population | % of total population | |
| White | 13,455 | 29.6% | |
| Visible minority group | South Asian | 35 | 0.1% |
| Chinese | 45 | 0.1% | |
| Black | 395 | 0.9% | |
| Filipino | 125 | 0.3% | |
| Arab | 155 | 0.3% | |
| Latin American | 40 | 0.1% | |
| Southeast Asian | 20 | 0% | |
| West Asian | 15 | 0% | |
| Korean | 0 | 0% | |
| Japanese | 10 | 0% | |
| Visible minority, n.i.e. | 10 | 0% | |
| Multiple visible minority | 15 | 0.1% | |
| Total visible minority population | 855 | 1.9% | |
| Aboriginal group | First Nations | 17,520 | 38.5% |
| Métis | 425 | 0.9% | |
| Inuit | 26,660 | 27.8% | |
| Aboriginal, n.i.e. | 370 | 0.8% | |
| Multiple Aboriginal identity | 200 | 0.4% | |
| Total Aboriginal population | 31,170 | 68.5% | |
| Total population | 45,480 | 100% | |
Transportation and access
There is a limited network of roads in the Jamésie region which reaches most of the few, small communities. Most were constructed as part of the James Bay Project. The "main road" of the region is the 620 kilometres (390 mi) long James Bay Road, a paved (albeit remote) extension of Route 109 from Matagami to Radisson. The 407 kilometres (253 mi) long gravel Route du Nord connects the James Bay Road to Route 167 near Chibougamau. The 666 kilometres (414 mi) gravel Trans-Taiga Road branches off the James Bay Road to Caniapiscau, the northernmost connecting road in eastern North America.
The few provincial routes are concentrated in the far south of the region, including Route 109 to Matagami, Route 113, which ends near Chibougamau, and Route 167 to Mistissini.
There are no roads to Nunavik from the south. There are isolated roads in and around villages, as well as an isolated road running from Raglan Mine to Deception Bay, connecting to Salluit. Access is limited to air travel, sea travel to coastal areas, or hiking great distances. All villages have their own airport, with the Kuujjuaq Airport functioning as a regional hub.
Geographic hierarchy of census division
| Census Code | E/J/K? | Name | Type | Population 2011 | Population 2006 | Total dwellings | Dwellings usual res. | Land Area |
|---|---|---|---|---|---|---|---|---|
| 2499883 | K | Akulivik | TI | 0 | 0 | 0 | 0 | 445.73 |
| 2499125 | K | Akulivik | VN | 615 | 507 | 148 | 137 | 76.87 |
| 2499891 | K | Aupaluk | TI | 0 | 0 | 0 | 0 | 544.03 |
| 2499105 | K | Aupaluk | VN | 195 | 174 | 59 | 56 | 30.12 |
| 2499904 | K | Baie-d'Hudson | NO | 0 | 16 | 0 | 0 | 129712.09 |
| 2499020 | J | Chapais | V | 1 610 | 1 630 | 728 | 674 | 63.64 |
| 2499025 | J | Chibougamau | V | 7 541 | 7 563 | 3 474 | 3 222 | 699.31 |
| 2499055 | E | Chisasibi | VC | 0 | 0 | 0 | 0 | 491.63 |
| 2499814 | E | Chisasibi | TC | 4 484 | 3 972 | 1 050 | 923 | 828.18 |
| 2499045 | E | Eastmain | VC | 0 | 0 | 0 | 0 | 316.91 |
| 2499810 | E | Eastmain | TC | 767 | 650 | 226 | 188 | 147.47 |
| 2499879 | K | Inukjuak | TI | 0 | 0 | 0 | 0 | 428.39 |
| 2499085 | K | Inukjuak | VN | 1 597 | 1 597 | 444 | 413 | 55.63 |
| 2499140 | K | Ivujivik | VN | 370 | 349 | 91 | 86 | 35.21 |
| 2499894 | K | Kangiqsualujjuaq | TI | 0 | 0 | 0 | 0 | 538.42 |
| 2499090 | K | Kangiqsualujjuaq | VN | 874 | 735 | 191 | 185 | 35.05 |
| 2499888 | K | Kangiqsujuaq | TI | 0 | 0 | 0 | 0 | 572.62 |
| 2499130 | K | Kangiqsujuaq | VN | 696 | 605 | 174 | 170 | 12.56 |
| 2499890 | K | Kangirsuk | TI | 0 | 0 | 0 | 0 | 529.40 |
| 2499110 | K | Kangirsuk | VN | 549 | 466 | 163 | 160 | 57.26 |
| 2499065 | K | Kawawachikamach | VK | 0 | 0 | 0 | 0 | 242.09 |
| 2499893 | K | Kuujjuaq | TI | 0 | 0 | 0 | 0 | 320.80 |
| 2499095 | K | Kuujjuaq | VN | 2 375 | 2 132 | 925 | 799 | 292.72 |
| 2499877 | K | Kuujjuarapik | TI | 0 | 0 | 0 | 0 | 293.66 |
| 2499075 | K | Kuujjuarapik | VN | 657 | 568 | 204 | 189 | 8.16 |
| 2499005 | J | Lebel-sur-Quévillon | V | 2 159 | 2 729 | 1 111 | 917 | 40.14 |
| 2499015 | J | Matagami | V | 1 526 | 1 555 | 719 | 625 | 66.85 |
| 2499030 | E | Mistissini | VC | 0 | 0 | 0 | 0 | 514.30 |
| 2499804 | E | Mistissini | TC | 3 427 | 2 897 | 952 | 845 | 865.76 |
| 2499040 | E | Nemaska | VC | 0 | 0 | 0 | 0 | 51.18 |
| 2499808 | E | Nemaska | TC | 712 | 642 | 226 | 200 | 96.57 |
| 2499818 | E | Oujé-Bougoumou | TC | 725 | 606 | 251 | 183 | 2.54 |
| 2499120 | K | Puvirnituq | VN | 1 692 | 1 457 | 489 | 389 | 85.74 |
| 2499889 | K | Quaqtaq | TI | 0 | 0 | 0 | 0 | 523.83 |
| 2499115 | K | Quaqtaq | VN | 376 | 315 | 91 | 89 | 26.54 |
| 2499902 | K | Rivière-Koksoak | NO | 0 | 15 | 0 | 0 | 307039.90 |
| 2499887 | K | Salluit | TI | 0 | 0 | 0 | 0 | 596.84 |
| 2499135 | K | Salluit | VN | 1 347 | 1 241 | 315 | 299 | 14.39 |
| 2499892 | K | Tasiujaq | TI | 0 | 0 | 0 | 0 | 502.11 |
| 2499100 | K | Tasiujaq | VN | 303 | 248 | 72 | 72 | 66.54 |
| 2499878 | K | Umiujaq | TI | 0 | 0 | 0 | 0 | 257.78 |
| 2499080 | K | Umiujaq | VN | 444 | 390 | 104 | 94 | 27.72 |
| 2499035 | E | Waskaganish | VC | 0 | 0 | 0 | 0 | 277.76 |
| 2499806 | E | Waskaganish | TC | 2 206 | 1 864 | 496 | 467 | 505.37 |
| 2499010 | E | Waswanipi | VC | 0 | 0 | 0 | 0 | 211.52 |
| 2499802 | E | Waswanipi | TC | 1 777 | 1 473 | 513 | 413 | 415.64 |
| 2499050 | E | Wemindji | VC | 0 | 0 | 0 | 0 | 171.06 |
| 2499812 | E | Wemindji | TC | 1 378 | 1 215 | 377 | 333 | 377.95 |
| 2499070 | E | Whapmagoostui | VC | 0 | 0 | 0 | 0 | 122.53 |
| 2499816 | E | Whapmagoostui | TC | 874 | 812 | 221 | 206 | 189.88 |
| Nord-du-Québec | CD | 42579 | 39 817 | 14 515 | 12 925 | 747161.22 | ||
| E | Eeyou Istchee | TE | 16 350 | 14 131 | 4 312 | 3 758 | 5586.25 | |
| J | Jamésie | TE | 14 139 | 14 871 | 6 733 | 6 029 | 298202.78 | |
| K | Kativik | TE | 12 090 | 10 815 | 3 470 | 3 138 | 443372.20 | |
In the rightmost column, the total area adds up to 747161.23 rather than the correct 747161.22 due to rounding error.
Administrative divisions
Regional governments
Independent cities
Cree villages
Native Reserve
Major communities
See also
References
- "Reference number 227457 in Banque de noms de lieux du Québec". toponymie.gouv.qc.ca (in French). Commission de toponymie du Québec.
- "Reference number 291342 in Banque de noms de lieux du Québec". toponymie.gouv.qc.ca (in French). Commission de toponymie du Québec.
- "Census Profile, 2021 Census: Nord-du-Québec [Economic region], Quebec". Statistics Canada. 9 February 2022. Retrieved December 13, 2022.
- "Nord-du-Québec (Code 2499) Census Profile". 2011 census. Government of Canada - Statistics Canada.
- "Population and dwelling counts: Canada, provinces and territories, and census subdivisions (municipalities), Quebec". Statistics Canada. October 25, 2022. Retrieved December 13, 2022.
- Nord-du-Québec (Census division)
Further reading
- Dana, Leo Paul 2010, "Nunavik, Arctic Quebec: Where Co-operatives Supplement Entrepreneurship,” Global Business and Economics Review, 12 (1/2), January 2010, pp. 42–71.
- Landry, Michel K., et al. Équation Nord: formule gagnante pour des affaires prospères dans le nord du Québec. [Toronto, Ont.]: Deloitte, [2013]. Without ISBN
External links
- Nord-du-Québec (at website of the Ministère des Affaires municipales, des Régions et de l'Occupation du territoire)
- Official site of the Nord-du-Québec administrative region (archived)
- Official site of the Kativik Regional Government (Nunavik)
- Officiel site of the Grand Council of the Crees (Eeyou Istchee)
| Regional county municipalities and equivalent territories |
|
|---|---|
| Municipalities | |