List of countries by oil exports
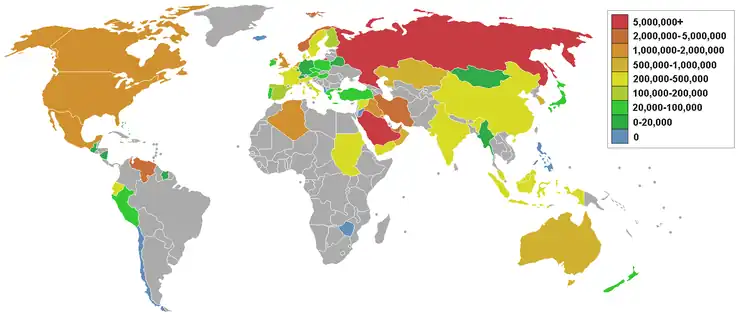
This is a list of oil-producing countries by oil exports based on The World Factbook[1] and other Sources.[2] Many countries also import oil, and some import more oil than they export.

Countries by rank
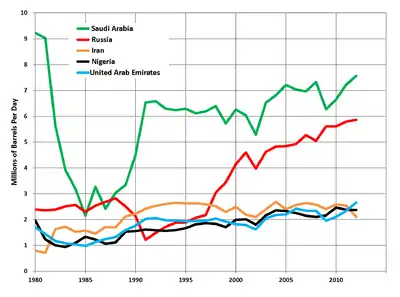
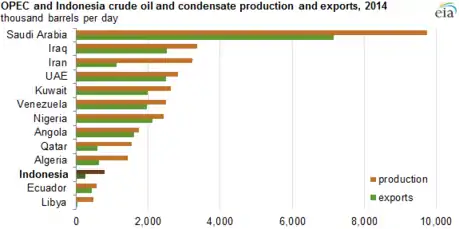
In 2022, Saudi Arabia was the largest exporter of petroleum, followed by Russia and Iraq. Other major exporters of petroleum in that year included the United States, Canada and United Arab Emirates.
| Country | Oil exports (bbl/day) | Date of information |
|---|---|---|
| 7,364,000 | 2022 est. | |
| 4,780,000 | 2022 est. | |
| 3,712,000 | 2022 est. | |
| 3,604,000 | 2022 | |
| 3,350,000 | 2022 | |
| 2,717,000 | 2022 | |
| 1,879,000 | 2022 | |
| 1,558,000 | 2022 | |
| 1,388,000 | 2022 | |
| 1,346,417 | 2022 est. | |
| 1,315,000 | 2022 est | |
| 1,198,511 | 2020 | |
| 1,085,000 | 2022 | |
| 920,000 | 2022 est. | |
| 901,000 | 2022 | |
| 859,883 | 2020 est. | |
| 813,000 | 2018 est. | |
| 724,334 | 2020 est. | |
| 540,959 | 2020 est. | |
| 502,801 | 2020 | |
| 477,000 | 2022 | |
| 438,000 | 2022 est. | |
| 361,820 | 2020 est. | |
| 92,909 | 2020 est. | |
| 81,000 | 2022 est. | |
| 253,157 | 2020 est. | |
| 291,800 | 2010 est. | |
| 243,000 | 2022 est. | |
| 280,000 | 2021 est. | |
| 185,000 | 2022 est. | |
| 113,497 | 2020 est. | |
| 78,070 | 2016 est. | |
| 8,875 | 2016 est. | |
| 154,691 | 2016 est. | |
| 6,580 | 2019 est. | |
| 82,333 | 2020 est. | |
| 97,079 | 2016 est. | |
| 135,431 | 2020 est. | |
| 90,920 | 2010 est. | |
| 87,000 | 2010 est. | |
| 102,750 | 2020 est. | |
| 83,000 | 2012 est. | |
| 77,980 | 2010 est. | |
| 75,340 | 2010 est. | |
| 67,000 | 2012 est. | |
| 55,680 | 2010 est. | |
| 42,390 | 2010 est. | |
| 35,500 | 2013 est. | |
| 33,000 | 2013 est. | |
| 32,200 | 2011 est. | |
| 32,190 | 2010 est. | |
| 28,400 | 2010 est. | |
| 23,320 | 2013 est. | |
| 21,551 | 2021 est. | |
| 20,090 | 2010 est. | |
| 15,610 | 2012 est. | |
| 14,260 | 2010 est. | |
| 10,960 | 2010 est. | |
| 7,624 | 2010 est. | |
| 7,621 | 2010 est. | |
| 7,337 | 2010 est. | |
| 6,300 | 2010 est. | |
| 5,680 | 2010 est. | |
| 4,345 | 2010 est. | |
| 3,615 | 2011 est. | |
| 2,181 | 2010 est. | |
| 1,858 | 2010 est. | |
| 765 | 2010 est. | |
| 531 | 2012 est. | |
| 404 | 2010 est. | |
| 263 | 2010 est. | |
| 61 | 2013 est. | |
| 0 | 2010 est. |
Oil export revenues
Academic contributions have written about differences in petroleum revenue management in various countries. Many scholars see the natural resource wealth in some countries as a natural resource blessing, while in others it has been referred to as a natural resource curse.[3] A vast body of resource curse literature has studied the role of governance regimes, legal frameworks and political risk in building an economy based on natural resource exploitation.[4][5][6] However, whether it is seen as a blessing or a curse, the recent political decisions regarding the future of petroleum production in many countries were given an extractivist direction, thus also granting a status quo to the exploitation of natural resources.[7] The PRIX index forecasts the effect of political developments on exports from major petroleum-producing countries.[8]
See also
References
- Ranking – The World Factbook
- "Data download".
- Sachs J. D.; Warner A.M. (2001). "The curse of natural resources" (PDF). European Economic Review. Vol. 4, no. 45. Archived from the original (PDF) on 2017-05-17. Retrieved 2016-07-13.
- Humphreys, M., Sachs, J. and Stiglitz, J. E. (2007). "Escaping the resource curse". European economic review. Cambridge University Press.
{{cite news}}: CS1 maint: multiple names: authors list (link) - Tietenberg, T. H.; Lewis, L. (2000). "Environmental and natural resource economics".
- Ross, M. L. (2003). "The natural resource curse: How wealth can make you poor". European Economic Review.
- Wilson, E.; Stammler, F. (2015). "Beyond extractivism and alternative cosmologies: Arctic communities and extractive industries in uncertain times". European Economic Review. Vol. 3, no. 1. pp. 1–8. doi:10.1016/j.exis.2015.12.001.
- "Nuclear Negotiations, Restructuring at Chevron and a New Political Risk Index for Oil Markets". Alberta Oil Magazine. 2015-06-29. Archived from the original on 2015-12-20. Retrieved 2015-09-26.