Prairie County, Montana
Prairie County is a county in the U.S. state of Montana. As of the 2020 census, the population was 1,088,[1] making it the fifth-least populous county in Montana. Its county seat is Terry.[2] Prairie County was created by the Montana Legislature in 1915 out of parts of Custer, Dawson, and Fallon Counties. The name was selected in a contest and reflects the predominant landscape of the region.[3]
Prairie County | |
|---|---|
 Downtown Terry, Montana during a typical snowy day. | |
 Location within the U.S. state of Montana | |
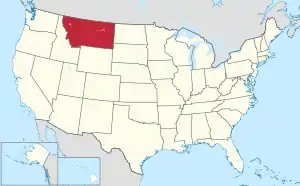 Montana's location within the U.S. | |
| Coordinates: 46°51′N 105°22′W | |
| Country | |
| State | |
| Founded | February 5, 1915 |
| Named for | Prairie landscape |
| Seat | Terry |
| Largest town | Terry |
| Area | |
| • Total | 1,743 sq mi (4,510 km2) |
| • Land | 1,737 sq mi (4,500 km2) |
| • Water | 5.8 sq mi (15 km2) 0.3% |
| Population (2020) | |
| • Total | 1,088 |
| • Estimate (2022) | 1,107 |
| • Density | 0.6/sq mi (0.2/km2) |
| Time zone | UTC−7 (Mountain) |
| • Summer (DST) | UTC−6 (MDT) |
| Congressional district | 2nd |
| Website | visitterrymt.com (Terry Chamber of Commerce) |
| |
The county was the site of the 1938 Custer Creek train wreck that killed 47 people and injured 75.
Geography
According to the United States Census Bureau, the county has a total area of 1,743 square miles (4,510 km2), of which 1,737 square miles (4,500 km2) is land and 5.8 square miles (15 km2) (0.3%) is water.[4]
Major highways
 Interstate 94
- Montana Highway 253
Adjacent counties
- McCone County - north
- Dawson County - northeast
- Wibaux County - east
- Fallon County - southeast
- Custer County - south
- Garfield County - west
Demographics
| Census | Pop. | Note | %± |
|---|---|---|---|
| 1920 | 3,684 | — | |
| 1930 | 3,941 | 7.0% | |
| 1940 | 2,410 | −38.8% | |
| 1950 | 2,377 | −1.4% | |
| 1960 | 2,318 | −2.5% | |
| 1970 | 1,752 | −24.4% | |
| 1980 | 1,836 | 4.8% | |
| 1990 | 1,383 | −24.7% | |
| 2000 | 1,199 | −13.3% | |
| 2010 | 1,179 | −1.7% | |
| 2020 | 1,088 | −7.7% | |
| 2022 (est.) | 1,107 | [5] | 1.7% |
| U.S. Decennial Census[6] 1790-1960[7] 1900-1990[8] 1990-2000[9] 2010-2020[1] | |||
2020 census
As of the census of 2000, there were 1,088 people.
2010 census
As of the census of 2010, there were 1,179 people, 551 households, and 342 families in the county. The population density was 0.7 inhabitants per square mile (0.27/km2). There were 673 housing units at an average density of 0.4 per square mile (0.15/km2). The racial makeup of the county was 96.4% white, 0.5% Asian, 0.2% American Indian, 0.2% from other races, and 2.8% from two or more races. Those of Hispanic or Latino origin made up 1.4% of the population. In terms of ancestry, 44.7% were German, 18.6% were Norwegian, 14.1% were American, 11.8% were Irish, and 9.5% were English.
Of the 551 households, 18.5% had children under the age of 18 living with them, 55.9% were married couples living together, 4.2% had a female householder with no husband present, 37.9% were non-families, and 34.1% of all households were made up of individuals. The average household size was 2.10 and the average family size was 2.67. The median age was 53.6 years.
The median income for a household in the county was $34,896 and the median income for a family was $43,500. Males had a median income of $28,438 versus $21,964 for females. The per capita income for the county was $21,296. About 12.4% of families and 16.9% of the population were below the poverty line, including 34.6% of those under age 18 and 14.5% of those age 65 or over.
Politics
Voters in Prairie County have voted for Republican Party candidates in all national elections since 1948 (as of 2020).
| Year | Republican | Democratic | Third party | |||
|---|---|---|---|---|---|---|
| No. | % | No. | % | No. | % | |
| 2020 | 603 | 81.05% | 126 | 16.94% | 15 | 2.02% |
| 2016 | 556 | 80.70% | 100 | 14.51% | 33 | 4.79% |
| 2012 | 520 | 73.97% | 167 | 23.76% | 16 | 2.28% |
| 2008 | 503 | 68.44% | 211 | 28.71% | 21 | 2.86% |
| 2004 | 546 | 74.18% | 181 | 24.59% | 9 | 1.22% |
| 2000 | 541 | 72.52% | 164 | 21.98% | 41 | 5.50% |
| 1996 | 417 | 53.46% | 259 | 33.21% | 104 | 13.33% |
| 1992 | 412 | 48.13% | 260 | 30.37% | 184 | 21.50% |
| 1988 | 541 | 60.11% | 343 | 38.11% | 16 | 1.78% |
| 1984 | 693 | 69.93% | 289 | 29.16% | 9 | 0.91% |
| 1980 | 580 | 62.57% | 283 | 30.53% | 64 | 6.90% |
| 1976 | 597 | 58.59% | 415 | 40.73% | 7 | 0.69% |
| 1972 | 685 | 68.57% | 303 | 30.33% | 11 | 1.10% |
| 1968 | 635 | 67.77% | 270 | 28.82% | 32 | 3.42% |
| 1964 | 555 | 52.96% | 488 | 46.56% | 5 | 0.48% |
| 1960 | 649 | 65.75% | 338 | 34.25% | 0 | 0.00% |
| 1956 | 637 | 61.25% | 403 | 38.75% | 0 | 0.00% |
| 1952 | 771 | 69.21% | 338 | 30.34% | 5 | 0.45% |
| 1948 | 499 | 47.89% | 527 | 50.58% | 16 | 1.54% |
| 1944 | 598 | 55.68% | 468 | 43.58% | 8 | 0.74% |
| 1940 | 597 | 51.42% | 554 | 47.72% | 10 | 0.86% |
| 1936 | 454 | 33.31% | 877 | 64.34% | 32 | 2.35% |
| 1932 | 634 | 45.71% | 732 | 52.78% | 21 | 1.51% |
| 1928 | 968 | 70.20% | 405 | 29.37% | 6 | 0.44% |
| 1924 | 683 | 56.21% | 162 | 13.33% | 370 | 30.45% |
| 1920 | 881 | 76.68% | 242 | 21.06% | 26 | 2.26% |
| 1916 | 535 | 45.38% | 622 | 52.76% | 22 | 1.87% |
See also
References
- "State & County QuickFacts". United States Census Bureau. Retrieved May 7, 2023.
- "Find a County". National Association of Counties. Retrieved June 7, 2011.
- "Montana Place Names Companion". Montana Place Names From Alzada to Zortman. Montana Historical Society Research Center. Retrieved May 9, 2011.
- "2010 Census Gazetteer Files". United States Census Bureau. August 22, 2012. Archived from the original on December 5, 2014. Retrieved November 29, 2014.
- "Annual Estimates of the Resident Population for Counties: April 1, 2020 to July 1, 2022". Retrieved May 7, 2023.
- "U.S. Decennial Census". United States Census Bureau. Retrieved November 29, 2014.
- "Historical Census Browser". University of Virginia Library. Retrieved November 29, 2014.
- "Population of Counties by Decennial Census: 1900 to 1990". United States Census Bureau. Retrieved November 29, 2014.
- "Census 2000 PHC-T-4. Ranking Tables for Counties: 1990 and 2000" (PDF). United States Census Bureau. Archived (PDF) from the original on March 27, 2010. Retrieved November 29, 2014.
- Leip, David. "Atlas of US Presidential Elections". uselectionatlas.org. Retrieved April 3, 2018.
- Crow Rock MT Google Maps (accessed January 5, 2019)
- McCloud MT Google Maps (accessed January 5, 2019)
External links
Places adjacent to Prairie County, Montana | ||||||||||||||||
|---|---|---|---|---|---|---|---|---|---|---|---|---|---|---|---|---|
| ||||||||||||||||
Municipalities and communities of Prairie County, Montana, United States | ||
|---|---|---|
| Town | Prairie County map | |
| CDPs | ||
| Unincorporated communities | ||