Historical racial and ethnic demographics of the United States
The racial and ethnic demographics of the United States have changed dramatically throughout its history.
Sources of data
During the American colonial period, British colonial officials conducted censuses in some of the Thirteen Colonies that included enumerations by race.[1] In addition, tax lists and other reports provided additional data and information about the racial demographics of the Thirteen Colonies during this time period.[1]
People have been enumerated by race in every United States census since the first one in 1790.[2] Collection of data on race and ethnicity in the United States census has changed over time, including addition of new enumeration categories and changes in definitions of those categories.[2][3][4]
Historical trends
By 1471, Portuguese navigators hoping to tap the fabled Saharan gold trade had reconnoitered the West African coast as far as the Niger Delta, and traded European commodities for local crafts as well as slaves, the latter which turned out to be highly lucrative. The black population was non-existent to European regions in 1610, but awareness increased rapidly after 1620 when forced slavery of Africans was implemented building the Atlantic slave trade in the 15th century in colonial areas, Caribbean islands which later became parts of the United States. By 1490, more than 3,000 slaves a year were transported to Portugal and Spain from Africa[1] African Americans (Blacks) made up almost one-fifth of the United States population in 1790, but their percentage of the total U.S. population declined in almost every U.S. census until 1930.[5] From at least 1790 until the start of World War I, the overwhelming majority (around ninety percent) of African Americans[5] lived in the Southern United States.[6][7] In addition, before 1865, the overwhelming majority of African Americans were slaves.[5] The Great Migration throughout the 20th century (starting from World War I)[5][6] resulted in more than six million African Americans leaving the Southern U.S. (especially rural areas) and moving to other parts of the United States (especially to urban areas) due to the greater economic/job opportunities, less anti-black violence/lynchings,[8] and a smaller amount of segregation/discrimination there.[9][10] Due to the Great Migration, many large cities outside of the former Confederacy (such as New York City, Chicago, Detroit, and Cleveland) experienced huge increases in the African American percentage of their total population.[9]
Whites (including Non-Hispanic Whites) have historically made up the overwhelming majority (usually between eighty and ninety percent) of the total United States population.[5] The United States historically had few Hispanics, Asians, and Native Americans, especially before the late 20th century.[5] Most Asian Americans[5] historically lived in the Western United States.[11][12] The Hispanic and Asian population of the United States has rapidly increased in the late 20th and 21st centuries, and the African American percentage of the U.S. population is slowly increasing as well since reaching a low point of less than ten percent in 1930.[5]
Historical data for all races and for Hispanic origin (1610–2020)

The United States census enumerated Whites and Blacks since 1790, Asians and Native Americans since 1860 (though all Native Americans in the U.S. were not enumerated until 1890), "some other race" since 1950, and "two or more races" since 2000.[2] Mexicans were counted as White from 1790 to 1930, unless of apparent non-European extraction.[13] Hispanics (as well as the Non-Hispanic White population) were enumerated since 1940 (with the exception of 1950 and 1960), but some estimates for the Hispanic (and Non-Hispanic White) population were made for certain years before 1940 (as well as for 1950 and 1960).[2][14][15]
| Race/Ethnic Group | 1610 | 1620 | 1630 | 1640 | 1650 | 1660 | 1670 | 1680 | 1690 | 1700 | 1710 | 1720 | 1730 | 1740 | 1750 |
|---|---|---|---|---|---|---|---|---|---|---|---|---|---|---|---|
| Total Population | 350 | 2,302 | 4,646 | 26,634 | 50,368 | 75,058 | 111,935 | 151,507 | 210,372 | 250,888 | 331,711 | 466,185 | 629,445 | 905,563 | 1,170,760 |
| White | 350 | 2,282 | 4,586 | 26,037 | 48,768 | 72,138 | 107,400 | 144,536 | 193,643 | 223,071 | 286,845 | 397,346 | 538,424 | 755,539 | 934,340 |
| White (%) | 100.0% | 99.1% | 98.7% | 97.8% | 96.8% | 96.1% | 95.9% | 95.4% | 91.9% | 88.9% | 86.4% | 85.2% | 85.5% | 83.4% | 79.8% |
| Black (also called Negro) | 0 | 20 | 60 | 597 | 1,600 | 2,920 | 4,535 | 6,971 | 16,729 | 27,817 | 44,866 | 68,839 | 91,021 | 150,024 | 236,420 |
| Black/Negro (%) | 0.0% | 0.9% | 1.3% | 2.2% | 3.2% | 3.9% | 4.1% | 4.6% | 8.1% | 11.1% | 13.6% | 14.8% | 14.5% | 16.6% | 20.2% |
| Race/Ethnic Group | 1760 | 1770 | 1780 | 1790 | 1800 | 1810 | 1820 | 1830 | 1840 |
|---|---|---|---|---|---|---|---|---|---|
| Total Population | 1,593,625 | 2,148,076 | 2,780,369 | 3,929,214 | 5,308,483 | 7,239,881 | 9,638,453 | 12,860,702 | 17,063,353 |
| White | 1,267,819 | 1,688,254 | 2,204,949 | 3,172,006 | 4,306,446 | 5,862,073 | 7,866,797 | 10,532,060 | 14,189,705 |
| White % | 79.6 | 78.6 | 79.3 | 80.7 | 81.1 | 81.0 | 81.6 | 81.9 | 83.2 |
| Black (also called Negro) | 325,806 | 459,822 | 575,420 | 757,208 | 1,002,037 | 1,377,808 | 1,771,656 | 2,328,642 | 2,873,648 |
| Black/Negro % | 20.4 | 21.4 | 20.7 | 19.3 | 18.9 | 19.0 | 18.4 | 18.1 | 16.8 |
| Race/Ethnic Group | 1850 | 1860 | 1870 | 1880 | 1890 | 1900 | 1910 | 1920 |
|---|---|---|---|---|---|---|---|---|
| Total Population | 23,191,876 | 31,443,321 | 38,558,371 | 50,155,783 | 62,947,714 | 75,994,575 | 91,972,266 | 105,710,620 |
| White | 19,553,068 | 26,922,537 | 33,589,377 | 43,402,970 | 55,101,258 | 66,809,196 | 81,731,957 | 94,820,915 |
| Black | 3,638,808 | 4,441,830 | 4,880,009 | 6,580,793 | 7,488,676 | 8,833,994 | 9,827,763 | 10,463,131 |
| American Indian, Eskimo, and Aleut | 44,021[b] | 25,731[b] | 66,407[b] | 248,253 | 237,196 | 265,683 | 244,437 | |
| Asian and Pacific Islander | 34,933 | 63,254 | 105,613 | 109,527 | 114,189 | 146,863 | 182,137 | |
| Hispanic (of any race)[15] | 116,943 | 155,000[19] | 393,555 | 503,189 | 797,994[15] | 1,286,154[15] | ||
| Non-Hispanic White[15] | 19,438,451 | 43,065,679 | 66,374,317 | 81,043,248[15] | 93,604,612[15] |
| Race/Ethnic Group | 1930 | 1940 | 1950 | 1960 | 1970 | 1980 | 1990 | 2000[lower-alpha 1] | 2010 | 2020[lower-alpha 2] |
|---|---|---|---|---|---|---|---|---|---|---|
| Total Population | 122,775,046 | 131,669,275 | 150,697,361 | 179,323,175 | 203,210,158 | 226,545,805 | 248,709,873 | 281,421,906 | 308,745,538 | 331,449,281 |
| White | 110,286,740 | 118,214,870 | 134,942,028 | 158,831,732 | 178,119,221 | 188,371,622 | 199,686,070 | 211,460,626 | 223,553,265 | 204,277,273 |
| Black | 11,891,143 | 12,865,518 | 15,042,286 | 18,871,831 | 22,539,362 | 26,495,025 | 29,986,060 | 34,658,190 | 38,929,319 | 41,104,200 |
| American Indian, Eskimo, and Aleut | 332,397 | 333,969 | 343,410 | 551,669 | 795,110 | 1,420,400 | 1,959,234 | 2,475,956 | 2,932,248 | 3,727,135 |
| Asian and Pacific Islander | 264,766 | 254,918 | 321,033 | 980,337 | 1,526,401 | 3,500,439 | 7,273,662 | 10,641,833 | 15,214,265 | 20,576,015 |
| Some other race | 48,604 | 87,606 | 230,064 | 6,758,319 | 9,804,847 | 15,359,073 | 19,107,368 | 27,915,715 | ||
| Two or more races | 6,826,228 | 9,009,073 | 33,848,943 | |||||||
| Hispanic (of any race) | 2,021,820[15] | 3,231,409[15] | 5,814,784[15] | 8,920,940[15] | 14,608,673 | 22,354,059 | 35,305,818 | 50,477,594 | 62,080,044 | |
| Non-Hispanic White | 116,261,189[15] | 131,805,405[15] | 153,217,498[15] | 169,622,593[15] | 180,256,366 | 188,128,296 | 194,552,774 | 196,817,552 | 191,697,647 |
| Race/Ethnic Group | 1790 | 1800 | 1810 | 1820 | 1830 | 1840 | 1850 | 1860 | 1870 | 1880 | 1890 | 1900 |
|---|---|---|---|---|---|---|---|---|---|---|---|---|
| White | 80.7% | 81.1% | 81.0% | 81.6% | 81.9% | 83.2% | 84.3% | 85.6% | 87.1% | 86.5% | 87.5% | 87.9% |
| Black | 19.3% | 18.9% | 19.0% | 18.4% | 18.1% | 16.8% | 15.7% | 14.1% | 12.7% | 13.1% | 11.9% | 11.6% |
| American Indian, Eskimo, and Aleut | 0.1%[b] | 0.1%[b] | 0.1%[b] | 0.4% | 0.3% | |||||||
| Asian and Pacific Islander | 0.1% | 0.2% | 0.2% | 0.2% | 0.2% | |||||||
| Hispanic (of any race) | 0.5% | 0.8% | 0.7% | |||||||||
| Non-Hispanic White | 83.8% | 85.9% | 87.3% |
| Race/Ethnic Group | 1910 | 1920 | 1930 | 1940 | 1950 | 1960 | 1970 | 1980 | 1990 | 2000[lower-alpha 3] | 2010 | 2020[lower-alpha 4] |
|---|---|---|---|---|---|---|---|---|---|---|---|---|
| White | 88.9% | 89.7% | 89.8% | 89.8% | 89.5% | 88.6% | 87.7% | 83.1% | 80.3% | 75.1% | 72.4% | 61.6% |
| Black | 10.7% | 9.9% | 9.7% | 9.8% | 10.0% | 10.5% | 11.1% | 11.7% | 12.1% | 12.3% | 12.6% | 12.4% |
| Native | 0.3% | 0.2% | 0.3% | 0.3% | 0.2% | 0.3% | 0.4% | 0.6% | 0.8% | 0.9% | 0.9% | 1.1% |
| Asian | 0.2% | 0.2% | 0.2% | 0.2% | 0.2% | 0.5% | 0.8% | 1.5% | 2.9% | 3.8% | 4.9% | 6.2% |
| Other race | 0.0% | 0.0% | 0.1% | 3.0% | 3.9% | 5.5% | 6.2% | 8.4% | ||||
| Two or more races | 2.4% | 2.9% | 10.2% | |||||||||
| Hispanic (of any race) | 0.9% | 1.2% | 1.5% | 2.1% | 3.2% | 4.4% | 6.4% | 9.0% | 12.5% | 16.3% | 18.7% | |
| Non-Hispanic White | 88.1% | 88.5% | 88.3% | 87.5% | 85.4% | 83.5% | 79.6% | 75.6% | 69.1% | 63.7% | 57.8% |
a^ These population estimates include a small number of Native Americans/Indians as part of the Black/Negro population throughout this time period (1610–1780).[1]
b^ While all Native Americans in the United States were only counted as part of the (total) U.S. population since 1890, the U.S. Census Bureau previously either enumerated or made estimates of the non-taxed Native American population (which was not counted as a part of the U.S. population before 1890) for the 1860–1880 time period. The combined taxed and non-taxed Native American population in the United States was 339,421 in 1860, 313,712 in 1870, and 306,543 in 1880.[20]
c^ Data on race from the 2000 and 2010 U.S. Censuses are not directly comparable with those from the 1990 census and previous censuses due, in large part, to giving respondents the option to report more than one race.[21] This is also true of data from the 2020 census, which saw a large number of respondents who had previously only identified as one race identify as multiracial.[22]
Population by race and age (Census 2010 and Census 2020)
Census 2010
| USA (100%) | Not Hispanic or Latino | Hispanic or Latino | White alone | White alone, not Hispanic or Latino | White alone, Hispanic or Latino | Black or African American alone | Black or African American alone, not Hispanic or Latino | Black or African American alone, Hispanic or Latino | American Indian and Alaska Native alone | American Indian and Alaska Native alone, not Hispanic or Latino | American Indian and Alaska Native alone, Hispanic or Latino | Asian alone | Asian alone, not Hispanic or Latino | Asian alone, Hispanic or Latino | Native Hawaiian and Other Pacific Islander alone | Native Hawaiian and Other Pacific Islander alone, not Hispanic or Latino | Native Hawaiian and Other Pacific Islander alone, Hispanic or Latino | Some other race alone | Some other race alone, not Hispanic or Latino | Some other race alone, Hispanic or Latino | Two or more races | Two or more races, not Hispanic or Latino | Two or more races, Hispanic or Latino |
|---|---|---|---|---|---|---|---|---|---|---|---|---|---|---|---|---|---|---|---|---|---|---|---|
| 308 745 538 | 258 267 944 (83.65%) | 50 477 594 (16.35%) | 223 553 265 (72.41%) | 196 818 552 (63.75%) | 26 735 713 (8.66%) | 38 929 319 (12.61%) | 37 685 848 (12.21%) | 1 243 471 (0.40%) | 2 932 248 (0.95%) | 2 247 098 (0.73%) | 685 150 (0.22%) | 14 674 252 (4.75%) | 14 465 124 (4.69%) | 209 128 (0.07%) | 540 013 (0.17%) | 481 576 (0.16%) | 58 437 (0.02%) | 19 107 368 (6.19%) | 604 265 (0.20%) | 18 503 103 (5.99%) | 9 009 073 (2.92%) | 5 966 481 (1.93%) | 3 042 592 (0.99%) |
| Age group | USA 100% (percent of the population) | Not Hispanic or Latino 83.65% | Hispanic or Latino 16.35% | White alone 72.41% (percent in the race/percent in the age group) | White alone, not Hispanic or Latino 63.75% (percent in the race/percent in the age group) | Black or African American alone 12.61% (percent in the race/percent in the age group) | American Indian and Alaska Native alone 0.95% (percent in the race/percent in the age group) | Asian alone 4.75% (percent in the race/percent in the age group) | Native Hawaiian and Other Pacific Islander alone 0.17% (percent in the race/percent in the age group) | Some Other Race Alone 6.19% (percent in the race/percent in the age group) | Mixed (Two or More Races) 2.92% (percent in the race/percent in the age group) |
|---|---|---|---|---|---|---|---|---|---|---|---|
| Population | 308 745 538 | 258 267 944 | 50 477 594 | 223 553 265 | 196 817 552 | 38 929 319 | 2 932 248 | 14 674 252 | 540 013 | 19 107 368 | 9 009 073 |
| 0–4 | 20 201 362 (6.54%) | 15 086 874 (5.84%/74/68%) | 5 114 488 (10.13%/25.32%) | 12 795 675 (5.72%/63.34%) | 10 254 079 (5.21%/50.76%) | 2 902 590 (7.46%/14.37%) | 244 615 (8.34%/1.21%) | 898 011 (6.12%/4.45%) | 44 991 (8.33%/0.22%) | 1 917 696 (10.04%/9.49%) | 1 397 784 (15.52%/6.92%) |
| 5–9 | 20 348 657 (6.59%) | 15 557 886 (6.02%/76.46%) | 4 790 771 (9.49%/23.54%) | 13 293 799 (5.95%/65.33%) | 10 838 062 (5.51%/53.26%) | 2 882 597 (7.40%/14.17%) | 243 259 (8.30%/1.20%) | 928 248 (6.33%/4.56%) | 43 267 (8.01%/0.21%) | 1 784 074 (9.34%/8.77%) | 1 173 413 (13.02%/5.77%) |
| 10–14 | 20 677 194 (6.70%) | 16 151 952 (6.25%/78.11%) | 4 525 242 (8.96%/21.89%) | 13 737 332 (6.14%/66.44%) | 11 403 383 (5.79%/55.15%) | 3 034 266 (7.79%/14.67%) | 245 049 (8.36%/1.19%) | 881 590 (6.01%/4.26%) | 42 387 (7.85%/0.20%) | 1 701 946 (8.91%/8.23%) | 1 034 624 (11.48%/5.00%) |
| 15–19 | 22 040 343 (7.14%) | 17 508 188 (6.78%/79.44%) | 4 532 155 (8.98%/20.56%) | 14 620 638 (6.54%/66.35%) | 12 341 592 (6.27%/56.00%) | 3 448 051 (8.86%/15.64%) | 263 805 (9.00%/1.20%) | 956 028 (6.52%/4.34%) | 47 250 (8.75%/0.21%) | 1 791 783 (9.38%/8.13%) | 912 788 (10.13%/4.14%) |
| 20–24 | 21 585 999 (6.99%) | 17 263 724 (6.68%/79.98%) | 4 322 275 (8.56%/20.02%) | 14 535 947 (6.50%/67.34%) | 12 426 842 (6.31%/57.57%) | 3 111 397 (7.99%/14.41%) | 240 716 (8.21%/1.12%) | 1 106 222 (7.54%/5.12%) | 52 750 (9.77%/0.24%) | 1 818 734 (9.52%/8.43%) | 720 233 (7.99%/3.34%) |
| 25–29 | 21 101 849 (6.83%) | 16 791 378 (6.50%/79.57%) | 4 310 471 (8.54%/20.43%) | 14 345 364 (6.42%/67.98%) | 12 226 930 (6.21%/57.94%) | 2 786 254 (7.16%/13.20%) | 221 654 (7.56%/1.05%) | 1 234 322 (8.41%/5.85%) | 49 912 (9.24%/0.24%) | 1 835 212 (9.60%/8.70%) | 629 131 (6.98%/2.98%) |
| 30–34 | 19 962 099 (6.47%) | 15 837 616 (6.13%/79.34%) | 4 124 483 (8.17%/20.66%) | 13 573 270 (6.07%/68.00%) | 11 495 910 (5.84%/57.59%) | 2 627 925 (6.75%/13.16%) | 202 928 (6.92%/1.02%) | 1 240 906 (8.46%/6.22%) | 43 748 (8.10%/0.22%) | 1 720 443 (9.00%/8.62%) | 552 879 (6.14%/2.77%) |
| 35–39 | 20 179 642 (6.54%) | 16 323 302 (6.32%/80.89%) | 3 856 340 (7.64%/19.11%) | 13 996 797 (6.26%/69.36%) | 11 984 317 (6.09%/59.39%) | 2 613 389 (6.71%/12.95%) | 196 017 (6.68%/0.97%) | 1 296 301 (8.83%/6.42%) | 38 730 (7.17%/0.19%) | 1 549 506 (8.11%/7.68%) | 488 902 (5.43%/2.42%) |
| 40–44 | 20 890 964 (6.77%) | 17 448 564 (6.76%/83.52%) | 3 442 400 (6.82%/16.48%) | 15 052 798 (6.73%/72.05%) | 13 218 304 (6.72%/63.27%) | 2 669 034 (6.86%/12.78%) | 194 713 (6.64%/0.93%) | 1 155 565 (7.87%/5.53%) | 36 391 (6.74%/0.17%) | 1 345 601 (7.04%/6.44%) | 436 862 (4.85%/2.09%) |
| 45–49 | 22 708 591 (7.36%) | 19 686 517 (7.62%/86.69%) | 3 022 074 (5.99%/13.31%) | 17 028 255 (7.62%/74.99%) | 15 355 524 (7.80%/67.62%) | 2 828 657 (7.27%/12.46%) | 207 857 (7.09%/0.92%) | 1 076 060 (7.33%/4.74%) | 35 645 (6.60%/0.16%) | 1 117 950 (5.85%/4.92%) | 414 167 (4.60%/1.82%) |
| 50–54 | 22 298 125 (7.22%) | 19 856 671 (7.69%/89.05%) | 2 441 454 (4.84%/10.95%) | 17 178 632 (7.68%/77.04%) | 15 785 646 (8.02%/70.79%) | 2 694 247 (6.92%/12.08%) | 191 893 (6.54%/0.86%) | 980 282 (6.68%/4.40%) | 30 896 (5.72%/0.14%) | 861 811 (4.51%/3.86%) | 360 364 (4.00%/1.62%) |
| 55–59 | 19 664 805 (6.37%) | 17 823 373 (6.90%/90.64%) | 1 841 432 (3.65%/9.36%) | 15 562 187 (6.96%/79.14%) | 14 454 799 (7.34%/73.51%) | 2 205 820 (5.67%/11.22%) | 154 320 (5.26%/0.78%) | 844 490 (5.75%/4.29%) | 24 045 (4.45%/0.12%) | 594 671 (3.11%/3.02%) | 279 272 (3.10%/1.42%) |
| 60–64 | 16 817 924 (5.45%) | 15 445 539 (5.98%/91.84%) | 1 372 385 (2.72%/8.16%) | 13 693 334 (6.13%/81.42%) | 12 822 733 (6.52%/76.24%) | 1 686 695 (4.33%/10.03%) | 118 362 (4.04%/0.70%) | 689 601 (4.70%/4.10%) | 18 788 (3.48%/0.11%) | 401 947 (2.10%/2.39%) | 209 197 (2.32%/1.24%) |
| 65–69 | 12 435 263 (4.03%) | 11 486 687 (4.45%/92.37%) | 948 576 (1.88%/7.63%) | 10 313 002 (4.61%/82.93%) | 9 682 945 (4.92%/77.87%) | 1 162 577 (2.99%/9.35%) | 79 079 (2.70%/0.64%) | 474 327 (3.23%/3.81%) | 12 070 (2.24%/0.10%) | 252 195 (1.32%/2.03%) | 142 013 (1.58%/1.14%) |
| 70–74 | 9 278 166 (3.01%) | 8 578 024 (3.32%/92.45%) | 700 142 (1.39%/7.55%) | 7 740 932 (3.46%/83.43%) | 7 257 878 (3.69%/78.23%) | 852 317 (2.19%/9.19%) | 53 926 (1.84%/0.58%) | 354 268 (2.41%/3.82%) | 8 149 (1.51%/0.09%) | 169 574 (0.89%/1.83%) | 99 000 (1.10%/1.07%) |
| 75–79 | 7 317 795 (2.37%) | 6 806 987 (2.64%/93.02%) | 510 808 (1.01%/6.98%) | 6 224 569 (2.78%/85.06%) | 5 861 366 (2.98%/80.10%) | 616 789 (1.58%/8.43%) | 35 268 (1.20%/0.48%) | 251 210 (1.71%/3.43%) | 5 363 (0.99%/0.07%) | 114 114 (0.60%/1.56%) | 70 482 (0.78%/0.96%) |
| 80–84 | 5 743 327 (1.86%) | 5 391 839 (2.09%/93.88%) | 351 488 (0.70%/6.12%) | 5 002 427 (2.24%/87.10%) | 4 746 881 (2.41%/82.65%) | 424 592 (1.09%/7.39%) | 21 963 (0.75%/0.38%) | 168 879 (1.15%/2.94%) | 3 217 (0.60%/0.06%) | 74 076 (0.39%/1.29%) | 48 173 (0.53%/0.84%) |
| 85-89 | 3 620 459 (1.17%) | 3 435 031 (1.33%/94.88%) | 185 428 (0.37%/5.12%) | 3 203 863 (1.43%/88.49%) | 3 068 224 (1.56%/84.75%) | 244 879 (0.63%/6.76%) | 11 362 (0.39%/0.31%) | 93 136 (0.63%/2.57%) | 1 623 (0.30%/0.04%) | 38 644 (0.20%/1.07%) | 26 952 (0.30%/0.74%) |
| 90-94 | 1 448 366 (0.47%) | 1 383 837 (0.54%/95.54%) | 64 529 (0.13%/4.46%) | 1 286 351 (0.58%/88.81%) | 1 238 874 (0.63%/85.54%) | 99 949 (0.26%/6.90%) | 4 082 (0.14%/0.28%) | 34 632 (0.24%/2.39%) | 566 (0.10%/0.04%) | 13 058 (0.07%/0.90%) | 9 728 (0.11%/0.67%) |
| 95-99 | 371 244 (0.12%) | 353 680 (0.14%/95.27%) | 17 564 (0.03%/4.73%) | 324 094 (0.14%/87.30%) | 311 350 (0.16%/83.87%) | 30 778 (0.08%/8.29%) | 1 125 (0.04%/0.30%) | 8 850 (0.06%/2.38%) | 181 (0.03%/0.05%) | 3 655 (0.02%/0.98%) | 2 561 (0.03%/0.69%) |
| 100+ | 53 364 (0.02%) | 50 275 (0.02%/94.21%) | 3 089 (0.01%/5.79%) | 43 999 (0.02%/82.45%) | 41 913 (0.02%/78.54%) | 6 516 (0.02%/12.21%) | 255 (0.01%/0.48%) | 1 324 (0.01%/2.48%) | 44 (0.01%/0.08%) | 678 (<0.01%/1.27%) | 548 (0.01%/1.03%) |
| 0-14 | 61 227 213 (19.83%) | 46 796 712 (18.12%/76.43%) | 14 430 501 (28.59%/23.57%) | 39 826 806 (17.82%/65.05%) | 32 495 524 (16.51%/53.07%) | 8 819 453 (22.66%/14.40%) | 732 923 (25.00%/1.20%) | 2 707 849 (18.45%/4.42%) | 130 645 (24.19%/0.21%) | 5 403 716 (28.28%/8.83%) | 3 605 821 (40.02%/5.89%) |
| 15-64 | 207 250 341 (6.13%) | 173 984 872 (67.37%/83.95%) | 33 265 469 (65.90%/16.05%) | 149 587 222 (66.91%/72.18%) | 132 112 597 (67.12%/63.75%) | 26 671 469 (68.51%/12.87%) | 1 992 265 (67.94%/0.96%) | 10 579 777 (72.10%/5.10%) | 378 155 (70.03%/0.18%) | 13 037 658 (68.23%/6.29%) | 5 003 795 (55.54%/2.41%) |
| 65+ | 40 267 984 (13.04%) | 37 486 360 (14.51%/93.09%) | 2 781 624 (5.51%/6.91%) | 34 139 237 (15.27%/84.78%) | 32 209 431 (16.37%/79.99%) | 3 438 397 (8.83%/8.54%) | 207 060 (7.06%/0.51%) | 1 386 626 (9.45%/3.44%) | 31 213 (5.78%0.08%)) | 665 994 (3.49%/1.65%) | 399 457 (4.43%/0.99%) |
Census 2020 [23]
| USA 100% (percent of the population) | Not Hispanic or Latino | Hispanic or Latino | White alone | White alone, not Hispanic or Latino | White alone, Hispanic or Latino | Black or African American alone | Black or African American alone, not Hispanic or Latino | Black or African American alone, Hispanic or Latino | American Indian and Alaska Native alone | American Indian and Alaska Native alone, not Hispanic or Latino | American Indian and Alaska Native alone, Hispanic or Latino | Asian alone | Asian alone, not Hispanic or Latino | Asian alone, Hispanic or Latino | Native Hawaiian and Other Pacific Islander alone | Native Hawaiian and Other Pacific Islander alone, not Hispanic or Latino | Native Hawaiian and Other Pacific Islander alone, Hispanic or Latino | Some other race alone | Some other race alone, not Hispanic or Latino | Some other race alone, Hispanic or Latino | Two or more races | Two or more races, not Hispanic or Latino | Two or more races, Hispanic or Latino |
|---|---|---|---|---|---|---|---|---|---|---|---|---|---|---|---|---|---|---|---|---|---|---|---|
| 331 449 281 | 269 369 237 (81.27%) | 62 080 044 (18.73%) | 204 277 273 (61.63%) | 191 697 647 (57.84%) | 12 579 626 (3.80%) | 41 104 200 (12.40%) | 39 940 338 (12.05%) | 1 163 862 (0.35%) | 3 727 135 (1.12%) | 2 251 699 (0.68%) | 1 475 436 (0.45%) | 19 886 049 (6.00%) | 19 618 719 (5.92%) | 267 330 (0.08%) | 689 966 (0.21%) | 622 018 (0.19%) | 67 948 (0.02%) | 27 915 715 (8.42%) | 1 689 833 (0.51%) | 26 225 882 (7.91%) | 33 848 943 (10.21%) | 13 548 983 (4.09%) | 20 299 960 (6.12%) |
| Age group | USA 100% (percent of the population) | Not Hispanic or Latino 81.27% (percent in the race/percent in the age group) | Hispanic or Latino 18.73% (percent in the race/percent in the age group) | White alone 61.63% (percent in the race/percent in the age group) | White alone, not Hispanic or Latino 57.84% (percent in the race/percent in the age group) | Black or African American alone 12.40% (percent in the race/percent in the age group) | American Indian and Alaska Native alone 1.12% (percent in the race/percent in the age group) | Asian alone 6.00% (percent in the race/percent in the age group) | Native Hawaiian and Other Pacific Islander alone 0.21% (percent in the race/percent in the age group) | Some Other Race Alone 8.42% (percent in the race/percent in the age group) | Mixed (Two or More Races) 10.21% (percent in the race/percent in the age group) |
|---|---|---|---|---|---|---|---|---|---|---|---|
| Population | 331 449 281 | 269 369 237 | 62 080 044 | 204 277 273 | 191 697 647 | 41 104 200 | 3 727 135 | 19 886 049 | 689 966 | 27 915 715 | 33 848 943 |
| 0–4 | 18 400 235 (5.55%) | 13 764 537 (5.11%/74.81%) | 4 635 698 (7.47%/25.19%) | 9 686 569 (4.74%/52.64%) | 8 641 422 (4.51%/46.96%) | 2 576 372 (6.27%/14.00%) | 237 635 (6.38%/1.29%) | 1 015 153 (5.10%/5.52%) | 52 195 (7.56%/0.28%) | 1 938 789 (6.95%/10.54%) | 2 893 522 (8.55%/15.73%) |
| 5–9 | 20 130 423 (6.07%) | 14 994 890 (5.57%/74.49%) | 5 135 533 (9.27%/25.51%) | 10 593 278 (5.19%/52.62%) | 9 483 892 (4.95%/47.11%) | 2 804 298 (6.82%/13.93%) | 274 115 (7.35%/1.36%) | 1 133 658 (5.70%/5.63%) | 55 779 (8.08%/0.28%) | 2 236 415 (8.01%/11.11%) | 3 032 880 (8.96%/15.07%) |
| 10–14 | 21 627 830 (6.53%) | 15 952 544 (5.92%/73.76%) | 5 675 286 (9.14%/26.24%) | 11 452 928 (5.61%/52.95%) | 10 177 287 (5.31%/47.06%) | 3 019 199 (7.35%/13.96%) | 310 224 (8.32%/1.43%) | 1 152 734 (5.80%/5.33%) | 54 764 (7.94%/0.25%) | 2 402 304 (8.61%/11.11%) | 3 235 677 (9.56%/14.96%) |
| 15–19 | 22 036 076 (6.65%) | 16 510 072 (6.13%/74.92%) | 5 526 004 (8.90%/25.08%) | 11 982 152 (5.87%/54.38%) | 10 765 694 (5.62%/48.85%) | 3 050 376 (7.42%/13.84%) | 309 596 (8.31%/1.40%) | 1 242 406 (6.25%/5.60%) | 56 215 (8.15%/0.26%) | 2 398 762 (8.59%/10.89%) | 2 996 569 (8.85%/13.60%) |
| 20–24 | 22 166 199 (6.69%) | 17 008 223 (6.21%/76.73% | 5 157 976 (8.21%/23.27%) | 12 437 316 (6.09%/56.11%) | 11 283 786 (5.89%/50.91%) | 3 023 526 (7.36%/13.64%) | 278 193 (7.46%/1.26%) | 1 460 719 (7.35%/6.59%) | 60 112 (8.71%/0.27%) | 2 324 083 (8.33%/10.48%) | 2 582 250 (7.63%/11.65%) |
| 25–29 | 22 301 254 (6.73%) | 17 349 730 (6.44%/77.80%) | 4 951 524 (7.98%/22.20%) | 12 616 069 (6.18%/56.57%) | 11 546 876 (6.02%/51.78%) | 3 061 013 (7.45%/13.73%) | 279 595 (7.50%/1.25%) | 1 582 493 (7.96%/7.10%) | 59 286 (8.59%/0.27%) | 2 297 655 (8.23%/10.30%) | 2 405 143 (7.11%/10.78%) |
| 30–34 | 22 533 412 (6.80%) | 17 844 727 (6.62%/79.19%) | 4 688 685 (7.55%/20.81%) | 13 026 207 (6.38%/57.81%)) | 12 075 227 (6.30%/53.59%) | 2 969 687 (7.22%/13.18%) | 278 721 (7.48%/1.24%) | 1 672 867 (8.41%/7.42%) | 56 576 (8.20%/0.25%) | 2 235 382 (8.01%/9.92%) | 2 293 972 (6.78%/10.18%) |
| 35–39 | 21 874 944 (6.60%) | 17 369 972 (6.45%/79.41%) | 4 504 972 (7.26%/20.59%) | 12 743 485 (6.24%/58.26%) | 11 902 069 (6.21%/54.41%) | 2 765 895 (6.73%/12.64%) | 270 905 (7.27%/1.24%) | 1 629 404 (8.19%/7.45%) | 51 671 (7.49%/0.24%) | 2 202 751 (7.89%/10.07%) | 2 210 833 (6.53%/10.11%) |
| 40–44 | 20 309 193 (6.13%) | 16 099 345 (5.98%/79.27%) | 4 209 848 (6.78%/20.73%) | 11 808 166 (5.78%/58.14%) | 11 076 509 (5.78%/54.54%) | 2 577 747 (6.27%/12.69%) | 252 676 (6.78%/1.24%) | 1 476 878 (7.43%/7.27%) | 45 233 (6.56%/0.22%) | 2 073 568 (7.43%/10.21%) | 2 074 925 (6.13%/10.22%) |
| 45–49 | 20 145 294 (6.08%) | 16 304 070 (6.05%/80.93%) | 3 841 224 (6.19%/19.07%) | 12 069 163 (5.91%/59.91%) | 11 424 988 (5.96%/56.71%) | 2 509 695 (6.11%/12.46%) | 236 609 (6.35%/1.17%) | 1 467 397 (7.38%/7.28%) | 39 597 (5.74%/0.20%) | 1 842 345 (6.60%/9.15%) | 1 980 488 (5.85%/9.83%) |
| 50–54 | 20 723 512 (6.25%) | 17 273 565 (6.41%/83.35%) | 3 449 947 (5.56%/16.65%) | 13 134 513 (6.43%/63.38%) | 12 557 076 (6.55%/60.59%) | 2 549 708 (6.20%/12.30%) | 223 614 (6.00%/1.08%) | 1 298 154 (6.53%/6.26%) | 37 422 (5.42%/0.18%) | 1 632 564 (5.85%/7.88%) | 1 847 537 (5.46%/8.92%) |
| 55–59 | 22 120 489 (6.67%) | 19 133 893 (7.10%/86.50%) | 2 986 596 (4.81%/13.50%) | 14 956 116 (7.32%/67.61%) | 14 435 865 (7.53%/65.26%) | 2 636 046 (6.41%/11.92%) | 219 800 (5.90%/0.99%) | 1 172 120 (5.89%/5.30%) | 34 986 (5.07%/0.16%) | 1 353 154 (4.85%/6.12%) | 1 748 267 (5.16%/7.90%) |
| 60–64 | 21 287 919 (6.42%) | 18 899 805 (7.02%/88.78%) | 2 388 114 (3.85%/11.22%) | 15 048 564 (7.37%/70.69%) | 14 621 335 (7.63%/68.68%) | 2 438 691 (5.93%/11.46%) | 190 119 (5.10%/0.89%) | 1 052 529 (5.29%/4.94%) | 29 426 (4.26%/0.14%) | 1 059 079 (3.79%/4.98%) | 1 469 511 (4.34%/6.90%) |
| 65–69 | 18 288 727 (5.52%) | 16 510 781 (6.13%/90.28%) | 1 777 946 (2.86%/9.72%) | 13 457 380 (6.59%/73.58%) | 13 122 655 (6.85%/71.75%) | 1 918 885 (4.67%/10.49%) | 142 308 (3.82%/0.78%) | 881 250 (4.43%/4.82%) | 22 043 (3.19%/0.12%) | 747 665 (2.68%/4.09%) | 1 119 196 (3.31%/6.12%) |
| 70–74 | 14 823 238 (4.47%) | 13 545 200 (5.03%/91.38%) | 1 278 038 (2.06%/8.62%) | 11 345 864 (5.55%/76.54%) | 11 086 087 (5.78%/74.79%) | 1 364 658 (3.32%/9.21%) | 99 720 (2.68%/0.67%) | 679 635 (3.42%/4.58%) | 15 378 (2.23%/0.10%) | 502 935 (1.80%/3.39%) | 815 048 (2.41%/5.50%) |
| 75–79 | 9 955 322 (3.00%) | 9 131 173 (3.39%/91.72%) | 824 149 (1.33%/8.28%) | 7 800 584 (3.82%/78.36%) | 7 620 790 (3.98%/76.55%) | 837 504 (2.04%/8.41%) | 59 602 (1.60%/0.60%) | 427 865 (2.15%/4.30%) | 9 181 (1.33%/0.09%) | 304 586 (1.09%/3.06%) | 516 000 (1.52%/5.18%) |
| 80–84 | 6 388 779 (1.93%) | 5 849 073 (2.17%/91.55%) | 539 706 (0.87%/8.45% | 5 027 743 (2.46%/78.70%) | 4 903 950 (2.56%/76.76%) | 522 055 (1.27%/8.17%) | 35 313 (0.95%/0.55%) | 281 676 (1.42%/4.41%) | 5 175 (0.75%/0.08%) | 190 529 (0.68%/2.98%) | 326 288 (0.96%/5.11%) |
| 85-89 | 3 829 179 (1.16%) | 3 515 522 (1.31%/91.81%) | 313 657 (0.51%/8.19%) | 3 063 946 (1.50%/80.02%) | 2 990 038 (1.56%/78.09%) | 292 426 (0.71%/7.64%) | 18 383 (0.49%/0.48%) | 158 781 (0.80%/4.15%) | 2 933 (0.43%/0.08%) | 106 620 (0.38%/2.78%) | 186 090 (0.55%/4.86%) |
| 90-94 | 1 876 291 (0.57%) | 1 730 890 (0.64%/92.25%) | 145 401 (0.23%/7.75%) | 1 525 362 (0.75%/81.30%) | 1 491 082 (0.78%/79.47%) | 134 450 (0.33%/7.17%) | 7 528 (0.20%/0.40%) | 73 783 (0.37%/3.93%) | 1 333 (0.19%/0.07%) | 48 881 (0.18%/2.61%) | 84 954 (0.25%/4.53%) |
| 95-99 | 550 826 (0.17%) | 508 390 (0.19%/92.30%) | 42 436 (0.07%/7.70%) | 442 084 (0.22%/80.26%) | 432 635 (0.23%/78.54%) | 43 739 (0.11%/7.94%) | 2 104 (0.06%/0.38%) | 22 835 (0.11%/4.15%) | 511 (0.07%/0.09%) | 15 132 (0.05%/2.75%) | 24 421 (0.07%/4.43%) |
| 100+ | 80 139 (0.02%) | 72 835 (0.03%/90.89%) | 7 304 (0.01%/9.11%) | 59 784 (0.03%/74.60%) | 58 384 (0.03%/72.85%) | 8 230 (0.02%/10.27%) | 375 (0.01%/0.47%) | 3 712 (0.02%/4.63%) | 150 (0.02%/0.19%) | 2 516 (0.01%/3.14%) | 5 372 (0.02%/6.70%) |
| 0-14 | 60 158 488 (18.15%) | 44 711 971 (16.60%/74.32%) | 15 446 517 (24.88%/25.68%) | 31 732 775 (15.53%/52.75%) | 28 302 601 (14.76%/47.05%) | 8 399 869 (20.44%/13.96%) | 821 974 (22.05%/1.37%) | 3 301 545 (16.60%/5.49%) | 162 738 (23.59%/0.27%) | 6 577 508 (23.56%/10.93%) | 9 162 079 (27.07%/15.23%) |
| 15-64 | 215 498 292 (65.02%) | 17 379 402 (64.52%/80.65%) | 41 704 890 (67.18%/19.35%) | 129 821 751 (63.55%/60.24%) | 121 689 425 (63.48%/56.47%) | 27 582 384 (67.10%/12.80%) | 2 539 828 (68.14%/1.18%) | 14 054 967 (70.68%/6.52%) | 470 524 (68.20%/0.22%) | 19 419 343 (69.56%/9.01%) | 21 609 495 (63.84%/10.03%) |
| 65+ | 55 792 501 (16.83%) | 50 863 864 (18.88%/91.16%) | 4 928 637 (7.94%/8.83%) | 42 722 747 (20.91%/76.57%) | 41 705 621 (21.76%/74.75%) | 5 121 947 (12.46%/9.18%) | 365 333 (9.80%/0.65%) | 2 529 537 (12.72%/4.53%) | 56 704 (8.22%/0.10%) | 1 918 864 (6.87%/3.44%) | 3 077 369 (9.09%/5.52%) |
Population by race (estimates)[24]
| Year | USA | White alone | White alone (Non-Hispanic) | Black alone | Black alone (Non-Hispanic) | Asian alone | American Indian and Alaska Native alone | Native Hawaiian and Other Pacific Islander alone | Some other race | Two or more races | White and Black | White and Asian | White and American Indian and Alaska Native | Black and American Indian and Alaska Native | Two or more races (Other) |
|---|---|---|---|---|---|---|---|---|---|---|---|---|---|---|---|
| 2010 | 309,349,689 | 229,397,472 (74.15%) | 196,929,412 (63.66%) | 38,874,625 (12.57%) | 37,897,524 (12.25%) | 14,728,302 (4.76%) | 2,553,566 (0.83%) | 507,916 (0.16%) | 14,889,440 (4.81%) | 8,398,368 (2.71%) | 2,028,521 (0.66%) | 1,558,860 (0.50%) | 1,705,454 (0.55%) | 289,341 (0.09%) | 2,816,192 (0.91%) |
| 2011 | 311 591 919 | 230 838 975 (74.08%) | 197 084 523 (63.25%) | 39,189,528 (12.58%) | 38,148,876 (12.24%) | 15 020 419 (4.82%) | 2 547 006 (0.82%) | 506 017 (0.16%) | 14 768 156 (4.74%) | 8 721 818 (2.80%) | 2 174 782 (0.70%) | 1 652 866 (0.53%) | 1 734 245 (0.56%) | 302 250 (0.10%) | 2 857 675 (0.92%) |
| 2012 | 313 914 040 | 231 992 377 (73.90%) | 197 243 423 (62.83%) | 39,623,138 (12.62%) | 38,464,192 (12.25%) | 15 555 530 (4.96%) | 2 563 505 (0.82%) | 543 198 (0.17%) | 14 562 678 (4.64%) | 9 073 614 (2.89%) | 2 275 588 (0.72%) | 1 733 309 (0.55%) | 1 799 343 (0.57%) | 316 788 (0.10%) | 2 948 586 (0.94%) |
| 2013 | 316 128 839 | 232 969 901 (73.70%) | 197 392 411 (62.44%) | 39,919,371 (12.63%) | 38,807,755 (12.28%) | 16 012 120 (5.07%) | 2 521 131 (0.80%) | 525 750 (0.17%) | 14 811 025 (4.69%) | 9 369 541 (2.96%) | 2 408 065 (0.76%) | 1 840 160 (0.58%) | 1 832 055 (0.58%) | 318 286 (0.10%) | 2 970 975 (0.94%) |
| 2014 | 318 857 056 | 233 963 128 (73.38%) | 197 409 353 (61.91%) | 40,379,066 (12.66%) | 39,267,149 (12.31%) | 16 686 960 (5.23%) | 2 601 714 (0.82%) | 557 154 (0.17%) | 15 063 263 (4.72%) | 9 605 771 (3.01%) | 2 518 746 (0.79%) | 1 929 461 (0.61%) | 1 881 024 (0.59%) | 312 454 (0.10%) | 2 964 086 (0.93%) |
| 2015 | 321 418 821 | 234 940 100 (73.09%) | 197 534 496 (61.46%) | 40,695,277 (12.66%) | 39,597,600 (12.32%) | 17 273 777 (5.37%) | 2 597 249 (0.81%) | 554 946 (0.17%) | 15 375 942 (4.78%) | 9 981 530 (3.11%) | 2 654 878 (0.83%) | 2 038 169 (0.63%) | 1 911 158 (0.59%) | 305 975 (0.10%) | 3 071 350 (0.96%) |
| 2016 | 323 127 515 | 234 644 039 (72.62%) | 197 479 450 (61.12%) | 40,893,369 (12.66%) | 39,717,127 (12.29%) | 17 556 935 (5.43%) | 2 676 399 (0.83%) | 595 986 (0.18%) | 16 334 352 (5.06%) | 10 426 435 (3.23%) | 2 818 186 (0.87%) | 2 168 592 (0.67%) | 1 926 535 (0.60%) | 333 113 (0.10%) | 3 180 009 (0.98%) |
| 2017 | 325 719 178 | 235 507 457 (72.30%) | 197 285 202 (60.57%) | 41,393,491 (12.71%) | 40,129,593 (12.32%) | 18 215 328 (5.59%) | 2 726 278 (0.84%) | 608 219 (0.19%) | 16 552 940 (5.08%) | 10 715 465 (3.29%) | 2 965 541 (0.91%) | 2 230 662 (0.68%) | 1 908 749 (0.59%) | 316 918 (0.10%) | 3 293 595 (1.01%) |
| 2018 | 327 167 439 | 236 173 020 (72.19%) | 197 033 939 (60.22%) | 41,617,764 (12.72%) | 40,305,870 (12.32%) | 18 415 198 (5.63%) | 2 801 587 (0.86%) | 626 054 (0.19%) | 16 253 785 (4.97%) | 11 280 031 (3.45%) | 3 179 968 (0.97%) | 2 454 776 (0.75%) | 1 886 971 (0.58%) | 311 267 (0.10%) | 3 447 049 (1.05%) |
| 2019 | 328 239 523 | 236 475 401 (72.04%) | 196 789 401 (59.95%) | 41,989,671 (12.79%) | 40,596,040 (12.37%) | 18 636 984 (5.68%) | 2 847 336 (0.87%) | 628 683 (0.19%) | 16 352 553 (4.98%) | 11 308 895 (3.45%) | 3 276 186 (1.00%) | 2 502 591 (0.76%) | 1 845 910 (0.56%) | 298 099 (0.09%) | 3 386 109 (1.03%) |
Black population (2000 and 2010)
| Black group | 2000 | 2010 |
|---|---|---|
| Black alone (% in USA) | 34 658 190 (12.32%) | 38 929 319 (12.61%) |
| Black in combination with other races (% in USA/% in group) | 1 761 244 (0.63%/4.84%) | 3 091 424 (1.00%/7.36%) |
| Black alone or in combination with other races (% in USA) | 36 419 434 (12.94%) | 42 020 743 (13.61%) |
| Black alone (Not Hispanic) (% of Blacks) | 33 947 837 (97.95%) | 37 685 848 (96.81%) |
| Black in combination with other races (Not Hispanic) (% in this group/% in their group) | 1 435 914 (81.53%/4.06%) | 2 437 677 (78.85%/6.08%) |
| Black alone or in combination with other races (Not Hispanic) (% in USA) | 35 383 751 (12.57%) | 40 123 525 (13.00%) |
| Black alone (Hispanic) (% of Blacks) | 710 353 (2.05%) | 1 243 471 (3.19%) |
| Black in combination with other races (Hispanic) (% in this group/% in their group) | 325 330 (18.47%/31.41%) | 653 747 (21.15%/34.46%) |
| Black alone or in combination with other races (Hispanic) (% in USA) | 1 035 683 (0.37%) | 1 897 218 (0.61%) |
Hispanic or Latino (Estimates)
Hispanic population (2000 and 2010)
| Hispanic group | 2000 (% in USA/% in Hispanic group) | 2010 (% in USA/% in Hispanic group) |
|---|---|---|
| Total | 35 305 818 (12.55%/100%) | 50 477 594 (16.35/100%) |
| Mexican | 20 640 711 (7.33%/58.46%) | 31 798 258 (10.30%/62.99%) |
| Puerto Rican | 3 406 178 (1.21%/9.65%) | 4 623 716 (1.50%/9.16%) |
| Cuban | 1 241 685 (0.44%/3.52%) | 1 785 547 (0.58%/3.54%) |
| Dominican | 764 945 (0.27%/2.17%) | 1 414 703 (0.46%/2.80%) |
| Costa Rican | 68 588 (0.02%/0.19%) | 126 418 (0.04%/0.25%) |
| Guatemalan | 372 487 (0.14%/1.06%) | 1 044 209 (0.34%/2.07%) |
| Honduran | 217 569 (0.08%/0.62%) | 633 401 (0.21%/1.25%) |
| Nicaraguan | 177 684 (0.06%/0.50%) | 348 202 (0.11%/0.69%) |
| Panamanian | 91 723 (0.03%/0.26%) | 165 456 (0.05%/0.33%) |
| Salvadoran | 655 165 (0.23%/1.86%) | 1 648 968 (0.53%/3.27%) |
| Other Central American | 103 721 (0.04%/0.29%) | 31 626 (0.01%/0.06%) |
| Argentine | 100 864 (0.04%/0.29%) | 224 952 (0.07%/0.45%) |
| Bolivian | 42 068 (0.01%/0.12%) | 99 210 (0.03%/0.20%) |
| Chilean | 68 849 (0.02%/0.20%) | 126 810 (0.04%/0.25%) |
| Colombian | 470 684 (0.17%/1.33%) | 908 734 (0.29%/1.80%) |
| Ecuadorian | 260 559 (0.09%/0.74%) | 564 631 (0.18%/1.12%) |
| Paraguayan | 8 769 (<0.01%/0.02%) | 20 023 (0.01%/0.04%) |
| Peruvian | 233 926 (0.08%/0.66%) | 531 358 (0.17%/1.05%) |
| Uruguayan | 18 804 (0.01%/0.05%) | 56 884 (0.02%/0.11%) |
| Venezuelan | 91 507 (0.03%/0.26%) | 215 023 (0.07%/0.43%) |
| Other South American | 57 532 (0.02%/0.16%) | 21 809 (0.01%/0.04%) |
| Spaniard | 100 135 (0.04%/0.28%) | 635 253 (0.21%/1.26%) |
| All other Hispanic or Latino | 6 111 665 (2.17%/17.31%) | 3 452 403 (1.12%/6.84%) |
Hispanic or Latino Population by Type of Origin and Race: 2010
| Origin | Total Hispanic population (% in Hispanic Group/% in USA) | White (% in group) | Black (% in group) | American Indian and Alaska Native (% in group) | Asian (% in group) | Native Hawaiian and Other Pacific Islander (% in group) | Some Other Race (% in group) | Two or More Races (% in group) |
|---|---|---|---|---|---|---|---|---|
| Total Hispanic | 50 477 594 (100%/16.35%) | 26 735 713 (52.97%) | 1 243 471 (2.46%) | 685 150 (1.36%) | 209 128 (0.41%) | 58 437 (0.12%) | 18 503 103 (36.66%) | 3 042 592 (6.03%) |
| Central American | 35 976 538 (71.27%/11.65%) | 18 491 777 (51.40%) | 425 389 (1.18%) | 523 432 (1.45%) | 113 846 (0.32%) | 34 096 (0.10%) | 14 332 437 (39.84%) | 1 875 561 (5.21%) |
| Mexican | 31 798 258 (62.99%/10.30%) | 16 794 111 (52.81%) | 296 778 (0.93%) | 460 098 (1.45%) | 101 654 (0.32%) | 24 600 (0.08%) | 12 544 645 (39.45%) | 1 576 372 (4.96%) |
| Guatemalan | 1 044 209 (2.07%/0.34%) | 401 763 (38.48%) | 11 471 (1.10%) | 31 197 (2.99%) | 2 386 (0.23%) | 7 251 (0.69%) | 515 394 (49.36%) | 74 747 (7.16%) |
| Salvadoran | 1 648 968 (3.27%/0.53%) | 663 224 (50.22%) | 16 150 (0.98%) | 17 682 (1.07%) | 4 737 (0.29%) | 1 105 (0.07%) | 832 805 (50.50%) | 113 265 (6.87%) |
| Other Central American | 1 305 103 (2.59%/0.42%) | 632 679 (48.48%) | 100 990 (7.74%) | 14 455 (1.11%) | 5 069 (0.39%) | 1 140 (0.09%) | 439 593 (33.68%) | 111 177 (8.52%) |
| South American | 2 769 434 (5.49%/0.90%) | 1 825 468 (65.91%) | 37 786 (1.36%) | 21 053 (0.76%) | 12 224 (0.44%) | 1 079 (0.04%) | 690 073 (24,92%) | 181 751 (6.56%) |
| Caribbean | 7 823 966 (15.50%/2.53%) | 4 400 071 (56.24%) | 667 775 (8.53%) | 64 689 (0.83%) | 32 759 (0.42%) | 12 814 (0.16%) | 2 039 263 (26.06%) | 606 595 (7.75%) |
| Cuban | 1 785 547 (3.54%/0.58%) | 1 525 521 (85.44%) | 82 398 (4.61%) | 3 002 (0.17%) | 4 391 (0.25%) | 774 (0.04%) | 103 499 (5.80%) | 65 962 (3.69%) |
| Dominican | 1 414 703 (2.80%/0.46%) | 419 016 (29.62%) | 182 005 (12.87%) | 19 183 (1.36%) | 4 056 (0.29%) | 1 279 (0.09%) | 651 339 (46.04%) | 137 825 (9.74%) |
| Puerto Rican | 4 623 716 (9.16%/1.50%) | 2 455 534 (53.11%) | 403 372 (8.72%) | 42 504 (0.92%) | 24 312 (0.53%) | 10 761 (0.23%) | 1 284 425 (27.78%) | 402 808 (8.71%) |
| All other Hispanic | 4 087 656 (8.10%/1.32%) | 2 018 397 (49.38%) | 112 521 (2.75%) | 75 976 (1.86%) | 50 299 (1.23%) | 10 448 (0.26%) | 1 441 330 (35.26%) | 378 685 (9.26%) |
Hispanic or Latino 2010–2017 (Estimates)
| Year | USA | Hispanic or Latino | White (in group/in USA) | Black (in group/in USA) | Asian (in group/in USA) | American Indian and Alaska Native (in group/in USA) | Native Hawaiian and Other Pacific Islander (in group/in USA) | Some other race (in group/in USA) | Two or more races (in group/in USA) | Mexican (in group/in USA) | Puerto Rican (in group/in USA) | Cuban (in group/in USA) | Other Hispanic (in group/in USA) |
|---|---|---|---|---|---|---|---|---|---|---|---|---|---|
| 2010 | 309 349 689 | 50 740 089 (16.40%) | 32 468 060 (63.99%/10.50%) | 977 101 (1.93%/0.32%) | 162 038 (0.32%/0.05%) | 479 043 (0.94%/0.15%) | 33 117 (0.07%/0.01%) | 14 331 229 (28.24%/4.63%) | 2 289 501 (4.51%/0.74%) | 32 929 683 (64.90%/10.64%) | 4 691 890 (9.25%/1.52%) | 1 873 585 (3.69%/0.61%) | 11 244 931 (22.16%/3.64%) |
| 2011 | 311 591 919 | 51 939 916 (16.67%) | 33 754 452 (64.99%/10.83%) | 1 040 652 (2.00%/0.33%) | 165 431 (0.32%/0.05%) | 460 011 (0.89%/0.15%) | 36 076 (0.07%/0.01%) | 14 202 943 (27.34%/4.56%) | 2 280 351 (4.39%/0.73%) | 33 557 922 (64.61%/10.77%) | 4 885 294 (9.41%/1.57%) | 1 891 014 (3.64%/0.61%) | 11 605 686 (22.34%/3.72%) |
| 2012 | 313 914 040 | 52 961 017 (16.87%) | 34 748 954 (65.61%/11.14%) | 1 158 946 (2.19%/0.37%) | 180 070 (0.34%/0.06%) | 479 033 (0.90%/0.15%) | 45 391 (0.09%/0.01%) | 13 947 953 (26.34%/4.44%) | 2 400 670 (4.53%/0.76%) | 34 038 599 (64.27%/10.84%) | 4 970 604 (9.39%/1.58%) | 1 957 557 (3.70%/0.62%) | 11 994 257 (22.65%/3.82%) |
| 2013 | 316 128 839 | 53 986 412 (17.08%) | 35 577 490 (65.90%/11.25%) | 1 111 616 (2.06%/0.35%) | 170 781 (0.32%/0.05%) | 461 674 (0.86%/0.15%) | 43 322 (0.08%/0.01%) | 14 169 602 (26.25%/4.48%) | 2 451 927 (4.54%/0.78%) | 34 586 088 (64.06%/10.94%) | 5 138 109 (9.52%/1.63%) | 2 013 155 (3.73%/0.64%) | 12 249 060 (22.69%/3.87%) |
| 2014 | 318 857 056 | 55 279 452 (17.34%) | 36 553 775 (66.13%/11.46%) | 1 111 917 (2.01%/0.35%) | 173 308 (0.31%/0.05%) | 498 292 (0.90%/0.16%) | 49 604 (0.09%/0.02%) | 14 384 163 (26.02%/4.51%) | 2 508 393 (4.54%/0.79%) | 35 320 579 (63.89%/11.08%) | 5 266 738 (9.53%/1.65%) | 2 046 805 (3.70%/0.64%) | 12 645 330 (22.88%/3.97%) |
| 2015 | 321 418 821 | 56 496 122 (17.58%) | 37 405 604 (66.21%/11.64%) | 1 097 677 (1.94%/0.34%) | 192 684 (0.34%/0.06%) | 527 604 (0.93%/0.16%) | 52 070 (0.09%/0.02%) | 14 676 633 (25.98%/4.57%) | 2 543 850 (4.50%/0.79%) | 35 797 080 (63.36%/11.14%) | 5 372 759 (9.51%/1.67%) | 2 106 501 (3.73%/0.66%) | 13 219 782 (23.40%/4.11%) |
| 2016 | 323 127 515 | 57 398 719 (17.76%) | 37 164 589 (64.75%/11.50%) | 1 176 242 (2.05%/0.36%) | 211 742 (0.37%/0.07%) | 550 764 (0.96%/0.17%) | 62 311 (0.11%/0.02%) | 15 576 077 (27.14%/4.82%) | 2 656 994 (4.63%/0.82%) | 36 255 589 (63.16%/11.22%) | 5 450 472 (9.50%/1.69%) | 2 212 566 (3.85%/0.68%) | 13 480 092 (23.49%/4.17%) |
| 2017 | 325 719 178 | 58 846 134 (18.07%) | 38 222 255 (64.95%/11.73%) | 1 263 898 (2.15%/0.39%) | 215 482 (0.37%/0.07%) | 581 116 (0.99%/0.18%) | 61 441 (0.10%/0.02%) | 15 719 042 (26.71%/4.83%) | 2 782 900 (4.73%/0.84%) | 36 668 018 (62.31%/11.26%) | 5 588 664 (9.50%/1.72%) | 2 315 863 (3.94%/0.71%) | 14 273 589 (24.26%/4.38%) |
Asian 2000–2017 (Estimates)
Asian population (2000 and 2010)
| Asian group | Asian alone 2000 (% in USA in Total/% in Asian group) | Asian alone 2010 (% in USA in Total/% in Asian group) | Asian in combination with other races 2000 (% in group) | Asian in combination with other races 2010 (% in group) | Asian alone or in combination with other races 2000 (% in USA in Total/% in Asian group) | Asian alone or in combination with other races 2010 (% in USA in Total/% in Asian group) |
|---|---|---|---|---|---|---|
| Total | 10 242 998 (3.64%) | 14 674 252 (4.75%) | 1 655 830 (13.81%) | 2 646 604 (15.28%) | 11 989 828 (4.26%) | 17 320 856 (5.61%) |
| Asian Indian | 1 718 778 (0.61%/16.78%) | 2 918 807 (0.95%/19.89%) | 180 821 (9.52%) | 264 256 (8.30%) | 1 899 599 (0.68%/15.84%) | 3 183 063 (1.03%/18.38%) |
| Bangladeshi | 46 905 (0.02%/0.46%) | 142 080 (0.05%/0.97%) | 10 507 (18.30%) | 5 220 (3.54%) | 57 412 (0.02%/0.48%) | 147 300 (0.05%/0.85%) |
| Bhutanese | 192 (<0.01%/<0.01%) | 18 814 (0.01%/0.13%) | 20 (9.43%) | 625 (3.22%) | 212 (<0.01%/<0.01% | 19 439 (0.01%/0.11%) |
| Burmese | 14 620 (0.01%/0.14%) | 95 536 (0.03%/0.65%) | 2 100 (12.56%) | 4 664 (4.65%) | 16 720 (0.01%/0.14%) | 100 200 (0.03%/0.58%) |
| Cambodian | 183 769 (0.07%/1.79%) | 255 497 (0.08%/1.74%) | 22 283 (10.81%) | 21 170 (7.65%) | 206 052 (0.07%/1.72%) | 276 667 (0.09%/1.60%) |
| Chinese | 2 564 190 (0.91%/25.03%) | 3 535 382 (1.15%/24.09%) | 301 042 (10.51%) | 474 732 (11.84%) | 2 865 232 (1.02%/23.90%) | 4 010 114 (1.30%/23.15%) |
| Chinese except Taiwanese | 2 432 046 (0.86%/23.74%) | 3 322 350 (1.08%/22.64%) | 288 391 (10.60%) | 457 382 (12.10%) | 2 720 437 (0.97%/22.69%) | 3 779 732 (1.22%/21.82%) |
| Taiwanese | 118 827 (0.04%/1.16%) | 199 192 (0.06%/1.36%) | 11 564 (8.87%) | 16 249 (7.54%) | 130 391 (0.05%/1.09%) | 215 441 (0.07%/1.24%) |
| Filipino | 1 908 125 (0.68%/18.63%) | 2 649 973 (0.86%/18.06%) | 456 690 (19.31%) | 766 867 (22.44%) | 2 364 815 (0.84%/19.72%) | 3 416 840 (1.11%/19.73%) |
| Hmong | 174 712 (0.06%/1.71%) | 252 323 (0.08%/1.72%) | 11 598 (6.23%) | 7 750 (2.98%) | 186 310 (0.07%/1.55%) | 260 073 (0.08%/1.50%) |
| Indonesian | 44 186 (0.02%/0.43%) | 70 096 (0.02%/0.48%) | 18 887 (29.94%) | 25 174 (26.42%) | 63 073 (0.02%/0.53%) | 95 270 (0.03%/0.55%) |
| Iwo Jiman | 18 (<0.01%/<0.01%) | 2 (<0.01%/<0.01%) | 60 (76.92%) | 10 (83.33%) | 78 (<0.01%/<0.01%) | 12 (<0.01%/<0.01%) |
| Japanese | 852 237 (0.30%/8.32%) | 841 824 (0.27%/5.74%) | 296 695 (25.82%) | 462 462 (35.46%) | 1 148 932 (0.41%/9.58%) | 1 304 286 (0.42%/7.53%) |
| Korean | 1 099 422 (0.39%/10.73%) | 1 463 474 (0.47%/9.97%) | 129 005 (10.50%) | 243 348 (14.26%) | 1 228 427 (0.44%/10.25%) | 1 706 822 (0.55%/9.85%) |
| Laotian | 179 103 (0.06%/1.75%) | 209 646 (0.07%/1.43%) | 19 100 (9.64%) | 22 484 (9.69%) | 198 203 (0.07%/1.65%) | 232 130 (0.08%/1.34%) |
| Malaysian | 15 029 (0.01%/0.15%) | 21 868 (0.01%/0.15%) | 3 537 (19.05%) | 4 311 (16.47%) | 18 566 (0.01%/0.15%) | 26 179 (0.01%/0.15%) |
| Maldivian | 29 (<0.01%/<0.01%) | 102 (<0.01%/<0.01%) | 22 (43.14%) | 25 (19.69%) | 51 (<0.01%/<0.01%) | 127 (<0.01%/<0.01%) |
| Mongolian | 3 699 (<0.01%/0.04%) | 15 138 (<0.01%/0.10%) | 2 169 (36.96%) | 3 206 (17.48%) | 5 868 (<0.01%/0.05%) | 18 344 (0.01%/0.11%) |
| Nepalese | 8 209 (<0.01%/0.08%) | 57 209 (0.02%/0.39%) | 1 190 (12.66%) | 2 281 (3.83%) | 9 399 (<0.01%/0.08%) | 59 490 (0.02%/0.34%) |
| Okinawan | 6 138 (<0.01%/0.06%) | 5 681 (<0.01%/0.04%) | 4 461 (42.09%) | 5 645 (49.84%) | 10 599 (<0.01%/0.09%) | 11 326 (<0.01%/0.07%) |
| Pakistani | 164 628 (0.06%/1.61%) | 382 994 (0.12%/2.61%) | 39 681 (19.42%) | 26 169 (6.40%) | 204 309 (0.07%/1.70%) | 409 163 (0.13%/2.36%) |
| Singaporean | 2 017 (<0.01%/0.02%) | 4 569 (<0.01%/0.03%) | 377 (15.75%) | 778 (14.55%) | 2 394 (<0.01%/0.02%) | 5 347 (<0.01%/0.03%) |
| Sri Lankan | 21 364 (0.01%/0.21%) | 41 456 (0.01%/0.28%) | 3 223 (13.11%) | 3 925 (8.65%) | 24 587 (0.01%/0.21%) | 45 381 (0.01%/0.26%) |
| Thai | 120 918 (0.04%/1.18%) | 182 872 (0.06%/1.25%) | 29 365 (19.54%) | 54 711 (23.03%) | 150 283 (0.05%/1.25%) | 237 583 (0.07%/1.37%) |
| Vietnamese | 1 169 672 (0.42%/11.42%) | 1 632 717 (0.53%/11.13%) | 54 064 (4.42%) | 104 716 (6.03%) | 1 223 736 (0.43%/10.21%) | 1 737 433 (0.56%/10.03%) |
| Other Asian, not specified | 162 913 (1,59%) | 238 332 (1.62%) | 213 810 (56,76%) | 385 429 (61,79%) | 376 723 (3,14%) | 623 761 (3,60%) |
| All South Asians | 1 960 105 (19,14%) | 3 519 391 (23.98%) | 235 464 (10,72%) | 302 501 (7,91%) | 2 195 569 (18,31%) | 3 821 892 (22,07%) |
| All East and Southeast Asians | 8 119 980 (79,27%) | 10 916 529 (74.39%) | 1 206 556 (12,94%) | 1 958 674 (15,21%) | 9 326 536 (77,79%) | 12 875 203 (74,33%) |
Asian population pyramids (Census 2010)
| Age group | Asian alone 4.75% (percent in the race/percent in USA) | Asian Indian alone (0,92% in USA/19,38% in group) (percent in the group/percent in Asian alone group) | Chinese alone (1,08% in USA/22,81% in group) (percent in the group/percent in Asian alone group) | Japanese alone (0,25% in USA/5,20% in group) (percent in the group/percent in Asian alone group) | Asian alone, other* (2,50% in USA/52,61% in group) (percent in the group/percent in Asian alone group) |
|---|---|---|---|---|---|
| Population | 14 674 252 | 2 843 391 | 3 347 229 | 763 325 | 7 720 307 |
| 0–4 | 898 011 (6.1%/4.45%) | 239 745 (8.43%/26.70%) | 166 058 (4.96%/18.49%) | 20 999 (2.75%/2.34%) | 471 209 (6.10%/52.47%) |
| 5–9 | 928 248 (6.3%/4.56%) | 205 562 (7.23%/22.15%) | 196 879 (5.88%/21.21%) | 23 010 (3.01%/2.48%) | 502 797 (6.51%/54.17%) |
| 10–14 | 881 590 (6.0%/4.26%) | 160 602 (5.65%/18.22%) | 187 438 (5.60%/21.26%) | 22 976 (3.01%/2.61%) | 510 574 (6.61%/57.92%) |
| 15–19 | 956 028 (6.5%/4.34%) | 148 008 (5.21%/15.48%) | 210 220 (6.28%/21.99%) | 27 288 (3.57%/2.85%) | 570 512 (7.39%/59.68%) |
| 20–24 | 1 106 222 (7.5%/5.12%) | 196 704 (6.92%/17.78%) | 268 226 (8.01%/24.25%) | 35 953 (4.71%/3.25%) | 605 339 (7.84%/54.74%) |
| 25–29 | 1 234 322 (8.4%/5.85%) | 325 474 (11.45%/27.37%) | 252 212 (7.53%/20.43%) | 38 115 (4.99%/3.09%) | 618 521 (8.01%/50.11%) |
| 30–34 | 1 240 906 (8.5%/6.22%) | 351 838 (12.37%/28.35%) | 244 035 (7.29%/19.67%) | 49 264 (6.45%/3.97%) | 595 769 (7.72%/48.01%) |
| 35–39 | 1 296 301 (8.8%/6.42%) | 288 633 (10.15%/22.27%) | 265 020 (7.92%/20.44%) | 60 985 (7.99%/4.70%) | 681 663 (8.83%/52.59%) |
| 40–44 | 1 155 565 (7.9%/5.53%) | 213 768 (7.52%/18.50%) | 261 082 (7.80%/22.59%) | 61 640 (8.08%/5.33%) | 619 075 (8.02%/53.57%) |
| 45–49 | 1 076 060 (7.3%/4.74%) | 167 387 (5.89%/15.56%) | 286 875 (8.57%/26.66%) | 65 565 (8.59%/6.09%) | 556 233 (7.20%/51.69%) |
| 50–54 | 980 282 (6.7%/4.40%) | 142 827 (5.02%/14.57%) | 251 059 (7.50%/25.61%) | 65 126 (8.53%/6.64%) | 521 270 (6.75%/53.18%) |
| 55–59 | 844 490 (5.8%/4.29%) | 124 549 (4.38%/14.75%) | 219 708 (6.56%/26.02%) | 59 880 (7.84%/7.09%) | 440 353 (5.70%/52.14%) |
| 60–64 | 689 601 (4.7%/4.10%) | 104 867 (3.69%/15.21%) | 171 656 (5.13%/24.89%) | 53 833 (7.05%/7.81%) | 359 245 (5.65%/52.09%) |
| 65–69 | 474 327 (3.2%/3.81%) | 73 314 (2.58%/15.46%) | 106 541 (3.18%/22.46%) | 39 724 (5.20%/8.37%) | 254 748 (3.30%/53.71%) |
| 70–74 | 354 268 (2.4%/3.82%) | 48 553 (1.71%/13.71%) | 93 883 (2.80%/26.50%) | 32 584 (4.27%/9.20%) | 179 248 (2.32%/50.60%) |
| 75–79 | 251 210 (1.7%/3.43%) | 27 446 (0.97%/10.93%) | 72 308 (2.16%/28.78%) | 39 345 (5.15%/15.66%) | 112 111 (1.45%/44.63%) |
| 80–84 | 168 879 (1.2%/2.94%) | 14 570 (0.51%/8.63%) | 50 173 (1.50%/29.71%) | 34 819 (4.56%/20.62%) | 69 317 (0.90%/41.05%) |
| 85+ | 137 942 (0.9%/2.51%) | 9 544 (0.34%/6.92%) | 43 856 (1.31%/31.79%) | 32 219 (4.22%/23.36%) | 52 323 (0.68%/37.93%) |
- Only about 10% from these category are people from South Asia, rest are from East or Southeast Asia
| Year | USA | Asian | Asian Indian (in group/in USA) | Chinese (in group/in USA) | Filipino (in group/in USA) | Japanese (in group/in USA) | Korean (in group/in USA) | Vietnamese (in group/in USA) | Other Asian (in group/in USA) |
|---|---|---|---|---|---|---|---|---|---|
| 2010 | 309 349 689 | 14 728 302 (4.76%) | 2 765 155 (18.77%/0.89%) | 3 456 912 (23.47%/1.12%) | 2 512 686 (17.06%/0.81%) | 774 600 (5.26%/0.25%) | 1 456 076 (9.89%/0.47%) | 1 625 365 (11.04%/0.53%) | 2 137 508 (14.51%/0.69%) |
| 2011 | 311 591 919 | 15 020 419 (4.82%) | 2 908 204 (19.36%/0.93%) | 3 520 150 (23.44%/1.13%) | 2 538 325 (16.90%/0.81%) | 756 898 (5.04%/0.24%) | 1 449 876 (9.65%/0.47%) | 1 669 447 (11.11%/0.54%) | 2 177 519 (14.50%/0.70%) |
| 2012 | 313 914 040 | 15 555 530 (4.96%) | 3 049 201 (19.60%/0.97%) | 3 660 659 (23.53%/1.17%) | 2 658 354 (17.09%/0.85%) | 780 210 (5.02%/0.25%) | 1 450 401 (9.32%/0.46%) | 1 675 246 (10.77%/0.53%) | 2 281 459 (14.67%/0.73%) |
| 2013 | 316 128 839 | 16 012 120 (5.07%) | 3 189 485 (19.92%/1.01%) | 3 781 673 (23.62%,1.20%) | 2 664 606 (16.64%/0.84%) | 794 441 (4.96%/0.25%) | 1 446 592 (9.03%/0.46%) | 1 692 760 (10.57%/0.54%) | 2 442 563 (15.25%/0.77%) |
| 2014 | 318 857 056 | 16 686 960 (5.23%) | 3 491 052 (20.92%/1.09%) | 3 941 615 (23.62%/1.24%) | 2 770 918 (16.61%/0.87%) | 759 056 (4.55%/0.24%) | 1 476 577 (8.85%/0.46%) | 1 714 143 (10.27%/0.54%) | 2 533 599 (15.18%/0.79%) |
| 2015 | 321 418 821 | 17 273 777 (5.37%) | 3 699 957 (21.42%/1.15%) | 4 133 674 (23.93%/1.29%) | 2 848 148 (16.49%/0.89%) | 757 468 (4.39%/0.24%) | 1 460 483 (8.45%/0.45%) | 1 738 848 (10.07%/0.54%) | 2 635 199 (15.26%/0.82%) |
| 2016 | 323 127 515 | 17 556 935 (5.43%) | 3 813 407 (21.72%/1.18%) | 4 214 856 (24.01%/1.30%) | 2 811 885 (16.02%/0.87%) | 789 830 (4.50%/0.24%) | 1 438 915 (8.20%/0.45%) | 1 803 575 (10.27%/0.56%) | 2 684 467 (15.29%/0.83%) |
| 2017 | 325 719 178 | 18 215 328 (5.59%) | 4 094 539 (22.48%/1.26%) | 4 344 981 (23.85%/1.33%) | 2 911 668 (15.98%/0.89%) | 770 546 (4.23%/0.24%) | 1 477 282 (8.11%/0.45%) | 1 826 998 (10.03%/0.56%) | 2 789 314 (15.31%/0.86%) |
American Indian and Alaska Native 2010–2017 (Estimates)
| Year | USA | American Indian and Alaska Native | Cherokee tribal grouping (in group/in USA) | Chippewa tribal grouping (in group/in USA) | Navajo tribal grouping (in group/in USA) | Sioux tribal grouping (in group/in USA) | Other (in group/in USA) |
|---|---|---|---|---|---|---|---|
| 2010 | 309 349 689 | 2 553 566 (0.83%) | 285 476 (11.18%/0.09%) | 115 859 (4.54%/0.04%) | 308 013 (12.06%/0.10%) | 131 048 (5.13%/0.04%) | 1 713 170 (67.09%/0.55%) |
| 2011 | 311 591 919 | 2 547 006 (0.82%) | 266 224 (10.45%/0.09%) | 119 868 (4.71%/0.04%) | 305 559 (12.00%/0.10%) | 129 382 (5.08%/0.04%) | 1 725 973 (67.76%/0.55%) |
| 2012 | 313 914 040 | 2 563 505 (0.82%) | 276 381 (10.78%/0.09%) | 113 262 (4.42%/0.04%) | 312 039 (12.17%/0.10%) | 121 503 (4.74%/0.04%) | 1 740 320 (67.89%/0.55%) |
| 2013 | 316 128 839 | 2 521 131 (0.80%) | 279 419 (11.08%/0.09%) | 111 939 (4.44%/0.04%) | 304 744 (12.09%/0.10%) | 126 485 (5.02%/0.04%) | 1 698 544 (67.37%/0.54%) |
| 2014 | 318 857 056 | 2 601 714 (0.82%) | 282 867 (10.87%/0.09%) | 115 987 (4.46%/0.04%) | 320 603 (12.32%/0.10%) | 125 790 (4.83%/0.04%) | 1 756 467 (67.51%/0.55%) |
| 2015 | 321 418 821 | 2 597 249 (0.81%) | 284 858 (10.97%/0.09%) | 115 280 (4.44%/0.04%) | 323 757 (12.47%/0.10%) | 117 019 (4.51%/0.04%) | 1 756 335 (67.62%/0.55%) |
| 2016 | 323 127 515 | 2 676 399 (0.83%) | 287 748 (10.75%/0.09%) | 126 524 (4.73%/0.04%) | 314 679 (11.76%/0.10%) | 126 015 (4.71%/0.04%) | 1 821 433 (68.06%/0.56%) |
| 2017 | 325 719 178 | 2 726 278 (0.84%) | 291 434 (10.69%/0.09%) | 118 195 (4.34%/0.04%) | 329 207 (12.08%/0.10%) | 112 575 (4.13%/0.03%) | 1 874 867 (68.77%/0.58%) |
Native Hawaiian and Other Pacific Islander 2010–2017 (Estimates)
| Year | USA | Native Hawaiian and Other Pacific Islander (in USA) | Native Hawaiian (in group/in USA) | Guamanian or Chamorro (in group/in USA) | Samoan (in group/in USA) | Other Pacific Islander (in group/in USA) |
|---|---|---|---|---|---|---|
| 2010 | 309 349 689 | 507 916 (0.16%) | 157 029 (30.92%/0.05%) | 72 807 (14.33%/0.02%) | 114 796 (22.60%/0.04%)/ | 163 284 (32.15%/0.05%) |
| 2011 | 311 591 919 | 506 017 (0.16%) | 156 239 (30.88%/0.05%) | 64 192 (12.69%/0.02%) | 108 849 (21.51%%/0.03%) | 176 737 (34.93%/0.06%) |
| 2012 | 313 914 040 | 543 198 (0.17%) | 175 299 (32.27%/0.06%) | 72 738 (13.39%/0.02%) | 103 079 (18.98%/0.03%) | 192 082 (35.36%/0.06%) |
| 2013 | 316 128 839 | 525 750 (0.17%) | 179 489 (34.14%/0.06%) | 63 655 (12.11%/0.02%) | 105 235 (20.02%/0.03%) | 177 371 (33.74%/0.06%) |
| 2014 | 318 857 056 | 557 154 (0.17%) | 180 203 (32.34%/0.06%) | 73 811 (13.25%/0.02%) | 114 288 (20.51%/0.04%) | 188 852 (33.90%/0.06%) |
| 2015 | 321 418 821 | 554 946 (0.17%) | 176 482 (31.80%/0.05%) | 78 522 (14.15%/0.02%) | 120 019 (21.63%/0.04%) | 179 923 (32.42%/0.06%) |
| 2016 | 323 127 515 | 595 986 (0.18%) | 178 874 (30.01%/0.06%) | 82 398 (13.83%/0.03%) | 119 605 (20.07%/0.04%) | 215 109 (36.09%/0.07%) |
| 2017 | 325 719 178 | 608 219 (0.19%) | 191 739 (31.52%/0.06%) | 85 771 (14.10%/0.03%) | 105 076 (17.28%/0.03%) | 225 633 (37.10%/0.07%) |
Immigration to the United States
Immigration to the United States by region and country:[25]
| Region | 2022 | 2021 | 2020 | 2019 | 2018 | 2017 | 2016 | 2015 | 2014 | 2013 | 2012 | 2011 | 2010 | 2009 | 2008 | 2007 | 2006 | 2005 | 2004 | 2003 | 2002 | 2001 | 2000 | 1999 |
|---|---|---|---|---|---|---|---|---|---|---|---|---|---|---|---|---|---|---|---|---|---|---|---|---|
| All immigrants | 1 018 349 | 740 002 | 707 362 | 1 031 765 | 1 096 611 | 1 127 167 | 1 183 505 | 1 051 031 | 1 016 518 | 990 553 | 1 031 631 | 1 062 040 | 1 042 625 | 1 130 818 | 1 107 126 | 1 052 415 | 1 266 129 | 1 122 257 | 957 883 | 703 542 | 1 059 356 | 1 058 902 | 841 002 | 644 787 |
| Americas | 431 697 | 311 806 | 284 491 | 461 710 | 497 860 | 492 682 | 506 852 | 438 388 | 397 718 | 396 598 | 407 169 | 419 996 | 423 784 | 478 108 | 491 805 | 445 879 | 552 056 | 448 689 | 414 523 | 304 990 | 477 092 | 474 112 | 394 779 | 312 160 |
| East and Southeast Asia | 173 061 | 127 696 | 138 695 | 198 793 | 199 605 | 221 661 | 242 541 | 220 902 | 216 457 | 220 689 | 238 820 | 252 594 | 230 130 | 234 870 | 235 037 | 245 904 | 270 430 | 232 823 | 201 495 | 148 231 | 206 074 | 211 146 | 164 445 | 120 733 |
| South Asia | 164 438 | 118 228 | 76 514 | 96 931 | 107 237 | 108 677 | 121 715 | 116 765 | 132 600 | 117 655 | 119 383 | 123 625 | 117 499 | 102 633 | 100 894 | 96 283 | 99 433 | 116 181 | 94 631 | 67 630 | 92 689 | 96 041 | 65 345 | 51 036 |
| North Africa and West/Central Asia | 96 232 | 60 187 | 70 738 | 88 395 | 109 877 | 115 319 | 121 041 | 103 916 | 101 467 | 79 708 | 88 505 | 92 239 | 92 773 | 95 731 | 81 418 | 73 859 | 93 324 | 81 902 | 60 969 | 44 084 | 63 690 | 63 060 | 51 994 | 41 475 |
| Europe | 75 671 | 61 508 | 68 984 | 87 585 | 80 024 | 84 327 | 93 556 | 83 630 | 83 259 | 86 675 | 81 775 | 83 736 | 88 732 | 105 528 | 103 853 | 106 625 | 146 359 | 165 076 | 124 928 | 94 018 | 164 443 | 165 712 | 124 598 | 87 815 |
| Sub-Saharan Africa | 70 691 | 54 226 | 63 071 | 91 523 | 95 842 | 97 628 | 90 167 | 78 878 | 78 181 | 80 664 | 90 007 | 83 400 | 82 885 | 106 974 | 87 443 | 76 353 | 94 375 | 65 705 | 52 104 | 39 013 | 47 206 | 40 420 | 33 541 | 26 740 |
| Australia and Oceania | 5 105 | 4 131 | 3 980 | 5 340 | 4 653 | 5 049 | 5 577 | 5 385 | 5 098 | 5 265 | 4 728 | 4 962 | 5 337 | 5 563 | 5 254 | 6 090 | 7 372 | 6 526 | 5 967 | 4 335 | 5 482 | 6 052 | 5 089 | 3 636 |
Top 10 sending countries:
| Number | 2022 | 2021 | 2020 | 2019 | 2018 | 2017 | 2016 | 2015 | 2014 | 2013 | 2012 | 2011 | 2010 | 2009 | 2008 | 2007 | 2006 | 2005 | 2004 | 2003 | 2002 | 2001 | 2000 | 1999 |
|---|---|---|---|---|---|---|---|---|---|---|---|---|---|---|---|---|---|---|---|---|---|---|---|---|
| Total | 1 018 349 | 740 002 | 707 362 | 1 031 765 | 1 096 611 | 1 127 167 | 1 183 505 | 1 051 031 | 1 016 518 | 990 553 | 1 031 631 | 1 062 040 | 1 042 625 | 1 130 818 | 1 107 126 | 1 052 415 | 1 266 129 | 1 122 257 | 957 883 | 703 542 | 1 059 356 | 1 058 902 | 841 002 | 644 787 |
| 1. | M. 138 772 | M. 107 230 | M. 100 325 | M. 156 052 | M. 161 858 | M. 170 581 | M. 174 534 | M. 158 619 | M. 134 052 | M. 135 028 | M. 146 406 | M. 143 446 | M. 139 120 | M. 164 920 | M. 189 989 | M. 148 640 | M. 173 749 | M. 161 445 | M. 175 411 | M. 115 585 | M. 218 822 | M. 205 560 | M. 173 493 | M. 147 402 |
| 2. | I. 127 012 | I. 93 450 | I. 46 363 | Ch. 62 248 | Cu. 76 486 | Ch. 71 565 | Ch. 81 772 | Ch. 74 558 | I. 77 908 | Ch. 71 798 | Ch. 81 784 | Ch. 87 016 | Ch. 70 863 | Ch. 64 238 | Ch. 80 271 | Ch. 76 655 | Ch. 87 307 | I. 84 680 | I. 70 151 | I. 50 228 | I. 70 823 | I. 70 032 | Ch. 45 585 | Ch. 32 159 |
| 3. | Ch. 67 950 | Ch. 49 847 | Ch. 41 483 | I. 54 495 | Ch. 65 214 | Cu. 65 028 | Cu. 66 516 | I. 64 116 | Ch. 76 089 | I. 68 458 | I. 66 434 | I. 69 013 | I. 69 162 | P. 60 029 | I. 63 352 | P. 72 596 | P. 74 606 | Ch. 69 933 | P. 57 846 | P. 45 250 | Ch. 61 082 | Ch. 56 267 | P. 42 343 | P. 30 943 |
| 4. | D.R. 40 152 | P. 27 511 | D.R. 30 005 | D.R. 49 911 | I. 59 821 | I. 60 394 | I. 64 687 | P. 56 478 | P. 49 996 | P. 54 446 | P. 57 327 | P. 57 011 | P. 58 173 | I. 57 304 | P. 54 030 | I. 65 353 | I. 61 369 | P. 60 746 | Ch. 55 494 | Ch. 40 568 | P. 51 040 | P. 52 919 | I. 41 903 | I. 30 157 |
| 5. | Cu. 36 642 | D.R. 24 553 | V. 29 995 | P. 45 920 | D.R. 57 413 | D.R. 58 520 | D.R. 61 161 | Cu.54 396 | Cu. 46 679 | D.R. 41 311 | D.R. 41 566 | D.R. 46 109 | D.R. 53 870 | D.R. 49 414 | Cu. 49 500 | Col. 33 187 | Cu. 45 614 | Cu. 36 261 | V. 31 524 | E.S. 28 231 | V. 33 563 | V. 35 419 | V. 26 553 | V. 20 335 |
| 6. | P. 35 998 | Cu. 23 077 | P. 25 491 | Cu. 41 641 | P. 47 258 | P. 49 147 | P. 53 287 | D.R. 50 610 | D.R. 44 577 | Cu. 32 219 | Cu. 32 820 | Cu. 36 452 | Cu. 33 573 | Cu. 38 954 | D.R. 31 879 | H. 30 405 | Col. 43 144 | V. 32 784 | D.R. 30 506 | D.R. 26 159 | E.S. 31 060 | E.S. 31 089 | E.S. 22 543 | D.R. 17 811 |
| 7. | E.S. 30 876 | E.S. 18 668 | E.S. 17 907 | V. 39 712 | V. 33 834 | V. 38 231 | V. 41 451 | V. 30 832 | V. 30 283 | V. 27 101 | V. 28 304 | V. 34 157 | V. 30 632 | V. 29 234 | V. 31 497 | Cu. 29 104 | D.R. 38 068 | D.R. 27 503 | E.S. 29 807 | V. 22 087 | Cu. 28 182 | Cu. 27 453 | H. 22 337 | H. 16 514 |
| 8. | V. 24 425 | Br. 18 351 | Br. 16 746 | E.S. 27 656 | E.S. 28 326 | E.S. 25 109 | H. 23 584 | Ir 21 107 | K. 20 565 | K. 23 214 | H. 22 818 | K. 22 860 | H. 22 582 | Col. 27 849 | Col. 30 213 | V. 28 691 | E.S. 31 782 | K. 26 562 | Cu. 20 488 | Col. 14 720 | B.-H. 25 329 | H. 27 031 | N. 20 947 | J. 14 693 |
| 9. | Br. 24 169 | V. 16 312 | Cu. 16 367 | J. 21 689 | H. 21 360 | J. 21 905 | E.S. 23 449 | E.S. 19 487 | E.S. 19 273 | Col. 21 131 | Col. 20 931 | Col. 22 635 | Col. 22 406 | K. 25 926 | K. 26 666 | D.R. 28 024 | V. 30 691 | Col. 25 566 | K. 19 766 | G. 14 386 | D.R. 22 515 | B.-H. 23 594 | Cu. 18 960 | E.S. 14 581 |
| 10. | Col. 21 723 | Col. 15 293 | K. 16 272 | K. 18 508 | J. 20 347 | H. 21 824 | J. 23 350 | Pa 18 057 | Ir. 19 153 | H. 20 351 | K. 20 895 | H. 22 111 | K. 22 262 | H. 24 280 | H. 26 007 | K. 22 405 | J. 24 976 | U. 22 745 | G. 18 920 | R. 13 935 | U. 21 190 | Can. 21 752 | D.R. 17 465 | Cu. 14 019 |
- M.- Mexico, Ch.- China, I.- India, P.- Philippines, D.R.- Dominican Republic, Cu.- Cuba, V.- Vietnam, K.- Korea (South & North), Col.- Colombia, H. – Haiti, E.S. – El Salvador, J. – Jamaica, U- Ukraine, G. – Guatemala, R.- Russian Federation, N. – Nicaragua, B.-H. – Bosnia-Herzegovina, Can. – Canada, Ir – Iraq, Pa – Pakistan, Br. - Brazil
Americas:
| Country | 2022 | 2021 | 2020 | 2019 | 2018 | 2017 | 2016 | 2015 | 2014 | 2013 | 2012 | 2011 | 2010 | 2009 | 2008 | 2007 | 2006 | 2005 | 2004 | 2003 | 2002 | 2001 | 2000 | 1999 |
|---|---|---|---|---|---|---|---|---|---|---|---|---|---|---|---|---|---|---|---|---|---|---|---|---|
| Total from Americas | 431 697 | 311 806 | 284 491 | 461 710 | 497 860 | 492 682 | 506 852 | 438 388 | 397 718 | 396 598 | 407 169 | 419 996 | 423 784 | 478 108 | 491 805 | 445 879 | 552 056 | 448 689 | 414 523 | 304 990 | 477 092 | 474 112 | 394 779 | 312 160 |
| Mexico | 138 772 | 107 230 | 100 325 | 156 052 | 161 858 | 170 581 | 174 534 | 158 619 | 134 052 | 135 028 | 146 406 | 143 446 | 139 120 | 164 920 | 189 989 | 148 640 | 173 749 | 161 445 | 175 411 | 115 585 | 218 822 | 205 560 | 173 493 | 147 402 |
| Dominican Rep. | 40 152 | 24 553 | 30 005 | 49 911 | 57 413 | 58 520 | 61 161 | 50 610 | 44 577 | 41 311 | 41 566 | 46 109 | 53 870 | 49 414 | 31 879 | 28 024 | 38 068 | 27 503 | 30 506 | 26 159 | 22 515 | 21 195 | 17 465 | 17 811 |
| Cuba | 36 642 | 23 077 | 16 367 | 41 641 | 76 486 | 65 028 | 66 516 | 54 396 | 46 679 | 32 219 | 32 820 | 36 452 | 33 573 | 38 954 | 49 500 | 29 104 | 45 614 | 36 261 | 20 488 | 9 262 | 28 182 | 27 453 | 18 960 | 14 019 |
| El Salvador | 30 876 | 18 668 | 17 907 | 27 656 | 28 326 | 25 109 | 23 449 | 19 487 | 19 273 | 18 260 | 16 256 | 18 667 | 18 806 | 19 909 | 19 659 | 21 127 | 31 782 | 21 359 | 29 807 | 28 231 | 31 060 | 31 089 | 22 543 | 14 581 |
| Brazil | 24 169 | 18 351 | 16 746 | 19 825 | 15 394 | 14 989 | 13 812 | 11 424 | 10 429 | 11 033 | 11 441 | 11 763 | 12 258 | 14 701 | 12 195 | 14 295 | 17 903 | 16 662 | 10 556 | 6 331 | 9 439 | 9 448 | 6 943 | 3 887 |
| Colombia | 21 723 | 15 293 | 11 989 | 19 841 | 17 545 | 17 956 | 18 610 | 17 316 | 18 175 | 21 131 | 20 931 | 22 635 | 22 406 | 27 849 | 30 213 | 33 187 | 43 144 | 25 566 | 18 846 | 14 720 | 18 758 | 16 627 | 14 427 | 9 928 |
| Venezuela | 21 025 | 14 412 | 12 136 | 15 720 | 11 762 | 11 809 | 10 772 | 9 144 | 8 427 | 9 572 | 9 387 | 9 183 | 9 409 | 11 154 | 10 514 | 10 692 | 11 341 | 10 645 | 6 220 | 4 018 | 5 228 | 5 170 | 4 693 | 2 498 |
| Honduras | 17 099 | 10 116 | 8 277 | 15 901 | 13 794 | 11 387 | 13 302 | 9 274 | 8 156 | 8 898 | 6 884 | 6 133 | 6 448 | 6 404 | 6 540 | 7 646 | 8 177 | 7 012 | 5 508 | 4 645 | 6 435 | 6 571 | 5 917 | 4 793 |
| Guatemala | 16 990 | 8 904 | 7 815 | 13 453 | 15 638 | 13 198 | 13 002 | 11 773 | 10 238 | 10 224 | 10 341 | 11 092 | 10 467 | 12 187 | 16 182 | 17 908 | 24 133 | 16 818 | 18 920 | 14 386 | 16 178 | 13 496 | 9 942 | 7 294 |
| Jamaica | 16 482 | 13 357 | 12 826 | 21 689 | 20 347 | 21 905 | 23 350 | 17 642 | 19 026 | 19 400 | 20 705 | 19 662 | 19 825 | 21 783 | 18 477 | 19 375 | 24 976 | 18 345 | 14 430 | 13 347 | 14 835 | 15 322 | 15 949 | 14 693 |
| Ecuador | 11 910 | 7 532 | 6 157 | 11 083 | 11 472 | 10 594 | 10 757 | 10 187 | 10 960 | 10 591 | 9 342 | 11 103 | 11 492 | 12 128 | 11 663 | 12 248 | 17 489 | 11 608 | 8 626 | 7 066 | 10 561 | 9 665 | 7 651 | 8 882 |
| Canada | 11 317 | 9 978 | 9 526 | 11 388 | 9 898 | 11 484 | 12 793 | 12 673 | 11 586 | 13 181 | 12 932 | 12 800 | 13 328 | 16 140 | 15 109 | 15 495 | 18 207 | 21 878 | 15 569 | 11 350 | 19 352 | 21 752 | 16 057 | 8 782 |
| Haiti | 10 432 | 11 456 | 9 338 | 17 253 | 21 360 | 21 824 | 23 584 | 16 967 | 15 274 | 20 351 | 22 818 | 22 111 | 22 582 | 24 280 | 26 007 | 30 405 | 22 226 | 14 524 | 14 191 | 12 293 | 20 213 | 27 031 | 22 337 | 16 514 |
| Peru | 8 035 | 5 044 | 5 626 | 10 049 | 9 878 | 10 115 | 10 940 | 10 148 | 10 606 | 12 564 | 12 609 | 14 064 | 14 247 | 16 957 | 15 184 | 17 699 | 21 718 | 15 676 | 11 794 | 9 409 | 11 918 | 11 062 | 9 579 | 8 414 |
| Argentina | 4 128 | 3 248 | 2 970 | 3 925 | 3 080 | 3 482 | 4 091 | 3 730 | 3 874 | 4 372 | 4 359 | 4 473 | 4 399 | 5 780 | 5 353 | 5 645 | 7 327 | 7 081 | 4 805 | 3 129 | 3 661 | 3 297 | 2 317 | 1 387 |
| Nicaragua | 3 754 | 4 220 | 2 570 | 3 818 | 3 061 | 3 072 | 3 486 | 3 324 | 2 886 | 3 048 | 3 046 | 3 401 | 3 565 | 4 137 | 3 614 | 3 716 | 4 145 | 3 305 | 4 009 | 4 094 | 10 659 | 19 634 | 20 947 | 13 327 |
| Guyana | 3 455 | 3 435 | 3 027 | 5 385 | 5 165 | 5 468 | 5 771 | 5 543 | 6 267 | 5 897 | 5 683 | 6 599 | 6 749 | 6 670 | 6 823 | 5 726 | 9 552 | 9 317 | 6 351 | 6 809 | 9 938 | 8 279 | 5 719 | 3 290 |
| Trinidad & Tobago | 2 435 | 1 852 | 1 718 | 3 150 | 2 758 | 3 100 | 3 469 | 3 212 | 3 988 | 4 724 | 5 214 | 5 023 | 5 435 | 6 256 | 5 937 | 6 829 | 8 854 | 6 568 | 5 384 | 4 138 | 5 738 | 6 618 | 6 635 | 4 259 |
| Costa Rica | 2 167 | 1 991 | 1 658 | 2 348 | 2 171 | 2 184 | 2 224 | 2 029 | 1 966 | 2 114 | 2 020 | 2 135 | 2 164 | 2 384 | 2 090 | 2 540 | 3 109 | 2 278 | 1 755 | 1 246 | 1 591 | 1 733 | 1 310 | 883 |
| Chile | 1 747 | 1 632 | 1 520 | 1 762 | 1 519 | 1 625 | 1 698 | 1 596 | 1 581 | 1 736 | 1 673 | 1 853 | 1 950 | 2 250 | 2 017 | 2 274 | 2 774 | 2 404 | 1 810 | 1 310 | 1 839 | 1 921 | 1 700 | 1 085 |
| Bolivia | 1 621 | 1 121 | 976 | 1 525 | 1 523 | 1 510 | 1 595 | 1 626 | 1 719 | 2 071 | 1 948 | 2 173 | 2 253 | 2 837 | 2 436 | 2 590 | 4 025 | 2 197 | 1 768 | 1 376 | 1 664 | 1 819 | 1 761 | 1 444 |
| Panama | 952 | 844 | 601 | 1 059 | 897 | 889 | 1 029 | 1 052 | 1 095 | 1 234 | 1 281 | 1 374 | 1 536 | 1 806 | 1 678 | 1 916 | 2 418 | 1 815 | 1 417 | 1 164 | 1 680 | 1 867 | 1 829 | 1 640 |
| Bahamas | 767 | 997 | 614 | 922 | 759 | 725 | 656 | 725 | 654 | 630 | 619 | 668 | 652 | 751 | ||||||||||
| Uruguay | 731 | 830 | 699 | 1 109 | 960 | 1 001 | 972 | 1 078 | 1 128 | 1 352 | 1 374 | 1 553 | 1 331 | 1 775 | 1 451 | 1 418 | 1 664 | 1 154 | 787 | 469 | 536 | 541 | 426 | 267 |
| St. Lucia | 628 | 457 | 463 | 726 | 696 | 777 | 777 | 739 | 844 | 853 | 919 | 785 | 872 | 1 027 | ||||||||||
| Belize | 591 | 670 | 475 | 806 | 632 | 746 | 851 | 772 | 789 | 946 | 847 | 905 | 965 | 1 041 | ||||||||||
| Dominica | 455 | 279 | 287 | 511 | 492 | 510 | 298 | 229 | 345 | 244 | 125 | 287 | 366 | 484 | ||||||||||
| Grenada | 449 | 370 | 307 | 554 | 501 | 544 | 585 | 525 | 633 | 687 | 671 | 579 | 664 | 748 | ||||||||||
| Rest* | 2 193 | 1 880 | 1 561 | 2 640 | 2 475 | 2 516 | 2 768 | 2 548 | 2 491 | 2 927 | 2 952 | 2 968 | 3 052 | 3 382 | 7 295 | 7 380 | 9 661 | 7 268 | 5 565 | 4 453 | 6 290 | 6 962 | 6 179 | 5 080 |
* Anguilla, Antigua-Barbuda, Aruba, Barbados, Bermuda, British Virgin Islands, Cayman Islands, Curaçao, French Guiana, Guadeloupe, Martinique, Montserrat, Netherlands Antilles, Paraguay, Saint Kitts-Nevis, Saint Martin, Saint Vincent and the Grenadines, Sint Maarten, Suriname, Turks and Caicos Islands, United States, US Virgin Islands.
East and Southeast Asia:
| Country | 2022 | 2021 | 2020 | 2019 | 2018 | 2017 | 2016 | 2015 | 2014 | 2013 | 2012 | 2011 | 2010 | 2009 | 2008 | 2007 | 2006 | 2005 | 2004 | 2003 | 2002 | 2001 | 2000 | 1999 |
|---|---|---|---|---|---|---|---|---|---|---|---|---|---|---|---|---|---|---|---|---|---|---|---|---|
| Total from East and Southeast Asia | 173 061 | 127 696 | 138 695 | 198 793 | 199 605 | 221 661 | 242 541 | 220 902 | 216 457 | 220 689 | 238 820 | 252 594 | 230 130 | 234 870 | 235 037 | 245 904 | 270 430 | 232 823 | 201 495 | 148 231 | 206 074 | 211 146 | 164 445 | 120 733 |
| China | 67 950 | 49 847 | 41 483 | 62 248 | 65 214 | 71 565 | 81 772 | 74 558 | 76 089 | 71 798 | 81 784 | 87 016 | 70 863 | 64 238 | 80 271 | 76 655 | 87 307 | 69 933 | 55 494 | 40 568 | 61 082 | 56 267 | 45 585 | 32 159 |
| Philippines | 35 998 | 27 511 | 25 491 | 45 920 | 47 258 | 49 147 | 53 287 | 56 478 | 49 996 | 54 446 | 57 327 | 57 011 | 58 173 | 60 029 | 54 030 | 72 596 | 74 606 | 60 746 | 57 846 | 45 250 | 51 040 | 52 919 | 42 343 | 30 943 |
| Vietnam | 24 425 | 16 312 | 29 995 | 39 712 | 33 834 | 38 231 | 41 451 | 30 832 | 30 283 | 27 101 | 28 304 | 34 157 | 30 632 | 29 234 | 31 497 | 28 691 | 30 691 | 32 784 | 31 524 | 22 087 | 33 563 | 35 419 | 26 553 | 20 335 |
| Korea | 16 194 | 12 371 | 16 272 | 18 508 | 17 676 | 19 226 | 21 848 | 17 193 | 20 565 | 23 214 | 20 895 | 22 860 | 22 262 | 25 926 | 26 666 | 22 405 | 24 386 | 26 562 | 19 766 | 12 382 | 20 724 | 20 532 | 15 721 | 12 795 |
| Taiwan | 5 091 | 3 246 | 4 759 | 5 801 | 5 079 | 4 858 | 5 120 | 4 888 | 4 697 | 5 385 | 5 331 | 6 154 | 6 732 | 8 038 | 9 073 | 8 990 | 8 086 | 9 196 | 9 005 | 6 917 | 9 775 | 12 120 | 9 019 | 6 700 |
| Thailand | 4 632 | 4 037 | 4 177 | 5 551 | 5 556 | 6 311 | 7 039 | 7 502 | 6 197 | 7 583 | 9 459 | 9 962 | 9 384 | 10 444 | 6 637 | 8 751 | 11 749 | 5 505 | 4 318 | 3 126 | 4 144 | 4 245 | 3 753 | 2 366 |
| Japan | 4 184 | 3 960 | 3 905 | 4 503 | 4 317 | 4 635 | 5 207 | 5 395 | 5 545 | 5 925 | 6 061 | 6 161 | 6 264 | 7 690 | 6 821 | 6 748 | 8 265 | 8 768 | 7 697 | 5 971 | 8 248 | 9 578 | 7 049 | 4 202 |
| Cambodia | 3 400 | 1 762 | 1 593 | 2 748 | 3 187 | 4 056 | 3 173 | 1 868 | 2 536 | 2 624 | 2 473 | 2 745 | 2 986 | 3 771 | 3 713 | 4 246 | 5 773 | 4 022 | 3 553 | 2 263 | 2 800 | 2 462 | 2 138 | 1 394 |
| Burma | 2 879 | 2 143 | 4 000 | 5 024 | 8 182 | 12 897 | 13 065 | 12 808 | 11 144 | 12 565 | 17 383 | 16 518 | 12 925 | 13 621 | 3 403 | 3 130 | 4 562 | 2 095 | 1 379 | 1 193 | 1 356 | 1 373 | 1 201 | 1 200 |
| Hong Kong | 2 301 | 1 334 | 1 783 | 2 021 | 2 075 | 2 415 | 2 510 | 2 085 | 2 278 | 2 226 | 2 104 | 2 306 | 2 432 | 2 651 | 3 373 | 3 527 | 3 256 | 3 705 | 3 951 | 3 574 | 6 075 | 8 300 | 5 407 | 4 910 |
| Indonesia | 1 752 | 1 588 | 1 428 | 1 899 | 1 756 | 1 914 | 2 129 | 2 084 | 2 139 | 2 731 | 2 603 | 2 856 | 3 032 | 3 679 | 3 606 | 3 716 | 4 868 | 3 924 | 2 419 | 1 805 | 2 418 | 2 525 | 1 767 | 1 186 |
| Malaysia | 1 573 | 1 605 | 1 898 | 2 303 | 3 051 | 4 109 | 3 382 | 2 749 | 2 622 | 2 477 | 2 605 | 2 273 | 1 714 | 2 014 | 1 945 | 2 149 | 2 281 | 2 632 | 1 987 | 1 200 | 2 124 | 2 439 | 1 551 | 991 |
| Mongolia | 1 005 | 762 | 543 | 765 | 636 | 661 | 750 | 644 | 651 | 729 | 691 | 774 | 594 | 831 | ||||||||||
| Singapore | 971 | 799 | 807 | 818 | 801 | 818 | 812 | 781 | 779 | 835 | 712 | 690 | 774 | 832 | ||||||||||
| Laos | 621 | 349 | 486 | 850 | 863 | 685 | 856 | 917 | 806 | 923 | 949 | 956 | 1200 | 1688 | ||||||||||
| Macau | 62 | 46 | 64 | 99 | 91 | 109 | 109 | 99 | 105 | 106 | 120 | 130 | 143 | 158 | ||||||||||
| Brunei | 23 | 24 | 11 | 23 | 29 | 24 | 31 | 21 | 25 | 21 | 19 | 25 | 20 | 26 | ||||||||||
| Rest | - | - | - | - | – | – | – | – | – | – | – | – | – | – | 4 002 | 4 300 | 4 600 | 2 951 | 2 556 | 1 895 | 2 725 | 2 967 | 2 358 | 1 552 |
South Asia:
| Country | 2022 | 2021 | 2020 | 2019 | 2018 | 2017 | 2016 | 2015 | 2014 | 2013 | 2012 | 2011 | 2010 | 2009 | 2008 | 2007 | 2006 | 2005 | 2004 | 2003 | 2002 | 2001 | 2000 | 1999 |
|---|---|---|---|---|---|---|---|---|---|---|---|---|---|---|---|---|---|---|---|---|---|---|---|---|
| Total from South Asia | 164 438 | 118 228 | 76 514 | 96 931 | 107 237 | 108 677 | 121 715 | 116 765 | 132 600 | 117 655 | 119 383 | 123 625 | 117 499 | 102 633 | 100 894 | 96 283 | 99 433 | 116 181 | 94 631 | 67 630 | 92 689 | 96 041 | 65 345 | 51 036 |
| India | 127 012 | 93 450 | 46 363 | 54 495 | 59 821 | 60 394 | 64 687 | 64 116 | 77 908 | 68 458 | 66 434 | 69 013 | 69 162 | 57 304 | 63 352 | 65 353 | 61 369 | 84 680 | 70 151 | 50 228 | 70 823 | 70 032 | 41 903 | 30 157 |
| Nepal | 12 010 | 7 309 | 7 847 | 10 201 | 11 953 | 11 610 | 12 851 | 12 926 | 12 357 | 13 046 | 11 312 | 10 166 | 7 115 | 4 514 | 4 093 | 3 472 | 3 733 | 3 158 | 2 878 | 2 095 | 1 137 | 945 | 616 | 453 |
| Pakistan | 11 777 | 9 691 | 10 474 | 13 921 | 15 802 | 17 408 | 19 313 | 18 057 | 18 612 | 13 251 | 14 740 | 15 546 | 18 258 | 21 555 | 19 719 | 13 492 | 17 418 | 14 926 | 12 086 | 9 415 | 13 694 | 16 393 | 14 504 | 13 485 |
| Bangladesh | 10 858 | 6 405 | 9 272 | 15 176 | 15 717 | 14 693 | 18 723 | 13 570 | 14 645 | 12 099 | 14 705 | 16 707 | 14 819 | 16 651 | 11 753 | 12 074 | 14 644 | 11 487 | 8 061 | 4 616 | 5 483 | 7 152 | 7 204 | 6 038 |
| Sri Lanka | 2 572 | 1 232 | 1 463 | 1 689 | 1 594 | 1 627 | 1 913 | 1 763 | 1 767 | 1 847 | 1 994 | 2 053 | 2 036 | 2 009 | 1 935 | 1 831 | 2 191 | 1 894 | 1 431 | 1 246 | 1 529 | 1 505 | 1 118 | 899 |
| Bhutan | 209 | 137 | 1 091 | 1 441 | 2 350 | 2 940 | 4 217 | 6 325 | 7 298 | 8 954 | 10 198 | 10 137 | 6 109 | 594 | 42 | 52 | 78 | 30 | 17 | 15 | 14 | 5 | D | 4 |
| Maldives | 0 | 4 | 4 | 8 | 4 | 5 | 11 | 8 | 13 | 5 | 3 | 3 | – | 6 | – | 9 | – | 6 | 7 | 15 | 9 | 9 | – | – |
North Africa and West/Central Asia:
| Country | 2022 | 2021 | 2020 | 2019 | 2018 | 2017 | 2016 | 2015 | 2014 | 2013 | 2012 | 2011 | 2010 | 2009 | 2008 | 2007 | 2006 | 2005 | 2004 | 2003 | 2002 | 2001 | 2000 | 1999 |
|---|---|---|---|---|---|---|---|---|---|---|---|---|---|---|---|---|---|---|---|---|---|---|---|---|
| Total from North Africa and West/Central Asia | 96 232 | 60 187 | 70 738 | 88 395 | 109 877 | 115 319 | 121 041 | 103 916 | 101 467 | 79 708 | 88 505 | 92 239 | 92 773 | 95 731 | 81 418 | 73 859 | 93 324 | 81 902 | 60 969 | 44 084 | 63 690 | 63 060 | 51 994 | 41 475 |
| Afghanistan | 14 193 | 9 488 | 11 407 | 10 136 | 12 935 | 19 538 | 12 513 | 8 328 | 10 527 | 2 196 | 1 617 | 1 648 | 2 017 | 3 165 | 2 813 | 1 753 | 3 417 | 4 749 | 2 137 | 1 252 | 1 759 | 1 202 | 1 011 | 877 |
| Iran | 9 407 | 5 734 | 8 805 | 6 640 | 10 116 | 13 791 | 13 298 | 13 114 | 11 615 | 12 863 | 12 916 | 14 822 | 14 182 | 18 553 | 13 852 | 10 460 | 13 947 | 13 887 | 10 434 | 7 230 | 12 960 | 10 425 | 8 487 | 7 176 |
| Egypt | 8 348 | 4 396 | 6 164 | 9 479 | 9 826 | 9 834 | 12 045 | 12 085 | 11 477 | 10 294 | 8 988 | 7 778 | 8 978 | 8 844 | 8 712 | 9 267 | 10 500 | 7 905 | 5 522 | 3 348 | 4 852 | 5 159 | 4 450 | 4 421 |
| Turkey | 7 001 | 4 465 | 4 359 | 5 713 | 5 585 | 4 844 | 4 469 | 4 201 | 3 834 | 4 144 | 4 162 | 4 403 | 4 483 | 4 958 | 4 210 | 4 425 | 4 941 | 4 614 | 3 835 | 3 029 | 3 375 | 3 215 | 2 606 | 2 215 |
| Yemen | 5 648 | 4 345 | 5 908 | 3 717 | 1 885 | 6 029 | 13 040 | 3 194 | 3 492 | 3 532 | 2 620 | 3 361 | 3 591 | 3 134 | 1 872 | 2 396 | 4 308 | 3 366 | 1 760 | 1 382 | 1 227 | 1 607 | 1 789 | 1 160 |
| Uzbekistan | 4 979 | 990 | 1 347 | 2 550 | 4 612 | 4 095 | 4 359 | 3 977 | 5 194 | 4 382 | 4 726 | 5 056 | 4 770 | 5 467 | 6 375 | 4 665 | 4 015 | 2 887 | 1 995 | 1 445 | 2 317 | 2 031 | 1 631 | 1 221 |
| Jordan | 4 779 | 3 416 | 3 063 | 4 998 | 5 322 | 5 264 | 5 269 | 4 664 | 5 187 | 4 188 | 4 099 | 3 876 | 3 868 | 4 282 | 3 936 | 3 917 | 4 038 | 3 748 | 3 431 | 2 927 | 3 964 | 4 572 | 3 900 | 3 269 |
| Morocco | 4 756 | 3 819 | 2 866 | 3 721 | 3 077 | 4 229 | 4 586 | 3 710 | 3 605 | 3 336 | 3 656 | 4 399 | 5 013 | 5 447 | 4 425 | 4 513 | 4 949 | 4 411 | 4 128 | 3 137 | 3 387 | 4 958 | 3614 | 2 970 |
| Israel | 3 439 | 3 103 | 3 687 | 4 304 | 3 706 | 3 802 | 4 142 | 3 965 | 3 805 | 3 996 | 4 153 | 3 826 | 4 515 | 5 612 | 5 851 | 4 496 | 5 943 | 5 755 | 4 160 | 2 741 | 3 826 | 3 744 | 2 783 | 1 847 |
| Lebanon | 3 434 | 2 253 | 2 120 | 2 605 | 2 581 | 2 818 | 2 971 | 2 813 | 3 245 | 2 783 | 2 879 | 3 295 | 3 487 | 3 831 | 4 254 | 4 267 | 4 083 | 4 282 | 3 818 | 2 956 | 3 935 | 4 579 | 3 662 | 3 033 |
| Syria | 3 248 | 1 748 | 3 176 | 5 967 | 14 686 | 5 877 | 4 800 | 3 840 | 3 540 | 3 366 | 3 014 | 2 785 | 2 555 | 2 442 | 2 641 | 2 385 | 2 918 | 2 831 | 2 256 | 1 938 | 2 557 | 3 350 | 2 367 | 2 048 |
| Algeria | 3 125 | 1 898 | 1 581 | 2 299 | 2 123 | 2 139 | 2 180 | 1 775 | 1 669 | 1 241 | 1 369 | 1 364 | 1 305 | 1 485 | 1 037 | 1 036 | 1 300 | 1 115 | 805 | 759 | 1 030 | 875 | 906 | 789 |
| Armenia | 3 037 | 1 833 | 2 145 | 3 101 | 3 217 | 3 437 | 3 543 | 2 962 | 2 913 | 2 722 | 2 681 | 2 983 | 2 979 | 3 442 | 3 586 | 4 351 | 6 317 | 2 591 | 1 833 | 1 287 | 1 800 | 1 762 | 1 253 | 1 250 |
| Iraq | 2 797 | 1 726 | 2 266 | 6 514 | 14 351 | 14 203 | 18 904 | 21 107 | 19 153 | 9 552 | 20 369 | 21 133 | 19 855 | 12 110 | 4 795 | 3 765 | 4 337 | 4 077 | 3 494 | 2 450 | 5 174 | 4 965 | 5 087 | 3 360 |
| Saudi Arabia | 2 764 | 1 780 | 1 854 | 2 514 | 2 100 | 2 135 | 2 117 | 1 744 | 1 696 | 1 463 | 1 343 | 1 396 | 1 263 | 1 418 | 1 194 | 1 171 | 1 542 | 1 210 | 906 | 735 | 1 014 | 1 178 | 1 063 | 759 |
| Georgia | 2 303 | 1 239 | 1 179 | 1 691 | 1 643 | 1 629 | 1 635 | 1 410 | 1 240 | 1 368 | 1 341 | 1 490 | 1 518 | 1 578 | 1 620 | 1 554 | 2 003 | 1 389 | 964 | 735 | 886 | 786 | 493 | 310 |
| U.A.E. | 1 960 | 1 332 | 1 251 | 1 586 | 1 379 | 1 314 | 1 370 | 1 193 | 1 039 | 910 | 854 | 707 | 779 | 697 | 693 | 758 | 1 006 | 812 | 596 | 380 | 472 | 461 | 436 | 310 |
| Kazakhstan | 1 787 | 1 330 | 1 307 | 1 533 | 1 378 | 1 377 | 1 310 | 1 201 | 1 221 | 1 241 | 1 202 | 1 235 | 1 282 | 1 562 | 1 630 | 1 604 | 2 073 | 2 223 | 1 906 | 1 740 | 2 315 | 2 310 | 1 493 | 723 |
| Kyrgyzstan | 1 637 | 710 | 594 | 881 | 908 | 715 | 847 | 790 | 707 | 652 | 648 | 542 | 507 | 574 | ||||||||||
| Sudan | 1 371 | 871 | 1 867 | 2 949 | 3 658 | 3 515 | 3 159 | 3 580 | 2 442 | 1 945 | 2 471 | 2 628 | 2 397 | 3 577 | 3 598 | 2 930 | 5 504 | 5 231 | 3 211 | 1 883 | 2 921 | 1 650 | 1 531 | 1 346 |
| Azerbaijan | 1 129 | 545 | 814 | 1 169 | 1 015 | 881 | 784 | 676 | 672 | 637 | 663 | 728 | 781 | 834 | ||||||||||
| Kuwait | 1 116 | 916 | 768 | 1 201 | 1 090 | 1 177 | 1 186 | 1 055 | 1 057 | 937 | 1 044 | 973 | 1 037 | 1 124 | 1 104 | 1 017 | 1 230 | 1 152 | 1 091 | 710 | 1 063 | 1 270 | 1 018 | 803 |
| Tajikistan | 951 | 538 | 523 | 1 158 | 893 | 652 | 593 | 595 | 516 | 550 | 411 | 382 | 299 | 265 | ||||||||||
| Turkmenistan | 942 | 161 | 250 | 330 | 286 | 251 | 235 | 226 | 254 | 210 | 223 | |||||||||||||
| Libya | 709 | 409 | 514 | 511 | 499 | 780 | 642 | 734 | 524 | 376 | 315 | 357 | 355 | 296 | ||||||||||
| Tunisia | 569 | 514 | 463 | 510 | 517 | 535 | 518 | 518 | 429 | 445 | 422 | 440 | 418 | 416 | ||||||||||
| Qatar | 430 | 323 | 215 | 287 | 236 | 224 | 272 | 229 | 202 | 191 | 141 | |||||||||||||
| Oman | 210 | 154 | 118 | 148 | 110 | 104 | 116 | 85 | 90 | 73 | 74 | |||||||||||||
| Bahrain | 163 | 151 | 127 | 183 | 143 | 130 | 138 | 145 | 122 | 115 | 104 | |||||||||||||
| Rest | - | - | - | - | - | - | - | - | - | - | - | 632 | 539 | 880 | 3 220 | 3 129 | 4 953 | 3 667 | 2 687 | 2 020 | 2 856 | 2 961 | 2 414 | 1 588 |
Europe:
| Country | 2022 | 2021 | 2020 | 2019 | 2018 | 2017 | 2016 | 2015 | 2014 | 2013 | 2012 | 2011 | 2010 | 2009 | 2008 | 2007 | 2006 | 2005 | 2004 | 2003 | 2002 | 2001 | 2000 | 1999 |
|---|---|---|---|---|---|---|---|---|---|---|---|---|---|---|---|---|---|---|---|---|---|---|---|---|
| Total from Europe | 75 671 | 61 508 | 68 984 | 87 585 | 80 024 | 84 327 | 93 556 | 83 630 | 83 259 | 86 675 | 81 775 | 83 736 | 88 732 | 105 528 | 103 853 | 106 625 | 146 359 | 165 076 | 124 928 | 94 018 | 164 443 | 165 712 | 124 598 | 87 815 |
| Ukraine | 11 621 | 7 578 | 9 886 | 11 762 | 11 879 | 10 135 | 10 422 | 7 987 | 7 752 | 8 193 | 7 642 | 8 292 | 8 477 | 11 223 | 10 813 | 11 001 | 17 140 | 22 745 | 14 156 | 11 633 | 21 190 | 20 914 | 15 511 | 10 102 |
| United Kingdom | 9 143 | 9 229 | 9 655 | 11 337 | 9 908 | 10 948 | 12 673 | 12 592 | 12 225 | 12 984 | 12 014 | 11 572 | 12 792 | 15 748 | 14 348 | 14 545 | 17 207 | 19 800 | 14 915 | 9 527 | 16 297 | 18 278 | 13 273 | 7 647 |
| Russia | 8 906 | 5 525 | 7 967 | 9 822 | 8 621 | 8 918 | 9 297 | 8 799 | 9 079 | 9 753 | 9 969 | 7 944 | 6 718 | 8 238 | 11 695 | 9 426 | 13 159 | 18 055 | 17 410 | 13 935 | 20 771 | 20 313 | 16 940 | 12 321 |
| Albania | 5 945 | 2 612 | 3 508 | 5 366 | 5 049 | 5 722 | 5 773 | 4 653 | 3 828 | 3 186 | 3 364 | 3 612 | 4 711 | 5 137 | 5 754 | 5 737 | 7 914 | 5 947 | 3 840 | 3 362 | 3 765 | 4 358 | 4 755 | 3 695 |
| France | 4 351 | 4 107 | 4 053 | 4 787 | 4 276 | 4 782 | 5 159 | 4 693 | 4 284 | 4 425 | 3 862 | 3 653 | 3 861 | 4 491 | 4 872 | 3 423 | 4 258 | 4 399 | 3 595 | 2 375 | 3 797 | 4 569 | 3 442 | 2 196 |
| Germany | 4 088 | 3 900 | 3 913 | 4 848 | 4 443 | 4 662 | 5 306 | 5 436 | 5 584 | 6 032 | 5 812 | 6 125 | 6 888 | 7 583 | 7 091 | 7 582 | 8 436 | 9 264 | 7 099 | 5 064 | 8 888 | 9 790 | 7 565 | 5 166 |
| Italy | 3 477 | 3 069 | 3 184 | 3 822 | 3 329 | 3 655 | 4 078 | 3 544 | 3 298 | 2 960 | 2 673 | 2 443 | 2 579 | 2 892 | 2 514 | 2 569 | 3 215 | 3 066 | 2 346 | 1 644 | 2 578 | 3 096 | 2 448 | 1 512 |
| Poland | 3 192 | 2 970 | 3 341 | 4 700 | 4 357 | 4 845 | 5 603 | 5 275 | 5 689 | 6 430 | 6 300 | 6 863 | 7 643 | 8 754 | 8 354 | 10 355 | 17 051 | 15 351 | 14 326 | 10 510 | 12 711 | 11 769 | 10 090 | 8773 |
| Spain | 2 865 | 2 644 | 2 620 | 3 115 | 2 841 | 3 045 | 3 519 | 3 303 | 2 928 | 2 480 | 1 842 | 1 890 | 1 684 | 1 769 | 1 621 | 1 578 | 1 971 | 1 888 | 1 339 | 917 | 1 361 | 1 711 | 1 254 | 869 |
| Belarus | 2 172 | 1 435 | 1 723 | 2 263 | 1 951 | 1 919 | 2 127 | 1 994 | 2 015 | 1 970 | 1 659 | 1 964 | 2 038 | 2 407 | 2 390 | 2 328 | 3 086 | 3 503 | 2 255 | 1 858 | 2 923 | 2 901 | 2 170 | 1 320 |
| Romania | 1 827 | 1 846 | 1 994 | 2 616 | 2 448 | 2 953 | 3 554 | 3 376 | 3 246 | 3 773 | 3 748 | 3 882 | 4 003 | 4 910 | 4 930 | 5 802 | 7 137 | 7 103 | 4 571 | 3 655 | 4 887 | 6 628 | 6 863 | 5 678 |
| Moldova | 1 499 | 1 052 | 1 367 | 1 935 | 2 206 | 2 480 | 2 929 | 2 496 | 2 341 | 2 485 | 2 021 | 2 258 | 1 981 | 2 295 | 1 692 | 1 356 | 3 036 | 3 506 | 1 507 | 1 151 | 2 103 | 2 068 | 1 251 | 753 |
| Ireland | 1 366 | 1 364 | 1 466 | 1 760 | 1 401 | 1 485 | 1 759 | 1 607 | 1 605 | 1 626 | 1 514 | 1 371 | 1 507 | 1 637 | 1 465 | 1 503 | 1 906 | 2 088 | 1 531 | 983 | 1 398 | 1 505 | 1 296 | 804 |
| Soviet Union (former) | 1 236 | 1 082 | 1 070 | 1 227 | 1 022 | 939 | 1 042 | 1 022 | 1 136 | 1 264 | 1 296 | 3 687 | 4 978 | 5 911 | 5 270 | 5 090 | 6 229 | 2 899 | 929 | 1 072 | 2 403 | 2 707 | 3 263 | 5 022 |
| Bulgaria | 1 151 | 1 000 | 1 118 | 1 759 | 1 798 | 2 184 | 2 670 | 2 688 | 2 981 | 2 844 | 2 440 | 2 661 | 2 570 | 3 133 | 2 960 | 3 981 | 4 828 | 5 635 | 4 253 | 3 825 | 3 608 | 4 400 | 4 917 | 4 171 |
| North Macedonia | 979 | 745 | 590 | 1 079 | 1 082 | 1 027 | 1 262 | 1 060 | 960 | 895 | 906 | 1 078 | 963 | 1 128 | ||||||||||
| Netherlands | 972 | 1 009 | 962 | 1 274 | 998 | 1 056 | 1 319 | 1 309 | 1 195 | 1 142 | 1 091 | 1 085 | 1 321 | 1 499 | 1 240 | 1 368 | 1 651 | 1 815 | 1 303 | 981 | 1 549 | 1 679 | 1 337 | 773 |
| Greece | 918 | 842 | 945 | 1 350 | 1 214 | 1 314 | 1 451 | 1 211 | 1 235 | 1 361 | 1 054 | 949 | 745 | 798 | 769 | 882 | 1 124 | 1 070 | 769 | 651 | 1 009 | 1 155 | 950 | 719 |
| Kosovo | 853 | 562 | 678 | 1 020 | 886 | 1 014 | 1 020 | 814 | 758 | 839 | 782 | 670 | 355 | |||||||||||
| Hungary | 840 | 730 | 761 | 1 070 | 917 | 972 | 1 048 | 1 095 | 996 | 1 052 | 1 054 | 1 044 | 1 022 | 1 314 | ||||||||||
| Sweden | 751 | 788 | 835 | 1 018 | 889 | 950 | 1 144 | 1 066 | 954 | 1 106 | 968 | 979 | 1 097 | 1 138 | ||||||||||
| Portugal | 746 | 750 | 679 | 940 | 889 | 939 | 1 006 | 857 | 892 | 918 | 811 | 821 | 755 | 946 | ||||||||||
| Serbia | 636 | 810 | 1 077 | 1 532 | 1 217 | 1 410 | 1 351 | 1 278 | 1 143 | 866 | 704 | 244 | 20 | |||||||||||
| Switzerland | 614 | 614 | 592 | 595 | 570 | 565 | 743 | 640 | 656 | 697 | 635 | 615 | 675 | 798 | ||||||||||
| Belgium | 552 | 601 | 629 | 714 | 537 | 625 | 691 | 662 | 632 | 675 | 574 | 567 | 592 | 686 | ||||||||||
| Lithuania | 506 | 487 | 475 | 750 | 658 | 645 | 735 | 750 | 747 | 854 | 924 | 936 | 985 | 1 069 | ||||||||||
| Bosnia and Herzegovina | 506 | 478 | 477 | 637 | 682 | 846 | 971 | 859 | 693 | 697 | 815 | 878 | 946 | 1 501 | ||||||||||
| Czech R. | 474 | 496 | 454 | 714 | 534 | 582 | 650 | 637 | 606 | 676 | 677 | 303 | 190 | 146 | ||||||||||
| Austria | 344 | 359 | 311 | 437 | 401 | 387 | 432 | 474 | 438 | 415 | 407 | 424 | 442 | 512 | ||||||||||
| Finland | 288 | 324 | 317 | 497 | 442 | 439 | 489 | 407 | 350 | 331 | 348 | 363 | 397 | 423 | ||||||||||
| Rest* | 2 853 | 2 500 | 2 337 | 2 839 | 2 568 | 2 884 | 3 333 | 1 046 | 3 013 | 3 620 | 3 762 | 4 462 | 5 675 | 6 120 | 18 345 | 18 631 | 26 835 | 36 204 | 28 083 | 21 418 | 53 047 | 47 655 | 27 113 | 16 188 |
* Croatia, Czechoslovakia (former), Denmark, Estonia, Iceland, Latvia, Luxembourg, Malta, Monaco, Montenegro, Norway, Serbia and Montenegro (former), Slovakia, Slovenia
Sub-Saharan Africa:
| Country | 2022 | 2021 | 2020 | 2019 | 2018 | 2017 | 2016 | 2015 | 2014 | 2013 | 2012 | 2011 | 2010 | 2009 | 2008 | 2007 | 2006 | 2005 | 2004 | 2003 | 2002 | 2001 | 2000 | 1999 |
|---|---|---|---|---|---|---|---|---|---|---|---|---|---|---|---|---|---|---|---|---|---|---|---|---|
| Total from Sub-Saharan Africa | 70 691 | 54 226 | 63 071 | 91 523 | 95 842 | 97 628 | 90 167 | 78 878 | 78 181 | 80 664 | 90 007 | 83 400 | 82 885 | 106 974 | 87 443 | 76 353 | 94 375 | 65 705 | 52 104 | 39 013 | 47 206 | 40 420 | 33 541 | 26 740 |
| Nigeria | 12 385 | 13 100 | 12 398 | 15 888 | 13 952 | 13 539 | 14 380 | 11 542 | 12 828 | 13 840 | 13 575 | 11 824 | 13 376 | 15 253 | 12 475 | 12 448 | 13 459 | 10 597 | 9 374 | 7 872 | 8 105 | 8 253 | 7 831 | 6 742 |
| Cameroon | 5 879 | 3 578 | 2 842 | 4 369 | 4 236 | 4 668 | 4 899 | 4 374 | 3 943 | 3 908 | 3 815 | 4 754 | 4 161 | 3 463 | 3 771 | 3 392 | 2 919 | 1 458 | 1 309 | 927 | 984 | 791 | 860 | 824 |
| Ethiopia | 5 720 | 3 706 | 6 280 | 9 060 | 12 403 | 14 637 | 13 232 | 11 394 | 12 300 | 13 097 | 14 544 | 13 793 | 14 266 | 15 462 | 12 917 | 12 786 | 16 152 | 10 571 | 8 286 | 6 635 | 7 565 | 5 092 | 4 053 | 4 262 |
| Ghana | 5 451 | 3 939 | 4 627 | 8 526 | 8 394 | 8 455 | 6 949 | 6 186 | 7 115 | 10 265 | 10 592 | 8 798 | 7 429 | 8 401 | 8 195 | 7 610 | 9 367 | 6 491 | 5 337 | 4 410 | 4 248 | 4 023 | 4 339 | 3 707 |
| Kenya | 5 014 | 3 088 | 4 026 | 7 052 | 7 190 | 6 957 | 6 274 | 5 602 | 5 884 | 6 123 | 7 043 | 7 762 | 7 421 | 9 880 | 6 998 | 7 030 | 8 779 | 5 347 | 5 335 | 3 209 | 3 199 | 2 501 | 2 197 | 1 407 |
| Democratic Rep. of Congo | 4 688 | 3 906 | 7 522 | 8 999 | 9 941 | 8 709 | 6 791 | 5 345 | 4 347 | 2 792 | 3 731 | 2 424 | 1 764 | 2 122 | 1 261 | 1 129 | 738 | 260 | 155 | 110 | 178 | 145 | 123 | 87 |
| South Africa | 3 535 | 2 716 | 2 733 | 3 174 | 3 010 | 2 912 | 3 023 | 2 907 | 2 676 | 2 629 | 2 781 | 2 649 | 2 758 | 3 171 | 2 723 | 2 988 | 3 201 | 4 536 | 3 370 | 2 210 | 3 861 | 4 090 | 2 824 | 1 577 |
| Liberia | 2 412 | 2 504 | 1 674 | 3 495 | 3 101 | 4 155 | 3 619 | 3 795 | 3 874 | 3 334 | 4 109 | 4 151 | 4 837 | 7 641 | 7 193 | 4 102 | 6 887 | 4 880 | 2 757 | 1 766 | 2 869 | 2 273 | 1 570 | 1 351 |
| Sierra Leone | 2 323 | 1 227 | 713 | 1 443 | 1 527 | 2 058 | 1 535 | 1 599 | 1 740 | 1 651 | 1 688 | 1 985 | 2 011 | 2 687 | 2 795 | 1 999 | 3 572 | 2 731 | 1 596 | 1 492 | 2 246 | 1 878 | 1 585 | 970 |
| Togo | 1 887 | 1 143 | 1 276 | 1 546 | 1 534 | 1 572 | 1 938 | 1 547 | 1 612 | 1 257 | 1 756 | 1 506 | 1 563 | 1 680 | 1 661 | 1 565 | 1 720 | 1 523 | 2 041 | 1 187 | 935 | 487 | 386 | 254 |
| Eritrea | 1 760 | 1 304 | 1 881 | 2 385 | 2 428 | 2 449 | 2 267 | 2 220 | 2 002 | 2 138 | 2 643 | 2 102 | 1 656 | 1 928 | 1 270 | 1 081 | 1 593 | 796 | 675 | 556 | 560 | 540 | 382 | 325 |
| Tanzania | 1 643 | 1 438 | 2 312 | 3 142 | 3 186 | 1 415 | 788 | 799 | 774 | 837 | 1 516 | 1 427 | 1 850 | 2 773 | 838 | |||||||||
| Uganda | 1 620 | 1 146 | 1 802 | 2 560 | 2 412 | 1 898 | 1 649 | 1 664 | 1 409 | 1 350 | 1 340 | 1 239 | 1 085 | 1 364 | 1 174 | 1 122 | 1 372 | 858 | 721 | 455 | 575 | 457 | 418 | 250 |
| Côte d'Ivoire | 1 559 | 1 207 | 1 049 | 1 589 | 1 375 | 1 810 | 1 617 | 1 497 | 1 477 | 1 486 | 1 760 | 1 302 | 1 621 | 2 159 | 1 645 | 1 193 | 2 067 | 930 | 666 | 483 | 629 | 596 | 439 | 303 |
| Rwanda | 1 540 | 784 | 1 084 | 1 509 | 1 620 | 1 394 | 1 357 | 732 | 555 | 540 | 592 | 520 | 489 | 952 | 378 | |||||||||
| Zimbabwe | 1 433 | 737 | 674 | 758 | 749 | 810 | 815 | 779 | 797 | 924 | 914 | 1 016 | 1 274 | 983 | ||||||||||
| Guinea | 1 365 | 745 | 858 | 1 579 | 1 282 | 1 348 | 1 501 | 1 389 | 1 375 | 1 518 | 1 656 | 1 555 | 1 379 | 1 725 | 1 735 | 1 088 | 1 110 | 495 | 347 | 29 | 16 | 11 | 5 | 3 |
| Senegal | 1 253 | 962 | 999 | 1 665 | 1 420 | 1 470 | 1 533 | 1 244 | 1 273 | 1 340 | 1 615 | 1 424 | 1 285 | 1 524 | 1 149 | 1 024 | 1 367 | 913 | 769 | 522 | 530 | 663 | 554 | 368 |
| Cabo Verde | 1 119 | 941 | 995 | 1 852 | 1 929 | 2 618 | 2 242 | 1 253 | 1 154 | 1 673 | 1 684 | 1 808 | 1 668 | 2 238 | 1 916 | 2 048 | 1 780 | 1 225 | 1 015 | 745 | 871 | 868 | 1 079 | 902 |
| Somalia | 1 042 | 961 | 2 024 | 3 752 | 7 557 | 7 404 | 6 958 | 6 796 | 5 190 | 3 764 | 5 204 | 4 451 | 4 558 | 13 390 | 10 745 | 6 251 | 9 462 | 5 829 | 3 929 | 2 444 | 4 535 | 3 007 | 2 393 | 1 690 |
| Gambia | 1 010 | 778 | 664 | 1 378 | 1 023 | 1 134 | 1 247 | 1 142 | 1 111 | 1 018 | 1 159 | 972 | 859 | 978 | 739 | 826 | 897 | 581 | 422 | 263 | 343 | 390 | 231 | 183 |
| Burkina Faso | 814 | 551 | 465 | 646 | 525 | 541 | 642 | 575 | 583 | 585 | 558 | 433 | 377 | 416 | ||||||||||
| Burundi | 788 | 730 | 1 099 | 781 | 762 | 1 094 | 415 | 351 | 273 | 260 | 535 | 593 | 841 | 1 505 | 255 | |||||||||
| Benin | 721 | 467 | 450 | 619 | 573 | 648 | 577 | 466 | 517 | 342 | 415 | 462 | 486 | 401 | ||||||||||
| Rep. of Congo | 527 | 219 | 308 | 476 | 580 | 632 | 625 | 496 | 552 | 1 059 | 1 461 | 1 371 | 968 | 1 563 | ||||||||||
| Mali | 481 | 378 | 389 | 586 | 488 | 544 | 598 | 587 | 604 | 667 | 734 | 629 | 528 | 576 | ||||||||||
| Zambia | 365 | 361 | 401 | 511 | 477 | 537 | 487 | 460 | 441 | 505 | 643 | 652 | 628 | 704 | ||||||||||
| Rest* | 2 357 | 1 610 | 1 526 | 2 183 | 2 168 | 2 540 | 2 214 | 2 101 | 1 775 | 1 927 | 1 798 | 1 747 | 2 034 | 5 610 | 6 671 | 7 933 | 5 684 | 4 000 | 3 698 | 4 957 | 4 355 | 2 274 | 1 533 |
* Angola, Botswana, Central African Republic, Chad, Djibouti, Equatorial Guinea, Eswatini, Gabon, Guinea-Bissau, Lesotho, Madagascar, Malawi, Mauritania, Mauritius, Mozambique, Namibia, Niger, São Tomé and Príncipe, Seychelles, South Sudan
Australia and Oceania:
| Country | 2022 | 2021 | 2020 | 2019 | 2018 | 2017 | 2016 | 2015 | 2014 | 2013 | 2012 | 2011 | 2010 | 2009 | 2008 | 2007 | 2006 | 2005 | 2004 | 2003 | 2002 | 2001 | 2000 | 1999 |
|---|---|---|---|---|---|---|---|---|---|---|---|---|---|---|---|---|---|---|---|---|---|---|---|---|
| Total from Australia & Oceania | 5 105 | 4 131 | 3 980 | 5 340 | 4 653 | 5 049 | 5 577 | 5 385 | 5 098 | 5 265 | 4 728 | 4 962 | 5 337 | 5 563 | 5 254 | 6 090 | 7 372 | 6 526 | 5 967 | 4 335 | 5 482 | 6 052 | 5 089 | 3 636 |
| Australia | 2 859 | 2 682 | 2 523 | 3 205 | 2 693 | 2 906 | 3 239 | 3 034 | 2 809 | 2 759 | 2 414 | 2 343 | 2 512 | 2 622 | 2 464 | 2 518 | 3 249 | 3 193 | 2 604 | 1 836 | 2 557 | 2 811 | 2 044 | 1 103 |
| Fiji | 1 124 | 419 | 425 | 734 | 730 | 805 | 866 | 875 | 802 | 895 | 853 | 1 041 | 1 201 | 1 194 | ||||||||||
| New Zealand | 650 | 665 | 607 | 844 | 719 | 798 | 846 | 855 | 796 | 921 | 814 | 803 | 919 | 947 | ||||||||||
| Rest* | 472 | 365 | 425 | 557 | 511 | 540 | 626 | 621 | 691 | 690 | 647 | 775 | 705 | 800 | 2 790 | 3 572 | 4 123 | 3 333 | 3 363 | 2 499 | 2 925 | 3 241 | 3 045 | 2 533 |
* American Samoa, French Polynesia, Kiribati, Marshall Islands, Micronesia, New Caledonia, Palau, Papua New Guinea, Samoa, Solomon Islands, Tonga.
Total percentage of U.S racial groups by U.S region, state and overall nationally
Non-Hispanic White population as a percentage of the total population by U.S. region and state (1940–2020)
| State/Territory | 1940 | 1970 | 1980 | 1990 | 2000 | 2010 | 2016 | 2018 | 2020 |
|---|---|---|---|---|---|---|---|---|---|
| 88.4 | 83.2 | 79.6 | 75.6 | 69.1 | 63.7 | ||||
| Northeast | 95.7 | 86.9 | 83.4 | 79.4 | |||||
| Midwest | 96.1 | 90.0 | 87.5 | 85.8 | |||||
| South | 74.1 | 76.1 | 74.3 | 71.8 | |||||
| West | 90.0 | 79.6 | 73.5 | 66.7 | |||||
| 65.3% | 73.3% | 73.3% | 73.3% | 70.3% | 67.0% | 65.8% | 65.3% | 63.1% | |
| 48.3% | 77.2% | 75.8% | 73.9% | 67.6% | 64.1% | 61.2% | 60.2% | 57.5% | |
| 65.1% | 74.3% | 74.5% | 71.7% | 63.8% | 57.8% | 55.5% | 54.3% | 53.4% | |
| 75.2% | 81.0% | 82.2% | 82.2% | 78.6% | 74.5% | 72.9% | 72.1% | 68.5% | |
| 89.5% | 76.3% | 66.6% | 57.2% | 46.7% | 40.1% | 37.7% | 36.6% | 34.7% | |
| 90.3% | 84.6% | 82.7% | 80.7% | 74.5% | 70.0% | 68.6% | 67.8% | 65.1% | |
| 97.9% | 91.4% | 88.0% | 83.8% | 77.5% | 71.2% | 67.7% | 66.3% | 63.2% | |
| 86.4% | 84.1% | 81.3% | 79.3% | 72.5% | 65.3% | 62.9% | 61.9% | 58.6% | |
| 71.4% | 26.5% | 25.7% | 27.4% | 27.8% | 34.8% | 36.4% | 37.0% | 38.0% | |
| 71.5% | 77.9% | 76.7% | 73.2% | 65.4% | 57.9% | 54.9% | 53.3% | 51.5% | |
| 65.2% | 73.4% | 71.6% | 70.1% | 62.6% | 55.9% | 53.4% | 52.2% | 50.1% | |
| 24.5% | 38.0% | 31.1% | 31.4% | 22.9% | 22.7% | 22.1% | 21.7% | 21.6% | |
| 98.4% | 95.9% | 93.9% | 92.2% | 88.0% | 84.0% | 82.4% | 81.7% | 78.9% | |
| 94.7% | 83.5% | 78.0% | 74.8% | 67.8% | 63.7% | 61.7% | 60.9% | 58.3% | |
| 96.3% | 91.7% | 90.2% | 89.6% | 85.8% | 81.5% | 79.6% | 78.7% | 75.5% | |
| 99.2% | 98.0% | 96.9% | 95.9% | 92.6% | 88.7% | 86.2% | 85.4% | 82.7% | |
| 95.6% | 92.7% | 90.5% | 88.4% | 83.1% | 78.2% | 76.3% | 75.6% | 72.2% | |
| 92.5% | 92.4% | 91.7% | 91.7% | 89.3% | 86.3% | 85.0% | 84.5% | 81.3% | |
| 63.7% | 68.2% | 67.6% | 65.8% | 62.5% | 60.3% | 59.0% | 58.4% | 55.8% | |
| 99.7% | 99.1% | 98.3% | 98.0% | 96.5% | 94.4% | 93.5% | 93.1% | 90.2% | |
| 83.3% | 80.4% | 73.9% | 69.6% | 62.1% | 54.7% | 51.5% | 50.2% | 47.2% | |
| 98.6% | 95.4% | 92.3% | 87.8% | 81.9% | 76.1% | 72.7% | 70.8% | 67.6% | |
| 95.7% | 87.1% | 84.1% | 82.3% | 78.6% | 76.6% | 75.4% | 74.8% | 72.4% | |
| 99.0% | 97.7% | 96.1% | 93.7% | 88.2% | 83.1% | 80.6% | 79.4% | 76.3% | |
| 50.6% | 62.6% | 63.6% | 63.1% | 60.7% | 58.0% | 56.9% | 56.4% | 55.4% | |
| 93.4% | 88.6% | 87.7% | 86.9% | 83.8% | 81.0% | 79.7% | 79.3% | 75.8% | |
| 96.2% | 94.7% | 93.4% | 91.8% | 89.5% | 87.8% | 86.5% | 85.8% | 83.1% | |
| 98.2% | 95.2% | 94.0% | 92.5% | 87.3% | 82.1% | 79.6% | 78.5% | 75.7% | |
| 91.6% | 86.7% | 83.2% | 78.7% | 65.2% | 54.1% | 49.9% | 48.5% | 45.9% | |
| 99.9% | 99.1% | 98.4% | 97.3% | 95.1% | 92.3% | 90.8% | 89.8% | 87.2% | |
| 94.3% | 84.7% | 79.1% | 74.0% | 66.0% | 59.3% | 55.8% | 54.6% | 51.9% | |
| 50.9% | 53.8% | 52.6% | 50.4% | 44.7% | 40.5% | 38.1% | 36.9% | 36.5% | |
| 94.6% | 80.1% | 75.0% | 69.3% | 62.0% | 58.3% | 55.8% | 55.2% | 52.5% | |
| 71.9% | 76.5% | 75.3% | 75.0% | 70.2% | 65.3% | 63.5% | 62.7 | 60.5% | |
| 98.3% | 96.9% | 95.5% | 94.2% | 91.7% | 88.9% | 85.0% | 83.8% | 81.7% | |
| 95.0% | 89.8% | 88.2% | 87.1% | 84.0% | 81.1% | 79.5% | 78.6% | 75.9% | |
| 89.9% | 88.1% | 85.0% | 81.0% | 74.1% | 68.7% | 66.2% | 65.1% | 60.8% | |
| 98.6% | 95.8% | 93.3% | 90.8% | 83.5% | 78.5% | 76.4% | 75.1% | 71.7% | |
| 95.1% | 90.3% | 89.1% | 87.7% | 84.1% | 79.5% | 77.0% | 75.9 | 73.5% | |
| 98.3% | 96.1% | 93.4% | 89.3% | 81.9% | 76.4% | 73.3% | 71.4% | 68.7% | |
| 57.1% | 69.0% | 68.3% | 68.5% | 66.1% | 64.1% | 63.9% | 63.5% | 62.1% | |
| 96.2% | 94.6% | 92.3% | 91.2% | 88.0% | 84.7% | 82.5% | 81.3% | 79.6% | |
| 82.5% | 83.7% | 83.1% | 82.6% | 79.2% | 75.6% | 74.2% | 73.6% | 70.9% | |
| 74.1% | 69.6% | 65.7% | 60.6% | 52.4% | 45.3% | 42.6% | 41.4% | 39.7% | |
| 98.2% | 93.6% | 92.4% | 91.2% | 85.3% | 80.4% | 78.8% | 77.8% | 75.4% | |
| 99.7% | 99.2% | 98.5% | 98.1% | 96.2% | 94.3% | 93.1% | 92.7% | 89.1% | |
| 75.3% | 80.1% | 78.2% | 76.0% | 70.2% | 64.8% | 62.4% | 61.3% | 58.6% | |
| 97.7% | 93.6% | 90.2% | 86.7% | 78.9% | 72.5% | 69.5% | 67.8% | 63.8% | |
| 93.7% | 95.7% | 95.6% | 95.8% | 94.6% | 93.2% | 92.3% | 92.0% | 89.1% | |
| 99.2% | 95.6% | 93.6% | 91.3% | 87.3% | 83.3% | 81.7% | 81.0% | 78.6% | |
| 95.9% | 92.1% | 92.0% | 91.0% | 88.9% | 85.9% | 84.1% | 83.9% | 81.4% | |
| - | - | - | - | 0.9% | 0.7% | 0.6% | 0.7% | - |
Black population as a percentage of the total population by U.S. region and state (1790–2020)
Many Southern U.S. states historically had African Americans compose 35% or more of their total population(s), with three of them (Louisiana, Mississippi, and South Carolina) even having an African American majority at certain periods in their history. In contrast, the African American percentage of the total population in other parts of the U.S. (outside of the South) was historically almost always in the single digits (0.0% to 9.9%). Even after the Great Migration, no or almost no U.S. state outside of the Southern U.S. has ever had an African American percentage of its total population be greater than 16%. The Black proportion has declined since the 1990s due to gentrification and expanding opportunities, with many Blacks moving to Texas, Georgia, Florida, and Maryland and others migrating to jobs in states of the New South in a reverse of the Great Migration.[26]
- African American population distribution over time
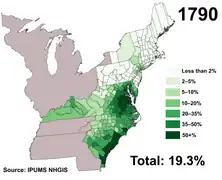 1790
1790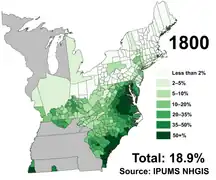 1800
1800 1810
1810 1820
1820 1830
1830 1840
1840 1850
1850 1860
1860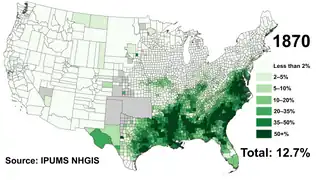 1870
1870
| State/territory | 1790 | 1800 | 1810 | 1820 | 1830 | 1840 | 1850 | 1860 | 1870 | 1880 | 1890 | 1900 | 1910 | 1920 | 1930 | 1940 | 1950 | 1960 | 1970 | 1980 | 1990 | 2000 | 2010 | 2020 |
|---|---|---|---|---|---|---|---|---|---|---|---|---|---|---|---|---|---|---|---|---|---|---|---|---|
| 19.3% | 18.9% | 19.0% | 18.4% | 18.1% | 16.8% | 15.7% | 14.1% | 12.7% | 13.1% | 11.9% | 11.6% | 10.7% | 9.9% | 9.7% | 9.8% | 10.0% | 10.5% | 11.1% | 11.7% | 12.1% | 12.3% | 12.6% | 12.4% | |
| Northeast | 3.4% | 3.2% | 2.9% | 2.5% | 2.3% | 2.1% | 1.7% | 1.5% | 1.5% | 1.6% | 1.6% | 1.8% | 1.9% | 2.3% | 3.3% | 3.8% | 5.1% | 6.8% | 8.9% | 9.9% | 11.0% | 11.4% | 11.8% | 11.5% |
| Midwest | 1.2% | 2.4% | 2.1% | 2.6% | 2.7% | 2.5% | 2.0% | 2.1% | 2.2% | 1.9% | 1.9% | 1.8% | 2.3% | 3.3% | 3.5% | 5.0% | 6.7% | 8.1% | 9.1% | 9.6% | 10.1% | 10.4% | 10.4% | |
| South | 35.2% | 35.0% | 36.7% | 37.2% | 37.9% | 38.0% | 37.3% | 36.8% | 36.0% | 36.0% | 33.8% | 32.3% | 29.8% | 26.9% | 24.7% | 23.8% | 21.7% | 20.6% | 19.1% | 18.6% | 18.5% | 18.9% | 19.2% | 18.6% |
| West | 0.7% | 0.7% | 0.6% | 0.7% | 0.9% | 0.7% | 0.7% | 0.9% | 1.0% | 1.2% | 2.9% | 3.9% | 4.9% | 5.2% | 5.4% | 4.9% | 4.8% | 4.6% | ||||||
| 41.4% | 29.0% | 33.2% | 38.5% | 43.3% | 44.7% | 45.4% | 47.7% | 47.5% | 44.8% | 45.2% | 42.5% | 38.4% | 35.7% | 34.7% | 32.0% | 30.0% | 26.2% | 25.6% | 25.3% | 26.0% | 26.2% | 25.8% | ||
| 0.3% | 0.3% | 0.2% | 0.2% | 0.2% | 3.0% | 3.0% | 3.4% | 4.1% | 3.5% | 3.3% | 3.0% | |||||||||||||
| 0.3% | 0.3% | 0.4% | 1.5% | 1.5% | 1.0% | 2.4% | 2.5% | 3.0% | 3.5% | 3.3% | 3.0% | 2.8% | 3.0% | 3.1% | 4.1% | 4.7% | ||||||||
| 13.0% | 11.7% | 15.5% | 20.9% | 22.7% | 25.6% | 25.2% | 26.3% | 27.4% | 28.0% | 28.1% | 27.0% | 25.8% | 24.8% | 22.3% | 21.8% | 18.3% | 16.3% | 15.9% | 15.7% | 15.4% | 15.1% | |||
| 1.0% | 1.1% | 0.8% | 0.7% | 0.9% | 0.7% | 0.9% | 1.1% | 1.4% | 1.8% | 4.4% | 5.6% | 7.0% | 7.7% | 7.4% | 6.7% | 6.2% | 5.7% | |||||||
| 0.1% | 1.1% | 1.3% | 1.5% | 1.6% | 1.4% | 1.2% | 1.1% | 1.1% | 1.5% | 2.3% | 3.0% | 3.5% | 4.0% | 3.8% | 4.0% | 4.1% | ||||||||
| 2.3% | 2.5% | 2.6% | 2.9% | 2.7% | 2.6% | 2.1% | 1.9% | 1.8% | 1.9% | 1.6% | 1.7% | 1.4% | 1.5% | 1.8% | 1.9% | 2.7% | 4.2% | 6.0% | 7.0% | 8.3% | 9.1% | 10.1% | 10.8% | |
| 21.6% | 22.4% | 23.8% | 24.0% | 24.9% | 25.0% | 22.2% | 19.3% | 18.2% | 18.0% | 16.8% | 16.6% | 15.4% | 13.6% | 13.7% | 13.5% | 13.7% | 13.6% | 14.3% | 16.1% | 16.9% | 19.2% | 21.4% | 22.1% | |
| 30.4% | 33.1% | 31.2% | 30.1% | 29.1% | 26.6% | 19.1% | 33.0% | 33.6% | 32.8% | 31.1% | 28.5% | 25.1% | 27.1% | 28.2% | 35.0% | 53.9% | 71.1% | 70.3% | 65.8% | 60.0% | 50.7% | 41.4% | ||
| 47.1% | 48.7% | 46.0% | 44.6% | 48.8% | 47.0% | 42.5% | 43.7% | 41.0% | 34.0% | 29.4% | 27.1% | 21.8% | 17.8% | 15.3% | 13.8% | 13.6% | 14.6% | 16.0% | 15.1% | |||||
| 35.9% | 37.1% | 42.5% | 44.4% | 42.6% | 41.0% | 42.4% | 44.0% | 46.0% | 47.0% | 46.7% | 46.7% | 45.1% | 41.7% | 36.8% | 34.7% | 30.9% | 28.5% | 25.9% | 26.8% | 27.0% | 28.7% | 30.5% | 31.0% | |
| 0.2% | 0.4% | 0.1% | 0.2% | 0.1% | 0.5% | 0.8% | 1.0% | 1.8% | 2.5% | 1.8% | 1.6% | 1.6% | ||||||||||||
| 0.4% | 0.2% | 0.2% | 0.2% | 0.2% | 0.2% | 0.2% | 0.1% | 0.2% | 0.2% | 0.3% | 0.3% | 0.3% | 0.4% | 0.6% | 0.9% | |||||||||
| 7.4% | 6.4% | 2.5% | 1.5% | 0.8% | 0.6% | 0.4% | 1.1% | 1.5% | 1.5% | 1.8% | 1.9% | 2.8% | 4.3% | 4.9% | 7.4% | 10.3% | 12.8% | 14.7% | 14.8% | 15.1% | 14.5% | 14.1% | ||
| 4.4% | 2.6% | 1.0% | 1.1% | 1.0% | 1.1% | 0.8% | 1.5% | 2.0% | 2.1% | 2.3% | 2.2% | 2.8% | 3.5% | 3.6% | 4.4% | 5.8% | 6.9% | 7.6% | 7.8% | 8.4% | 9.1% | 9.6% | ||
| 0.4% | 0.2% | 0.2% | 0.5% | 0.6% | 0.6% | 0.6% | 0.7% | 0.8% | 0.7% | 0.7% | 0.8% | 0.9% | 1.2% | 1.4% | 1.7% | 2.1% | 2.9% | 4.1% | ||||||
| 0.6% | 4.7% | 4.3% | 3.5% | 3.5% | 3.2% | 3.3% | 3.5% | 3.6% | 3.8% | 4.2% | 4.8% | 5.3% | 5.8% | 5.7% | 5.9% | 5.7% | ||||||||
| 17.0% | 18.6% | 20.2% | 22.9% | 24.7% | 24.3% | 22.5% | 20.4% | 16.8% | 16.5% | 14.4% | 13.3% | 11.4% | 9.8% | 8.6% | 7.5% | 6.9% | 7.1% | 7.2% | 7.1% | 7.1% | 7.3% | 7.8% | 8.0% | |
| 55.2% | 51.8% | 58.5% | 55.0% | 50.7% | 49.5% | 50.1% | 51.5% | 50.0% | 47.1% | 43.1% | 38.9% | 36.9% | 35.9% | 32.9% | 31.9% | 29.8% | 29.4% | 30.8% | 32.5% | 32.0% | 31.4% | |||
| 0.6% | 0.5% | 0.4% | 0.3% | 0.3% | 0.3% | 0.2% | 0.2% | 0.3% | 0.2% | 0.2% | 0.2% | 0.2% | 0.2% | 0.1% | 0.2% | 0.1% | 0.3% | 0.3% | 0.3% | 0.4% | 0.5% | 1.2% | 1.9% | |
| 34.7% | 36.7% | 38.2% | 36.1% | 34.9% | 32.3% | 28.3% | 24.9% | 22.5% | 22.5% | 20.7% | 19.8% | 17.9% | 16.9% | 16.9% | 16.6% | 16.5% | 16.7% | 17.8% | 22.7% | 24.9% | 27.9% | 29.4% | 29.5% | |
| 1.4% | 1.5% | 1.4% | 1.3% | 1.2% | 1.2% | 0.9% | 0.8% | 1.0% | 1.0% | 1.0% | 1.1% | 1.1% | 1.2% | 1.2% | 1.3% | 1.6% | 2.2% | 3.1% | 3.9% | 5.0% | 5.4% | 6.6% | 7.0% | |
| 3.7% | 3.0% | 2.1% | 0.8% | 0.3% | 0.6% | 0.9% | 1.0% | 0.9% | 0.7% | 0.7% | 0.6% | 1.6% | 3.5% | 4.0% | 6.9% | 9.2% | 11.2% | 12.9% | 13.9% | 14.2% | 14.2% | 13.7% | ||
| 0.6% | 0.2% | 0.2% | 0.2% | 0.3% | 0.3% | 0.3% | 0.4% | 0.4% | 0.4% | 0.5% | 0.7% | 0.9% | 1.3% | 2.2% | 3.5% | 5.2% | 7.0% | |||||||
| 41.5% | 47.0% | 44.1% | 48.4% | 52.3% | 51.2% | 55.3% | 53.7% | 57.5% | 57.6% | 58.5% | 56.2% | 52.2% | 50.2% | 49.2% | 45.3% | 42.0% | 36.8% | 35.2% | 35.6% | 36.3% | 37.0% | 36.6% | ||
| 17.6% | 15.9% | 18.3% | 15.6% | 13.2% | 10.0% | 6.9% | 6.7% | 5.6% | 5.2% | 4.8% | 5.2% | 6.2% | 6.5% | 7.5% | 9.0% | 10.3% | 10.5% | 10.7% | 11.2% | 11.6% | 11.4% | |||
| 0.9% | 0.9% | 1.0% | 0.6% | 0.2% | 0.3% | 0.2% | 0.2% | 0.2% | 0.2% | 0.3% | 0.2% | 0.3% | 0.3% | 0.4% | 0.5% | |||||||||
| 0.3% | 0.6% | 0.5% | 0.8% | 0.6% | 0.6% | 1.0% | 1.0% | 1.1% | 1.5% | 2.1% | 2.7% | 3.1% | 3.6% | 4.0% | 4.5% | 4.9% | ||||||||
| 0.7% | 0.8% | 0.8% | 0.5% | 0.3% | 0.6% | 0.4% | 0.6% | 0.6% | 2.7% | 4.7% | 5.7% | 6.4% | 6.6% | 6.8% | 8.1% | 9.8% | ||||||||
| 0.6% | 0.5% | 0.5% | 0.3% | 0.2% | 0.2% | 0.2% | 0.2% | 0.2% | 0.2% | 0.2% | 0.2% | 0.1% | 0.1% | 0.2% | 0.1% | 0.1% | 0.3% | 0.3% | 0.4% | 0.6% | 0.7% | 1.1% | 1.5% | |
| 7.7% | 8.0% | 7.6% | 7.2% | 6.4% | 5.8% | 4.9% | 3.8% | 3.4% | 3.4% | 3.3% | 3.7% | 3.5% | 3.7% | 5.2% | 5.5% | 6.6% | 8.5% | 10.7% | 12.6% | 13.4% | 13.6% | 13.7% | 13.1% | |
| 0.0% | 0.1% | 0.2% | 0.8% | 1.2% | 0.8% | 0.5% | 1.6% | 0.7% | 0.9% | 1.2% | 1.8% | 1.9% | 1.8% | 2.0% | 1.9% | 2.1% | 2.2% | |||||||
| 7.6% | 5.3% | 4.2% | 2.9% | 2.3% | 2.1% | 1.6% | 1.3% | 1.2% | 1.3% | 1.2% | 1.4% | 1.5% | 1.9% | 3.3% | 4.2% | 6.2% | 8.4% | 11.9% | 13.7% | 15.9% | 15.9% | 15.9% | 14.8% | |
| 26.8% | 29.4% | 32.2% | 34.4% | 35.9% | 35.6% | 36.4% | 36.4% | 36.6% | 38.0% | 34.7% | 33.0% | 31.6% | 29.8% | 29.0% | 27.5% | 25.8% | 24.5% | 22.2% | 22.4% | 22.0% | 21.6% | 21.5% | 20.5% | |
| 1.0% | 0.3% | 0.2% | 0.1% | 0.1% | 0.1% | 0.1% | 0.0% | 0.0% | 0.1% | 0.4% | 0.4% | 0.6% | 0.6% | 1.2% | 3.4% | |||||||||
| 0.5% | 0.8% | 0.8% | 1.0% | 1.1% | 1.3% | 1.6% | 2.4% | 2.5% | 2.4% | 2.3% | 2.3% | 3.2% | 4.7% | 4.9% | 6.5% | 8.1% | 9.1% | 10.0% | 10.6% | 11.5% | 12.2% | 12.5% | ||
| 8.4% | 7.0% | 8.3% | 7.4% | 7.2% | 7.2% | 6.5% | 6.6% | 6.7% | 6.8% | 7.4% | 7.6% | 7.4% | 7.3% | |||||||||||
| 0.5% | 0.2% | 0.4% | 0.3% | 0.4% | 0.3% | 0.2% | 0.3% | 0.2% | 0.2% | 0.8% | 1.0% | 1.3% | 1.4% | 1.6% | 1.6% | 1.8% | 2.0% | |||||||
| 2.4% | 2.7% | 2.9% | 2.9% | 2.8% | 2.8% | 2.3% | 2.0% | 1.9% | 2.0% | 2.0% | 2.5% | 2.5% | 3.3% | 4.5% | 4.7% | 6.1% | 7.5% | 8.6% | 8.8% | 9.2% | 10.0% | 10.8% | 10.9% | |
| 6.3% | 5.3% | 4.8% | 4.3% | 3.7% | 3.0% | 2.5% | 2.3% | 2.3% | 2.3% | 2.1% | 2.1% | 1.8% | 1.7% | 1.4% | 1.5% | 1.8% | 2.1% | 2.7% | 2.9% | 3.9% | 4.5% | 5.7% | 5.7% | |
| 43.7% | 43.2% | 48.4% | 52.8% | 55.6% | 56.4% | 58.9% | 58.6% | 58.9% | 60.7% | 59.8% | 58.4% | 55.2% | 51.4% | 45.6% | 42.9% | 38.8% | 34.8% | 30.5% | 30.4% | 29.8% | 29.5% | 27.9% | 25.0% | |
| 0.0% | 0.6% | 0.3% | 0.2% | 0.1% | 0.1% | 0.1% | 0.1% | 0.1% | 0.1% | 0.2% | 0.2% | 0.3% | 0.5% | 0.6% | 1.3% | 2.0% | ||||||||
| 10.6% | 13.2% | 17.5% | 19.6% | 21.4% | 22.7% | 24.5% | 25.5% | 25.6% | 26.1% | 24.4% | 23.8% | 21.7% | 19.3% | 18.3% | 17.4% | 16.1% | 16.5% | 15.8% | 15.8% | 16.0% | 16.4% | 16.7% | 15.8% | |
| 27.5% | 30.3% | 31.0% | 24.7% | 21.8% | 20.4% | 17.7% | 15.9% | 14.7% | 14.4% | 12.7% | 12.4% | 12.5% | 12.0% | 11.9% | 11.5% | 11.8% | 12.2% | |||||||
| 0.4% | 0.1% | 0.1% | 0.2% | 0.3% | 0.2% | 0.3% | 0.3% | 0.2% | 0.2% | 0.4% | 0.5% | 0.6% | 0.6% | 0.7% | 0.8% | 1.1% | 1.2% | |||||||
| 0.3% | 0.4% | 0.3% | 0.4% | 0.3% | 0.3% | 0.2% | 0.2% | 0.3% | 0.3% | 0.3% | 0.2% | 0.5% | 0.2% | 0.2% | 0.1% | 0.1% | 0.1% | 0.2% | 0.2% | 0.3% | 0.5% | 1.0% | 1.4% | |
| 43.4% | 44.6% | 47.1% | 47.8% | 47.9% | 46.9% | 45.0% | 43.3% | 41.9% | 41.8% | 38.4% | 35.6% | 32.6% | 29.9% | 26.8% | 24.7% | 22.1% | 20.6% | 18.5% | 18.9% | 18.8% | 19.6% | 19.4% | 18.6% | |
| 12.7% | 0.3% | 0.9% | 0.4% | 0.4% | 0.5% | 0.5% | 0.5% | 0.4% | 0.4% | 1.3% | 1.7% | 2.1% | 2.6% | 3.1% | 3.2% | 3.6% | 4.0% | |||||||
| 9.5% | 9.8% | 11.5% | 12.1% | 11.2% | 9.6% | 7.8% | 5.6% | 4.1% | 4.2% | 4.3% | 4.5% | 5.3% | 5.9% | 6.6% | 6.2% | 5.7% | 4.8% | 3.9% | 3.3% | 3.1% | 3.2% | 3.4% | 3.7% | |
| 1.2% | 1.8% | 0.6% | 0.2% | 0.2% | 0.2% | 0.2% | 0.1% | 0.1% | 0.1% | 0.2% | 0.4% | 0.4% | 0.8% | 1.9% | 2.9% | 3.9% | 5.0% | 5.7% | 6.3% | 6.4% | ||||
| 2.0% | 1.4% | 1.5% | 1.0% | 1.5% | 0.7% | 0.6% | 0.4% | 0.9% | 0.7% | 0.8% | 0.7% | 0.8% | 0.8% | 0.8% | 0.9% | |||||||||
| 8.0% | 12.4% | 7.0% |
Free Blacks as a percentage out of the total Black population by U.S. region and U.S. state between 1790 and 1860
In 1865, all enslaved Blacks (African-Americans) in the United States were emancipated as a result of the Thirteenth Amendment. However, some U.S. states had previously emancipated some or all of their Black population. The table below shows the percentage of free Blacks as a percentage of the total Black population in various U.S. regions and U.S. states between 1790 and 1860 (the blank areas on the chart below mean that there is no data for those specific regions or states in those specific years).
| State/territory | 1790 | 1800 | 1810 | 1820 | 1830 | 1840 | 1850 | 1860 |
|---|---|---|---|---|---|---|---|---|
| 7.9% | 10.8% | 13.5% | 13.2% | 13.7% | 13.4% | 11.9% | 11.0% | |
| Northeast | 40.1% | 56.2% | 73.5% | 83.7% | 97.8% | 99.5% | 99.8% | 100.0% |
| Midwest | 78.7% | 52.4% | 38.0% | 37.7% | 34.4% | 35.5% | 37.6% | |
| South | 4.7% | 6.7% | 8.5% | 8.2% | 8.4% | 8.1% | 7.0% | 6.3% |
| West | 97.9% | 99.4% | ||||||
| 4.4% | 2.2% | 1.3% | 1.3% | 0.8% | 0.7% | 0.6% | ||
| 100.0% | ||||||||
| 1.4% | 3.5% | 3.0% | 2.3% | 1.3% | 0.1% | |||
| 100.0% | 100.0% | |||||||
| 100.0% | ||||||||
| 50.4% | 84.9% | 95.4% | 98.8% | 99.7% | 99.8% | 100.0% | 100.0% | |
| 30.5% | 57.3% | 75.9% | 74.2% | 82.8% | 86.7% | 88.8% | 91.7% | |
| 16.2% | 30.7% | 37.9% | 50.5% | 66.2% | 73.2% | 77.8% | ||
| 5.2% | 3.1% | 2.3% | 1.5% | |||||
| 1.3% | 1.7% | 1.7% | 1.2% | 1.1% | 1.0% | 0.8% | 0.8% | |
| 41.5% | 78.5% | 33.3% | 68.7% | 91.6% | 100.0% | 100.0% | ||
| 75.7% | 62.4% | 86.6% | 99.9% | 100.0% | 100.0% | 100.0% | ||
| 91.5% | 100.0% | 100.0% | ||||||
| 99.7% | ||||||||
| 0.9% | 1.8% | 2.1% | 2.1% | 2.9% | 3.9% | 4.5% | 4.5% | |
| 18.0% | 13.2% | 13.2% | 13.1% | 6.7% | 5.3% | |||
| 100.0% | 100.0% | 100.0% | 100.0% | 99.8% | 100.0% | 100.0% | 100.0% | |
| 7.2% | 15.6% | 23.3% | 27.0% | 33.9% | 40.9% | 45.3% | 49.1% | |
| 100.0% | 100.0% | 100.0% | 100.0% | 100.0% | 100.0% | 100.0% | 100.0% | |
| 100.0% | 83.3% | 100.0% | 99.6% | 100.0% | 100.0% | 100.0% | ||
| 100.0% | 100.0% | |||||||
| 5.0% | 1.2% | 1.4% | 0.8% | 0.7% | 0.3% | 0.2% | ||
| 17.4% | 3.3% | 2.2% | 2.6% | 2.9% | 3.0% | |||
| 81.7% | ||||||||
| 100.0% | ||||||||
| 79.9% | 100.0% | 100.0% | 100.0% | 99.5% | 99.8% | 100.0% | 100.0% | |
| 19.5% | 26.2% | 42.0% | 62.2% | 89.0% | 96.9% | 99.0% | 99.9% | |
| 100.0% | 100.0% | |||||||
| 17.9% | 33.3% | 62.8% | 74.4% | 99.8% | 100.0% | 100.0% | 100.0% | |
| 4.7% | 5.0% | 5.7% | 6.7% | 7.4% | 8.5% | 8.7% | 8.4% | |
| 100.0% | 100.0% | 100.0% | 99.9% | 100.0% | 100.0% | 100.0% | ||
| 100.0% | 100.0% | |||||||
| 63.6% | 89.5% | 96.6% | 99.3% | 98.9% | 99.9% | 100.0% | 100.0% | |
| 78.2% | 89.7% | 97.1% | 98.7% | 99.5% | 99.8% | 100.0% | 100.0% | |
| 1.7% | 2.1% | 2.3% | 2.6% | 2.4% | 2.5% | 2.3% | 2.4% | |
| N/A[a] | ||||||||
| 9.6% | 2.2% | 2.9% | 3.3% | 3.1% | 2.9% | 2.6% | 2.6% | |
| 0.7% | 0.2% | |||||||
| 48.0% | 50.8% | |||||||
| 100.0% | 100.0% | 100.0% | 100.0% | 100.0% | 100.0% | 100.0% | 100.0% | |
| 4.1% | 5.6% | 7.3% | 8.2% | 9.3% | 10.1% | 10.2% | 10.5% | |
| 100.0% | 100.0% | |||||||
| 11.6% | 6.8% | 10.5% | 8.5% | 10.9% | 14.1% | 13.1% | 13.1% | |
| 100.0% | 51.6% | 94.4% | 100.0% | 100.0% | ||||
a^ There were no Blacks at all—either free or enslaved—in South Dakota in 1860.[31]
Native American population as a percentage of the total population by U.S. region and state (1890–2020)
The census counted 248,000 Native Americans in 1890, 332,000 in 1930 and 334,000 in 1940, including those on and off reservations in the 48 states. Total spending on Native Americans averaged $38 million a year in the late 1920s, dropping to a low of $23 million in 1933, and returning to $38 million in 1940.[32]
| State/Territory | 1890 | 1900 | 1910 | 1920 | 1930 | 1940 | 1950 | 1960 | 1970 | 1980 | 1990 | 2000[34] | 2010[35] | 2020[30] |
|---|---|---|---|---|---|---|---|---|---|---|---|---|---|---|
| United States | 0.4% | 0.3% | 0.3% | 0.2% | 0.3% | 0.3% | 0.2% | 0.3% | 0.4% | 0.6% | 0.8% | 0.9% | 0.9% | 1.1% |
| Alabama | 0.1% | 0.0% | 0.0% | 0.0% | 0.0% | 0.0% | 0.0% | 0.0% | 0.1% | 0.2% | 0.4% | 0.5% | 0.6% | 0.7% |
| Alaska | 16.0% | 15.6% | 15.6% | 14.8% | 15.2% | |||||||||
| Arizona | 34.0% | 21.5% | 14.3% | 9.9% | 10.0% | 11.0% | 8.8% | 6.4% | 5.4% | 5.6% | 5.6% | 5.0% | 4.6% | 4.5% |
| Arkansas | 0.0% | 0.0% | 0.0% | 0.0% | 0.0% | 0.0% | 0.0% | 0.0% | 0.1% | 0.4% | 0.5% | 0.7% | 0.8% | 0.9% |
| California | 1.4% | 1.0% | 0.7% | 0.5% | 0.3% | 0.3% | 0.2% | 0.2% | 0.5% | 0.9% | 0.8% | 1.0% | 1.0% | 1.6% |
| Colorado | 0.3% | 0.3% | 0.2% | 0.1% | 0.1% | 0.1% | 0.1% | 0.2% | 0.4% | 0.6% | 0.8% | 1.0% | 1.1% | 1.3% |
| Connecticut | 0.0% | 0.0% | 0.0% | 0.0% | 0.0% | 0.0% | 0.0% | 0.0% | 0.1% | 0.1% | 0.2% | 0.3% | 0.3% | 0.4% |
| Delaware | 0.0% | 0.0% | 0.0% | 0.0% | 0.0% | 0.0% | 0.0% | 0.1% | 0.1% | 0.2% | 0.3% | 0.3% | 0.5% | 0.5% |
| District of Columbia | 0.0% | 0.0% | 0.0% | 0.0% | 0.0% | 0.0% | 0.0% | 0.1% | 0.1% | 0.2% | 0.2% | 0.3% | 0.3% | 0.5% |
| Florida | 0.0% | 0.1% | 0.0% | 0.1% | 0.0% | 0.0% | 0.0% | 0.1% | 0.1% | 0.2% | 0.3% | 0.3% | 0.4% | 0.4% |
| Georgia | 0.0% | 0.0% | 0.0% | 0.0% | 0.0% | 0.0% | 0.0% | 0.0% | 0.1% | 0.1% | 0.2% | 0.3% | 0.3% | 0.5% |
| Hawaii | 0.1% | 0.1% | 0.3% | 0.5% | 0.3% | 0.3% | 0.3% | |||||||
| Idaho | 4.8% | 2.6% | 1.1% | 0.7% | 0.8% | 0.7% | 0.6% | 0.8% | 0.9% | 1.1% | 1.4% | 1.4% | 1.4% | 1.4% |
| Illinois | 0.0% | 0.0% | 0.0% | 0.0% | 0.0% | 0.0% | 0.0% | 0.0% | 0.1% | 0.1% | 0.2% | 0.2% | 0.3% | 0.8% |
| Indiana | 0.0% | 0.0% | 0.0% | 0.0% | 0.0% | 0.0% | 0.0% | 0.0% | 0.1% | 0.1% | 0.2% | 0.3% | 0.3% | 0.4% |
| Iowa | 0.0% | 0.0% | 0.0% | 0.0% | 0.0% | 0.0% | 0.0% | 0.1% | 0.1% | 0.2% | 0.3% | 0.3% | 0.4% | 0.5% |
| Kansas | 0.1% | 0.1% | 0.1% | 0.1% | 0.1% | 0.1% | 0.1% | 0.2% | 0.4% | 0.7% | 0.9% | 0.9% | 1.0% | 1.1% |
| Kentucky | 0.0% | 0.0% | 0.0% | 0.0% | 0.0% | 0.0% | 0.0% | 0.0% | 0.0% | 0.1% | 0.2% | 0.2% | 0.2% | 0.3% |
| Louisiana | 0.1% | 0.0% | 0.0% | 0.1% | 0.1% | 0.1% | 0.0% | 0.1% | 0.1% | 0.3% | 0.4% | 0.6% | 0.7% | 0.7% |
| Maine | 0.1% | 0.1% | 0.1% | 0.1% | 0.1% | 0.1% | 0.2% | 0.2% | 0.2% | 0.4% | 0.5% | 0.6% | 0.6% | 0.6% |
| Maryland | 0.0% | 0.0% | 0.0% | 0.0% | 0.0% | 0.0% | 0.0% | 0.0% | 0.1% | 0.2% | 0.3% | 0.3% | 0.4% | 0.5% |
| Massachusetts | 0.0% | 0.0% | 0.0% | 0.0% | 0.0% | 0.0% | 0.0% | 0.0% | 0.1% | 0.1% | 0.2% | 0.2% | 0.3% | 0.3% |
| Michigan | 0.3% | 0.3% | 0.3% | 0.2% | 0.1% | 0.1% | 0.1% | 0.1% | 0.2% | 0.4% | 0.6% | 0.6% | 0.6% | 0.6% |
| Minnesota | 0.8% | 0.5% | 0.4% | 0.4% | 0.4% | 0.4% | 0.4% | 0.5% | 0.6% | 0.9% | 1.1% | 1.1% | 1.1% | 1.2% |
| Mississippi | 0.2% | 0.1% | 0.1% | 0.1% | 0.1% | 0.1% | 0.1% | 0.1% | 0.2% | 0.2% | 0.3% | 0.4% | 0.5% | 0.6% |
| Missouri | 0.0% | 0.0% | 0.0% | 0.0% | 0.0% | 0.0% | 0.0% | 0.0% | 0.1% | 0.3% | 0.4% | 0.4% | 0.5% | 0.5% |
| Montana | 7.8% | 4.7% | 0.8% | 2.0% | 2.8% | 3.0% | 2.8% | 3.1% | 3.9% | 4.7% | 6.0% | 6.2% | 6.3% | 6.2% |
| Nebraska | 0.6% | 0.3% | 0.3% | 0.2% | 0.2% | 0.3% | 0.3% | 0.4% | 0.4% | 0.6% | 0.8% | 0.9% | 1.2% | 1.2% |
| Nevada | 10.9% | 12.3% | 6.4% | 6.3% | 5.3% | 4.3% | 3.1% | 2.3% | 1.6% | 1.7% | 1.6% | 1.3% | 1.2% | 1.4% |
| New Hampshire | 0.0% | 0.0% | 0.0% | 0.0% | 0.0% | 0.0% | 0.0% | 0.0% | 0.0% | 0.1% | 0.2% | 0.2% | 0.2% | 0.2% |
| New Jersey | 0.0% | 0.0% | 0.0% | 0.0% | 0.0% | 0.0% | 0.0% | 0.0% | 0.1% | 0.1% | 0.2% | 0.2% | 0.3% | 0.6% |
| New Mexico | 9.4% | 6.7% | 6.3% | 5.4% | 6.8% | 6.5% | 6.2% | 5.9% | 7.2% | 8.1% | 8.9% | 9.5% | 9.4% | 10.0% |
| New York | 0.1% | 0.1% | 0.1% | 0.1% | 0.1% | 0.1% | 0.1% | 0.1% | 0.2% | 0.2% | 0.3% | 0.4% | 0.6% | 0.7% |
| North Carolina | 0.1% | 0.3% | 0.4% | 0.5% | 0.5% | 0.6% | 0.1% | 0.8% | 0.9% | 1.1% | 1.2% | 1.2% | 1.3% | 1.2% |
| North Dakota | 4.3% | 2.2% | 1.1% | 1.0% | 1.2% | 1.6% | 1.7% | 1.9% | 2.3% | 3.1% | 4.1% | 4.9% | 5.4% | 5.0% |
| Ohio | 0.0% | 0.0% | 0.0% | 0.0% | 0.0% | 0.0% | 0.0% | 0.0% | 0.1% | 0.1% | 0.2% | 0.2% | 0.2% | 0.3% |
| Oklahoma | 24.9% | 8.2% | 4.5% | 2.8% | 3.9% | 2.7% | 2.4% | 2.8% | 3.8% | 5.6% | 8.0% | 7.9% | 8.6% | 8.4% |
| Oregon | 1.6% | 1.2% | 0.8% | 0.6% | 0.5% | 0.4% | 0.4% | 0.5% | 0.6% | 1.0% | 1.4% | 1.3% | 1.4% | 1.5% |
| Pennsylvania | 0.0% | 0.0% | 0.0% | 0.0% | 0.0% | 0.0% | 0.0% | 0.0% | 0.0% | 0.1% | 0.1% | 0.1% | 0.2% | 0.2% |
| Rhode Island | 0.1% | 0.0% | 0.1% | 0.0% | 0.0% | 0.0% | 0.0% | 0.1% | 0.1% | 0.3% | 0.4% | 0.5% | 0.6% | 0.7% |
| South Carolina | 0.0% | 0.0% | 0.0% | 0.0% | 0.1% | 0.1% | 0.1% | 0.2% | 0.2% | 0.3% | 0.4% | 0.5% | ||
| South Dakota | 5.7% | 5.0% | 3.3% | 2.6% | 3.2% | 3.6% | 3.6% | 3.8% | 4.9% | 6.5% | 7.3% | 8.3% | 8.8% | 8.8% |
| Tennessee | 0.0% | 0.0% | 0.0% | 0.0% | 0.0% | 0.0% | 0.0% | 0.0% | 0.1% | 0.1% | 0.2% | 0.3% | 0.3% | 0.4% |
| Texas | 0.0% | 0.0% | 0.0% | 0.0% | 0.0% | 0.0% | 0.0% | 0.1% | 0.2% | 0.3% | 0.4% | 0.6% | 0.7% | 1.0% |
| Utah | 1.6% | 0.9% | 0.8% | 0.6% | 0.6% | 0.7% | 0.6% | 0.8% | 1.1% | 1.3% | 1.4% | 1.3% | 1.2% | 1.3% |
| Vermont | 0.0% | 0.0% | 0.0% | 0.0% | 0.0% | 0.0% | 0.0% | 0.0% | 0.1% | 0.2% | 0.3% | 0.4% | 0.4% | 0.4% |
| Virginia | 0.0% | 0.0% | 0.0% | 0.0% | 0.0% | 0.0% | 0.0% | 0.1% | 0.1% | 0.2% | 0.2% | 0.3% | 0.4% | 0.5% |
| Washington | 3.1% | 1.9% | 1.0% | 0.7% | 0.7% | 0.7% | 0.6% | 0.7% | 1.0% | 1.5% | 1.7% | 1.6% | 1.5% | 1.6% |
| West Virginia | 0.0% | 0.0% | 0.0% | 0.0% | 0.0% | 0.0% | 0.0% | 0.0% | 0.0% | 0.1% | 0.1% | 0.2% | 0.2% | 0.2% |
| Wisconsin | 0.6% | 0.4% | 0.4% | 0.4% | 0.4% | 0.4% | 0.4% | 0.4% | 0.4% | 0.6% | 0.8% | 0.9% | 1.0% | 1.0% |
| Wyoming | 2.9% | 1.8% | 1.0% | 0.7% | 0.8% | 0.9% | 1.1% | 1.2% | 1.5% | 1.5% | 2.1% | 2.3% | 2.4% | 2.4% |
| Puerto Rico | 0.4% | 0.5% | 0.5% |
Mexican (1910–1930) and Hispanic/Latino (1940–2020) population as a percentage of the total population by U.S. region and state
Historically, the U.S. states with the largest Mexican/Hispanic/Latino populations were primarily located in the Southwestern states, Texas, and Florida. However, the percentage of the Hispanic/Latino population has dramatically increased in many U.S. states both inside and outside the Southwest in recent decades.
| State/territory | 1910 | 1920 | 1930 | 1940 | 1950 | 1960 | 1970 | 1980 | 1990 | 2000 | 2010 | 2020 |
|---|---|---|---|---|---|---|---|---|---|---|---|---|
| 0.4% | 0.7% | 1.2% | 1.4% | 4.7% | 6.4% | 9.0% | 12.5% | 16.3% | 18.7% | |||
| Northeast | 0.0% | 0.0% | 0.0% | 0.4% | 4.1% | 5.3% | 7.4% | 9.8% | 12.6% | 15.2% | ||
| Midwest | 0.0% | 0.1% | 0.3% | 0.2% | 1.5% | 2.2% | 2.9% | 4.9% | 7.0% | 8.6% | ||
| South | 1.1% | 1.7% | 2.5% | 1.9% | 4.4% | 5.9% | 7.9% | 11.6% | 15.9% | 18.7% | ||
| West | 1.9% | 3.1% | 5.4% | 6.1% | 11.3% | 14.5% | 19.1% | 24.3% | 28.6% | 30.0% | ||
| 0.0% | 0.0% | 0.0% | 0.0% | 0.4% | 0.9% | 0.6% | 1.7% | 3.9% | 5.3% | |||
| 2.1% | 2.4% | 3.2% | 4.1% | 5.5% | 6.8% | |||||||
| 28.6% | 30.4% | 30.2% | 20.4% | 17.2% | 14.9% | 17.3% | 16.2% | 18.8% | 25.3% | 29.6% | 30.7% | |
| 0.0% | 0.0% | 0.0% | 0.0% | 0.5% | 0.8% | 0.8% | 3.2% | 6.4% | 8.5% | |||
| 2.1% | 3.7% | 6.8% | 6.0% | 7.2% | 9.1% | 13.7% | 19.2% | 25.8% | 32.4% | 37.6% | 39.4% | |
| 0.4% | 1.6% | 5.7% | 8.2% | 9.0% | 9.0% | 11.6% | 11.8% | 12.9% | 17.1% | 20.7% | 21.9% | |
| 0.0% | 0.0% | 0.0% | 0.1% | 2.4% | 4.0% | 6.5% | 9.4% | 13.4% | 17.3% | |||
| 0.0% | 0.0% | 0.0% | 0.1% | 1.1% | 1.6% | 2.4% | 4.8% | 8.2% | 10.5% | |||
| 0.0% | 0.0% | 0.0% | 0.1% | 2.1% | 2.8% | 5.4% | 7.9% | 9.1% | 11.3% | |||
| 0.0% | 0.0% | 0.0% | 1.3% | 6.6% | 8.8% | 12.2% | 16.8% | 22.5% | 26.5% | |||
| 0.0% | 0.0% | 0.0% | 0.0% | 0.6% | 1.1% | 1.7% | 5.3% | 8.8% | 10.5% | |||
| 3.0% | 7.4% | 7.3% | 7.2% | 8.9% | 9.5% | |||||||
| 0.0% | 0.3% | 0.3% | 0.5% | 2.6% | 3.9% | 5.3% | 7.9% | 11.2% | 13.0% | |||
| 0.0% | 0.1% | 0.4% | 0.3% | 3.3% | 5.6% | 7.9% | 12.3% | 15.8% | 18.2% | |||
| 0.0% | 0.0% | 0.3% | 0.2% | 1.3% | 1.6% | 1.8% | 3.5% | 6.0% | 8.2% | |||
| 0.0% | 0.1% | 0.2% | 0.1% | 0.6% | 0.9% | 1.2% | 2.8% | 5.0% | 6.8% | |||
| 0.5% | 0.9% | 1.1% | 0.7% | 2.1% | 2.7% | 3.8% | 7.0% | 10.5% | 13.0% | |||
| 0.0% | 0.0% | 0.0% | 0.0% | 0.3% | 0.7% | 0.6% | 1.5% | 3.1% | 4.6% | |||
| 0.1% | 0.2% | 0.3% | 0.2% | 1.9% | 2.4% | 2.2% | 2.4% | 4.2% | 6.9% | |||
| 0.0% | 0.0% | 0.0% | 0.0% | 0.4% | 0.4% | 0.6% | 0.7% | 1.3% | 2.0% | |||
| 0.0% | 0.0% | 0.0% | 0.0% | 1.4% | 1.5% | 2.6% | 4.3% | 8.2% | 11.8% | |||
| 0.0% | 0.0% | 0.0% | 0.1% | 1.1% | 2.5% | 4.8% | 6.8% | 9.6% | 12.6% | |||
| 0.0% | 0.0% | 0.3% | 0.2% | 1.4% | 1.8% | 2.2% | 3.3% | 4.4% | 5.6% | |||
| 0.0% | 0.0% | 0.1% | 0.1% | 0.6% | 0.8% | 1.2% | 2.9% | 4.7% | 6.1% | |||
| 0.0% | 0.0% | 0.1% | 0.0% | 0.4% | 1.0% | 0.6% | 1.4% | 2.7% | 3.6% | |||
| 0.0% | 0.1% | 0.1% | 0.1% | 0.9% | 1.1% | 1.2% | 2.1% | 3.5% | 4.9% | |||
| 0.0% | 0.1% | 0.5% | 0.4% | 1.1% | 1.3% | 1.5% | 2.0% | 2.9% | 4.2% | |||
| 0.0% | 0.2% | 0.5% | 0.4% | 1.4% | 1.8% | 2.3% | 5.5% | 9.2% | 12.0% | |||
| 1.1% | 1.8% | 3.7% | 2.8% | 5.6% | 6.7% | 10.4% | 19.7% | 26.5% | 28.7% | |||
| 0.0% | 0.0% | 0.0% | 0.0% | 0.4% | 0.6% | 1.0% | 1.7% | 2.8% | 4.3% | |||
| 0.0% | 0.0% | 0.0% | 0.2% | 4.3% | 6.7% | 9.6% | 13.3% | 17.7% | 21.6% | |||
| 6.9% | 9.8% | 15.2% | 41.7% | 36.5% | 28.3% | 37.4% | 36.6% | 38.2% | 42.1% | 46.3% | 47.7% | |
| 0.0% | 0.0% | 0.0% | 1.0% | 8.0% | 9.5% | 12.3% | 15.1% | 17.6% | 19.5% | |||
| 0.0% | 0.0% | 0.0% | 0.0% | 0.4% | 1.0% | 1.2% | 4.7% | 8.4% | 10.7% | |||
| 0.0% | 0.0% | 0.1% | 0.0% | 0.3% | 0.6% | 0.7% | 1.2% | 2.0% | 4.3% | |||
| 0.0% | 0.0% | 0.1% | 0.1% | 0.9% | 1.1% | 1.3% | 1.9% | 3.1% | 4.4% | |||
| 0.3% | 0.4% | 0.2% | 0.2% | 1.4% | 1.9% | 2.7% | 5.2% | 8.9% | 11.9% | |||
| 0.0% | 0.1% | 0.2% | 0.1% | 1.7% | 2.5% | 4.0% | 8.0% | 11.7% | 13.9% | |||
| 0.0% | 0.0% | 0.0% | 0.1% | 0.9% | 1.3% | 2.0% | 3.2% | 5.7% | 8.1% | |||
| 0.0% | 0.0% | 0.0% | 0.1% | 0.7% | 2.1% | 4.6% | 8.7% | 12.4% | 16.6% | |||
| 0.0% | 0.0% | 0.0% | 0.0% | 0.4% | 1.1% | 0.9% | 2.4% | 5.1% | 6.9% | |||
| 0.0% | 0.0% | 0.1% | 0.0% | 0.4% | 0.6% | 0.8% | 1.4% | 2.7% | 4.4% | |||
| 0.0% | 0.0% | 0.0% | 0.0% | 0.4% | 0.7% | 0.7% | 2.2% | 4.6% | 6.9% | |||
| 7.1% | 9.9% | 13.8% | 11.5% | 13.3% | 14.8% | 17.7% | 21.0% | 25.5% | 32.0% | 37.6% | 39.3% | |
| 0.0% | 0.3% | 0.8% | 0.5% | 4.1% | 4.1% | 4.9% | 9.0% | 13.0% | 15.1% | |||
| 0.0% | 0.0% | 0.0% | 0.2% | 0.6% | 0.6% | 0.7% | 0.9% | 1.5% | 2.4% | |||
| 0.0% | 0.0% | 0.0% | 0.0% | 1.0% | 1.5% | 2.6% | 4.7% | 7.9% | 10.5% | |||
| 0.0% | 0.0% | 0.0% | 0.1% | 2.1% | 2.9% | 4.4% | 7.5% | 11.2% | 13.7% | |||
| 0.0% | 0.0% | 0.0% | 0.1% | 0.4% | 0.7% | 0.5% | 0.7% | 1.2% | 1.9% | |||
| 0.0% | 0.0% | 0.1% | 0.1% | 0.9% | 1.3% | 1.9% | 3.6% | 5.9% | 7.6% | |||
| 0.2% | 1.1% | 3.2% | 2.4% | 5.6% | 5.2% | 5.7% | 6.4% | 8.9% | 10.2% | |||
| 98.8% | 99.0% | 98.9% |
a^ There are other estimates on this page which are a little different. These estimates here come from the U.S. Census Bureau.
Asian and Pacific Islander population by U.S. region and state (1860–2020)
| State/Territory | 1860 | 1870 | 1880 | 1890 | 1900 | 1910 | 1920 | 1930 | 1940 | 1950 | 1960 | 1970 | 1980 | 1990 | 2000 | 2010 | 2020 |
|---|---|---|---|---|---|---|---|---|---|---|---|---|---|---|---|---|---|
| 0.1% | 0.2% | 0.2% | 0.2% | 0.2% | 0.2% | 0.2% | 0.2% | 0.2% | 0.2% | 0.5% | 0.8% | 1.5% | 2.9% | 3.7% | 4.8% | 6.2% | |
| 0.0% | 0.0% | 0.0% | 0.0% | 0.0% | 0.0% | 0.0% | 0.0% | 0.0% | 0.0% | 0.0% | 0.1% | 0.2% | 0.5% | 0.7% | 1.1% | 1.6% | |
| 7.1% | 5.3% | 3.8% | 0.8% | 0.8% | 1.0% | 0.8% | 0.9% | 2.0% | 3.6% | 4.5% | 5.4% | 7.7% | |||||
| 0.0% | 0.2% | 4.0% | 1.3% | 1.4% | 0.8% | 0.5% | 0.6% | 0.5% | 0.4% | 0.4% | 0.5% | 0.8% | 1.5% | 1.9% | 2.8% | 3.8% | |
| 0.0% | 0.0% | 0.0% | 0.0% | 0.0% | 0.0% | 0.0% | 0.0% | 0.0% | 0.0% | 0.1% | 0.1% | 0.3% | 0.5% | 0.9% | 1.2% | 2.2% | |
| 9.2% | 8.8% | 8.7% | 6.1% | 3.8% | 3.4% | 3.1% | 3.0% | 2.4% | 1.7% | 2.0% | 2.8% | 5.3% | 9.6% | 11.2% | 13.0% | 15.8% | |
| 0.0% | 0.0% | 0.3% | 0.3% | 0.1% | 0.3% | 0.3% | 0.4% | 0.3% | 0.5% | 0.5% | 0.5% | 1.0% | 1.8% | 2.3% | 2.8% | 3.7% | |
| 0.0% | 0.0% | 0.0% | 0.0% | 0.1% | 0.0% | 0.1% | 0.0% | 0.0% | 0.1% | 0.1% | 0.2% | 0.6% | 1.5% | 2.4% | 3.8% | 4.8% | |
| 0.0% | 0.0% | 0.0% | 0.0% | 0.0% | 0.0% | 0.0% | 0.0% | 0.0% | 0.0% | 0.1% | 0.3% | 0.7% | 1.4% | 2.1% | 3.2% | 4.3% | |
| 0.0% | 0.0% | 0.0% | 0.0% | 0.2% | 0.1% | 0.2% | 0.2% | 0.2% | 0.4% | 0.6% | 0.7% | 1.0% | 1.8% | 2.8% | 3.5% | 5.0% | |
| 0.0% | 0.0% | 0.0% | 0.0% | 0.0% | 0.0% | 0.0% | 0.0% | 0.0% | 0.0% | 0.1% | 0.2% | 0.6% | 1.2% | 1.8% | 2.4% | 3.1% | |
| 0.0% | 0.0% | 0.0% | 0.0% | 0.0% | 0.0% | 0.0% | 0.0% | 0.0% | 0.0% | 0.1% | 0.1% | 0.4% | 1.2% | 2.2% | 3.2% | 4.6% | |
| 80.9% | 76.5% | 78.4% | 78.0% | 73.3% | 72.9% | 65.3% | 57.7% | 60.5% | 61.8% | 51.0% | 48.6% | 48.0% | |||||
| 28.5% | 10.4% | 2.4% | 1.7% | 0.7% | 0.5% | 0.4% | 0.3% | 0.4% | 0.4% | 0.5% | 0.6% | 0.9% | 1.0% | 1.2% | 1.7% | ||
| 0.0% | 0.0% | 0.0% | 0.0% | 0.0% | 0.0% | 0.1% | 0.1% | 0.1% | 0.2% | 0.2% | 0.4% | 1.4% | 2.5% | 3.4% | 4.6% | 5.9% | |
| 0.0% | 0.0% | 0.0% | 0.0% | 0.0% | 0.0% | 0.0% | 0.0% | 0.0% | 0.0% | 0.1% | 0.1% | 0.4% | 0.7% | 1.0% | 1.6% | 2.5% | |
| 0.0% | 0.0% | 0.0% | 0.0% | 0.0% | 0.0% | 0.0% | 0.0% | 0.0% | 0.0% | 0.0% | 0.1% | 0.4% | 0.9% | 1.3% | 1.7% | 2.6% | |
| 0.0% | 0.0% | 0.0% | 0.0% | 0.0% | 0.0% | 0.0% | 0.0% | 0.0% | 0.0% | 0.1% | 0.2% | 0.6% | 1.3% | 1.7% | 2.4% | 3.0% | |
| 0.0% | 0.0% | 0.0% | 0.0% | 0.0% | 0.0% | 0.0% | 0.0% | 0.0% | 0.0% | 0.0% | 0.1% | 0.3% | 0.5% | 0.7% | 1.1% | 1.8% | |
| 0.0% | 0.0% | 0.1% | 0.0% | 0.0% | 0.0% | 0.0% | 0.0% | 0.0% | 0.0% | 0.1% | 0.1% | 0.6% | 1.0% | 1.2% | 1.5% | 1.9% | |
| 0.0% | 0.0% | 0.0% | 0.0% | 0.0% | 0.0% | 0.0% | 0.0% | 0.0% | 0.0% | 0.1% | 0.1% | 0.3% | 0.5% | 0.7% | 1.0% | 1.2% | |
| 0.0% | 0.0% | 0.0% | 0.0% | 0.0% | 0.0% | 0.0% | 0.1% | 0.0% | 0.1% | 0.2% | 0.5% | 1.5% | 2.9% | 4.0% | 5.5% | 6.9% | |
| 0.0% | 0.0% | 0.0% | 0.0% | 0.1% | 0.1% | 0.1% | 0.1% | 0.1% | 0.1% | 0.2% | 0.4% | 0.9% | 2.4% | 3.8% | 5.3% | 7.2% | |
| 0.0% | 0.0% | 0.0% | 0.0% | 0.0% | 0.0% | 0.0% | 0.0% | 0.0% | 0.1% | 0.1% | 0.2% | 0.6% | 1.1% | 1.8% | 2.4% | 3.3% | |
| 0.0% | 0.0% | 0.0% | 0.0% | 0.0% | 0.0% | 0.0% | 0.0% | 0.0% | 0.1% | 0.1% | 0.2% | 0.7% | 1.8% | 2.9% | 4.0% | 5.3% | |
| 0.0% | 0.0% | 0.0% | 0.0% | 0.0% | 0.0% | 0.0% | 0.0% | 0.0% | 0.1% | 0.1% | 0.1% | 0.3% | 0.5% | 0.7% | 0.9% | 1.1% | |
| 0.0% | 0.0% | 0.0% | 0.0% | 0.0% | 0.0% | 0.0% | 0.0% | 0.0% | 0.0% | 0.1% | 0.2% | 0.5% | 0.8% | 1.2% | 1.6% | 2.4% | |
| 9.5% | 4.5% | 1.8% | 1.7% | 0.6% | 0.4% | 0.3% | 0.2% | 0.2% | 0.2% | 0.2% | 0.3% | 0.5% | 0.6% | 0.6% | 0.9% | ||
| 0.0% | 0.0% | 0.0% | 0.0% | 0.0% | 0.1% | 0.1% | 0.1% | 0.0% | 0.1% | 0.1% | 0.2% | 0.4% | 0.8% | 1.3% | 1.8% | 2.8% | |
| 0.0% | 7.3% | 8.7% | 6.0% | 3.7% | 2.3% | 1.9% | 1.3% | 0.7% | 0.5% | 0.5% | 0.7% | 1.8% | 3.2% | 4.9% | 7.2% | 9.6% | |
| 0.0% | 0.0% | 0.0% | 0.0% | 0.0% | 0.0% | 0.0% | 0.0% | 0.0% | 0.0% | 0.1% | 0.2% | 0.3% | 0.8% | 1.3% | 2.2% | 2.6% | |
| 0.0% | 0.0% | 0.0% | 0.0% | 0.1% | 0.1% | 0.1% | 0.1% | 0.0% | 0.1% | 0.1% | 0.3% | 1.4% | 3.5% | 5.7% | 8.3% | 10.2% | |
| 0.0% | 0.0% | 0.0% | 0.2% | 0.2% | 0.2% | 0.1% | 0.1% | 0.1% | 0.1% | 0.2% | 0.2% | 0.5% | 0.9% | 1.2% | 1.4% | 1.9% | |
| 0.0% | 0.0% | 0.0% | 0.1% | 0.1% | 0.1% | 0.1% | 0.1% | 0.1% | 0.2% | 0.3% | 0.7% | 1.8% | 3.9% | 5.5% | 7.3% | 9.7% | |
| 0.0% | 0.0% | 0.0% | 0.0% | 0.0% | 0.0% | 0.0% | 0.0% | 0.0% | 0.0% | 0.0% | 0.1% | 0.4% | 0.8% | 1.4% | 2.2% | 3.4% | |
| 0.0% | 0.0% | 0.0% | 0.1% | 0.0% | 0.0% | 0.0% | 0.0% | 0.0% | 0.0% | 0.1% | 0.3% | 0.5% | 0.6% | 1.0% | 1.8% | ||
| 0.0% | 0.0% | 0.0% | 0.0% | 0.0% | 0.0% | 0.0% | 0.0% | 0.0% | 0.0% | 0.1% | 0.2% | 0.4% | 0.8% | 1.2% | 1.7% | 2.5% | |
| 0.0% | 0.0% | 0.0% | 0.0% | 0.0% | 0.0% | 0.0% | 0.1% | 0.1% | 0.6% | 1.1% | 1.5% | 1.7% | 2.5% | ||||
| 0.0% | 3.7% | 5.4% | 3.0% | 3.1% | 1.6% | 1.0% | 0.9% | 0.6% | 0.4% | 0.5% | 0.7% | 1.3% | 2.4% | 3.2% | 3.7% | 5.1% | |
| 0.0% | 0.0% | 0.0% | 0.0% | 0.0% | 0.0% | 0.0% | 0.0% | 0.0% | 0.0% | 0.1% | 0.2% | 0.5% | 1.2% | 1.8% | 2.7% | 3.9% | |
| 0.0% | 0.0% | 0.0% | 0.0% | 0.1% | 0.1% | 0.0% | 0.0% | 0.0% | 0.1% | 0.1% | 0.4% | 0.6% | 1.8% | 2.4% | 2.9% | 3.6% | |
| 0.0% | 0.0% | 0.0% | 0.0% | 0.0% | 0.0% | 0.0% | 0.0% | 0.0% | 0.0% | 0.0% | 0.1% | 0.4% | 0.6% | 0.9% | 1.3% | 1.9% | |
| 0.0% | 0.0% | 0.2% | 0.1% | 0.0% | 0.0% | 0.0% | 0.0% | 0.0% | 0.0% | 0.0% | 0.1% | 0.3% | 0.4% | 0.6% | 0.9% | 1.9% | |
| 0.0% | 0.0% | 0.0% | 0.0% | 0.0% | 0.0% | 0.0% | 0.0% | 0.0% | 0.0% | 0.0% | 0.1% | 0.3% | 0.7% | 1.0% | 1.4% | 2.1% | |
| 0.0% | 0.0% | 0.0% | 0.0% | 0.0% | 0.0% | 0.0% | 0.0% | 0.0% | 0.1% | 0.1% | 0.2% | 0.8% | 1.9% | 2.8% | 3.8% | 5.5% | |
| 0.0% | 0.5% | 0.3% | 0.4% | 0.4% | 0.7% | 0.7% | 0.8% | 0.5% | 0.7% | 0.6% | 0.6% | 1.0% | 1.9% | 2.4% | 2.0% | 3.6% | |
| 0.0% | 0.0% | 0.0% | 0.0% | 0.0% | 0.0% | 0.0% | 0.0% | 0.0% | 0.0% | 0.0% | 0.1% | 0.3% | 0.6% | 0.9% | 1.3% | 1.8% | |
| 0.0% | 0.0% | 0.0% | 0.0% | 0.0% | 0.0% | 0.0% | 0.0% | 0.0% | 0.0% | 0.1% | 0.3% | 1.2% | 2.6% | 3.8% | 5.5% | 7.2% | |
| 0.0% | 1.0% | 4.2% | 1.0% | 1.8% | 1.4% | 1.5% | 1.5% | 1.1% | 0.7% | 1.0% | 1.3% | 2.5% | 4.3% | 5.9% | 7.2% | 10.3% | |
| 0.0% | 0.0% | 0.0% | 0.0% | 0.0% | 0.0% | 0.0% | 0.0% | 0.0% | 0.0% | 0.0% | 0.1% | 0.3% | 0.4% | 0.5% | 0.7% | 0.8% | |
| 0.0% | 0.0% | 0.0% | 0.0% | 0.0% | 0.0% | 0.0% | 0.0% | 0.0% | 0.0% | 0.1% | 0.2% | 0.4% | 1.1% | 1.7% | 2.3% | 3.0% | |
| 1.6% | 4.4% | 0.7% | 0.9% | 1.3% | 0.8% | 0.5% | 0.3% | 0.2% | 0.2% | 0.3% | 0.4% | 0.6% | 0.7% | 0.8% | 1.0% | ||
| 0.2% | 0.2% | 0.1% |
Projections from 2020 through to 2060
The U.S. Census Bureau has projected that the U.S. White non-Hispanic population will become a minority (that is, less than half of the total U.S. population) during the 2040s, resulting in a plurality.[45] In December 2012, the U.S. Census Bureau projected that 2043 would be the year in which the U.S. would become a majority minority nation, with no single ethnic classification constituting a majority of the population.[46] By 2060, Hispanic Americans are projected to account for about one-third of the total U.S. population.[46] The tables present Census Bureau "middle series" projections published in May 2013.
| Race/ethnic group | 2020 | 2030 | 2040 | 2050 | 2060 |
|---|---|---|---|---|---|
| Total population | 333,896,000 | 358,471,000 | 380,016,000 | 399,803,000 | 420,268,000 |
| White | 255,346,000 | 267,604,000 | 276,438,000 | 282,959,000 | 289,587,000 |
| Black | 44,810,000 | 49,246,000 | 53,412,000 | 57,553,000 | 61,822,000 |
| American Indian, Eskimo, and Aleut | 4,328,000 | 4,889,000 | 5,407,000 | 5,881,000 | 6,308,000 |
| Asian and Pacific Islander | 19,708,000 | 23,802,000 | 27,945,000 | 31,967,000 | 35,815,000 |
| Two or more races | 9,704,000 | 12,929,000 | 16,814,000 | 21,443,000 | 26,737,000 |
| Hispanic (of any race) | 63,784,000 | 78,655,000 | 94,876,000 | 111,732,000 | 128,780,000 |
| Non-Hispanic White | 199,313,000 | 198,817,000 | 193,887,000 | 186,334,000 | 178,951,000 |
| Race/Ethnic Group | 2020 | 2030 | 2040 | 2050 | 2060 |
|---|---|---|---|---|---|
| White | 76.5% | 74.7% | 72.7% | 70.8% | 68.9% |
| Black | 13.4% | 13.7% | 14.1% | 14.4% | 14.7% |
| American Indian, Eskimo, and Aleut | 1.3% | 1.4% | 1.4% | 1.5% | 1.5% |
| Asian and Pacific Islander | 5.9% | 6.6% | 7.4% | 8.0% | 8.5% |
| Two or more races | 2.9% | 3.6% | 4.4% | 5.4% | 6.4% |
| Hispanic (of any race) | 19.1% | 21.9% | 25.0% | 27.9% | 30.6% |
| Non-Hispanic White | 59.7% | 55.5% | 51.0% | 46.6% | 42.6% |
Vital statistics of racial and ethnic groups (since 1935)
| Average population (x 1,000)[51] | Live births | Deaths | Natural change | Crude birth rate (per 1,000) | Crude death rate (per 1,000)[52] | Natural change (per 1,000) | Total fertility rate | |
|---|---|---|---|---|---|---|---|---|
| 1935 | 127,362 | 2,377,000 | 1,392,752 | 984,248 | 18.7 | 10.9 | 7.7 | 2.19 |
| 1936 | 128,181 | 2,355,000 | 1,479,228 | 875,772 | 18.4 | 11.5 | 6.8 | 2.15 |
| 1937 | 128,961 | 2,413,000 | 1,450,427 | 962,573 | 18.7 | 11.2 | 7.5 | 2.17 |
| 1938 | 129,969 | 2,496,000 | 1,381,391 | 1,114,609 | 19.2 | 10.6 | 8.6 | 2.22 |
| 1939 | 131,028 | 2,466,000 | 1,387,897 | 1,078,103 | 18.8 | 10.6 | 8.2 | 2.17 |
| 1940 | 132,165 | 2,559,000 | 1,417,269 | 1,142,000 | 19.4 | 10.8 | 8.6 | 2.23 |
| 1941 | 133,002 | 2,703,000 | 1,397,642 | 1,305,358 | 20.3 | 10.5 | 9.8 | 2.33 |
| 1942 | 134,464 | 2,989,000 | 1,385,187 | 1,603,813 | 22.2 | 10.3 | 11.9 | 2.55 |
| 1943 | 136,003 | 3,104,000 | 1,459,544 | 1,644,306 | 22.8 | 10.7 | 12.1 | 2.64 |
| 1944 | 138,083 | 2,939,000 | 1,411,338 | 1,644,456 | 21.2 | 10.2 | 11.0 | 2.49 |
| 1945 | 139,994 | 2,858,000 | 1,401,719 | 1,456,281 | 20.4 | 10.0 | 10.4 | 2.42 |
| 1946 | 140,008 | 3,411,000 | 1,395,617 | 2,015,383 | 24.1 | 10.0 | 14.1 | 2.86 |
| 1947 | 145,023 | 3,817,000 | 1,445,370 | 2,371,630 | 26.6 | 10.0 | 16.6 | 3.18 |
| 1948 | 148,013 | 3,637,000 | 1,444,337 | 2,192,663 | 24.9 | 9.8 | 15.1 | 3.03 |
| 1949 | 149,336 | 3,649,000 | 1,443,607 | 2,205,393 | 24.5 | 9.7 | 14.8 | 3.04 |
| 1950 | 151,861 | 3,632,000 | 1,452,454 | 2,180,000 | 24.1 | 9.6 | 14.5 | 3.03 |
| 1951 | 154,056 | 3,823,000 | 1,482,099 | 2,340,901 | 24.8 | 9.6 | 15.2 | 3.20 |
| 1952 | 156,431 | 3,913,000 | 1,496,838 | 2,416,162 | 25.0 | 9.6 | 15.4 | 3.30 |
| 1953 | 159,047 | 3,965,000 | 1,447,459 | 2,142,000 | 25.2 | 9.1 | 16.1 | 3.36 |
| 1954 | 161,948 | 4,078,000 | 1,481,091 | 2,596,909 | 24.8 | 9.3 | 15.5 | 3.48 |
| 1955 | 163,476 | 4,097,000 | 1,528,717 | 2,568,283 | 25.0 | 9.3 | 14.3 | 3.52 |
| 1956 | 166,578 | 4,218,000 | 1,564,476 | 2,653,524 | 25.1 | 9.3 | 15.8 | 3.63 |
| 1957 | 169,637 | 4,308,000 | 1,633,128 | 2,666,872 | 25.3 | 9.5 | 15.8 | 3.71 |
| 1958 | 172,668 | 4,255,000 | 1,647,886 | 2,607,114 | 24.4 | 9.5 | 14.9 | 3.65 |
| 1959 | 175,642 | 4,244,796 | 1,656,814 | 2,587,982 | 24.0 | 9.4 | 14.7 | 3.66 |
| 1960 | 179,979 | 4,257,850 | 1,711,982 | 2,545,868 | 23.7 | 9.5 | 14.1 | 3.65 |
| 1961 | 182,992 | 4,268,326 | 1,701,522 | 2,566,804 | 23.3 | 9.3 | 14.0 | 3.62 |
| 1962 | 185,771 | 4,167,362 | 1,756,720 | 2,410,642 | 22.4 | 9.5 | 12.9 | 3.46 |
| 1963 | 188,483 | 4,098,020 | 1,813,549 | 2,284,471 | 21.7 | 9.6 | 12.1 | 3.32 |
| 1964 | 191,141 | 4,027,490 | 1,798,051 | 2,229,439 | 21.1 | 9.4 | 11.7 | 3.19 |
| 1965 | 193,526 | 3,760,358 | 1,828,136 | 1,932,222 | 19.4 | 9.5 | 9.9 | 2.91 |
| 1966 | 195,576 | 3,606,274 | 1,863,149 | 1,743,125 | 18.4 | 9.5 | 8.9 | 2.72 |
| 1967 | 197,457 | 3,520,959 | 1,851,323 | 1,669,636 | 17.8 | 9.4 | 8.4 | 2.56 |
| 1968 | 199,399 | 3,501,564 | 1,930,082 | 1,571,482 | 17.6 | 9.7 | 7.9 | 2.46 |
| 1969 | 201,385 | 3,600,206 | 1,921,990 | 1,678,216 | 17.9 | 9.5 | 8.4 | 2.46 |
| 1970 | 203,984 | 3,731,386 | 1,921,031 | 1,810,355 | 18.4 | 9.4 | 9.0 | 2.480 |
| 1971 | 206,827 | 3,555,970 | 1,927,542 | 1,628,428 | 17.2 | 9.3 | 7.9 | 2.266 |
| 1972 | 209,284 | 3,258,411 | 1,963,944 | 1,294,467 | 15.6 | 9.4 | 6.2 | 2.010 |
| 1973 | 211,357 | 3,136,965 | 1,973,003 | 1,163,962 | 14.8 | 9.5 | 5.3 | 1.879 |
| 1974 | 213,342 | 3,159,958 | 1,934,388 | 1,225,570 | 14.8 | 9.1 | 5.7 | 1.835 |
| 1975 | 215,465 | 3,144,198 | 1,892,879 | 1,251,319 | 14.6 | 8.8 | 5.8 | 1.774 |
| 1976 | 217,563 | 3,167,788 | 1,909,440 | 1,258,348 | 14.6 | 8.8 | 5.8 | 1.738 |
| 1977 | 219,760 | 3,326,632 | 1,899,597 | 1,427,035 | 15.1 | 8.6 | 6.5 | 1.789 |
| 1978 | 222,095 | 3,333,279 | 1,927,788 | 1,405,491 | 15.0 | 8.7 | 6.3 | 1.760 |
| 1979 | 224,567 | 3,494,398 | 1,913,841 | 1,580,557 | 15.6 | 8.5 | 7.1 | 1.808 |
| 1980 | 227,225 | 3,612,258 | 1,989,841 | 1,622,417 | 15.9 | 8.8 | 7.1 | 1.839 |
| 1981 | 229,466 | 3,629,238 | 1,977,981 | 1,651,257 | 15.8 | 8.6 | 7.2 | 1.812 |
| 1982 | 231,664 | 3,680,537 | 1,974,797 | 1,705,740 | 15.9 | 8.5 | 7.4 | 1.827 |
| 1983 | 233,792 | 3,638,933 | 2,019,201 | 1,619,732 | 15.6 | 8.6 | 6.9 | 1.799 |
| 1984 | 235,825 | 3,669,141 | 2,039,369 | 1,629,772 | 15.6 | 8.6 | 6.9 | 1.806 |
| 1985 | 237,924 | 3,760,561 | 2,086,440 | 1,674,121 | 15.8 | 8.8 | 7.0 | 1.844 |
| 1986 | 240,133 | 3,756,547 | 2,105,361 | 1,651,186 | 15.6 | 8.8 | 6.9 | 1.837 |
| 1987 | 242,289 | 3,809,394 | 2,123,323 | 1,686,071 | 15.7 | 8.8 | 7.0 | 1.872 |
| 1988 | 244,499 | 3,909,510 | 2,167,999 | 1,741,511 | 16.0 | 8.9 | 7.1 | 1.934 |
| 1989 | 246,819 | 4,040,958 | 2,150,466 | 1,890,492 | 16.4 | 8.7 | 7.7 | 2.014 |
| 1990 | 249,623 | 4,158,212 | 2,148,463 | 2,009,749 | 16.7 | 8.6 | 8.1 | 2.081 |
| 1991 | 252,981 | 4,110,907 | 2,169,518 | 1,941,389 | 16.2 | 8.6 | 7.7 | 2.062 |
| 1992 | 256,514 | 4,065,014 | 2,175,613 | 1,889,401 | 15.8 | 8.5 | 7.4 | 2.046 |
| 1993 | 259,919 | 4,000,240 | 2,268,553 | 1,731,687 | 15.4 | 8.7 | 6.7 | 2.019 |
| 1994 | 263,126 | 3,952,767 | 2,278,994 | 1,673,773 | 15.0 | 8.7 | 6.4 | 2.001 |
| 1995 | 266,278 | 3,899,589 | 2,312,132 | 1,587,457 | 14.6 | 8.7 | 6.0 | 1.978 |
| 1996 | 269,394 | 3,891,494 | 2,314,690 | 1,576,804 | 14.4 | 8.6 | 5.9 | 1.976 |
| 1997 | 272,647 | 3,880,894 | 2,314,245 | 1,566,649 | 14.2 | 8.5 | 5.7 | 1.971 |
| 1998 | 275,854 | 3,941,553 | 2,337,256 | 1,604,297 | 14.3 | 8.5 | 5.8 | 1.999 |
| 1999 | 279,040 | 3,959,417 | 2,391,399 | 1,568,018 | 14.2 | 8.6 | 5.6 | 2.007 |
| 2000 | 282,172 | 4,058,814 | 2,403,351 | 1,655,463 | 14.4 | 8.5 | 5.9 | 2.056 |
| 2001 | 285,082 | 4,025,933 | 2,416,425 | 1,609,508 | 14.1 | 8.5 | 5.6 | 2.030 |
| 2002 | 287,804 | 4,021,726 | 2,443,387 | 1,578,339 | 14.0 | 8.5 | 5.5 | 2.020 |
| 2003 | 290,326 | 4,089,950 | 2,448,288 | 1,641,662 | 14.1 | 8.4 | 5.5 | 2.047 |
| 2004 | 293,046 | 4,112,052 | 2,397,615 | 1,714,437 | 14.0 | 8.2 | 5.9 | 2.051 |
| 2005 | 295,753 | 4,138,349 | 2,448,017 | 1,690,332 | 14.0 | 8.3 | 5.7 | 2.057 |
| 2006 | 298,593 | 4,265,555 | 2,426,264 | 1,839,291 | 14.3 | 8.1 | 6.2 | 2.108 |
| 2007 | 301,580 | 4,316,233 | 2,423,712 | 1,892,521 | 14.3 | 8.0 | 6.3 | 2.120 |
| 2008 | 304,375 | 4,247,694 | 2,471,984 | 1,775,710 | 14.0 | 8.1 | 5.9 | 2.072 |
| 2009 | 307,007 | 4,130,665 | 2,437,163 | 1,693,502 | 13.5 | 7.9 | 5.6 | 2.002 |
| 2010 | 309,330 | 3,999,386 | 2,468,435 | 1,530,951 | 13.0 | 8.0 | 5.0 | 1.931 |
| 2011 | 311,583 | 3,953,590 | 2,515,458 | 1,438,412 | 12.7 | 8.1 | 4.6 | 1.894 |
| 2012 | 313,874 | 3,952,841 | 2,543,279 | 1,409,562 | 12.6 | 8.1 | 4.5 | 1.880 |
| 2013 | 316,129 | 3,932,181 | 2,596,993 | 1,335,188 | 12.4 | 8.2 | 4.2 | 1.857 |
| 2014 | 319,113 | 3,988,076 | 2,626,418 | 1,361,658 | 12.5 | 8.2 | 4.3 | 1.862 |
| 2015 | 321,442 | 3,978,497 | 2,712,630 | 1,265,867 | 12.4 | 8.4 | 4.0 | 1.843 |
| 2016 | 323,100 | 3,945,875 | 2,744,248 | 1,201,167 | 12.2 | 8.5 | 3.7 | 1.820 |
| 2017 | 325,719 | 3,855,500 | 2,813,503 | 1,041,997 | 11.8 | 8.7 | 3.1 | 1.765 |
| 2018 | 326,687 | 3,791,712 | 2,839,205 | 952,507 | 11.6 | 8.7 | 2.9 | 1.729 |
| 2019 | 328,240 | 3,747,540 | 2,854,838 | 892,682 | 11.4 | 8.7 | 2.7 | 1.705 |
| 2020 | 331,449 | 3,613,647 | 3,358,814 | 254,833 | 10.9 | 10.2 | 0.7 | 1.638 |
| 2021 | 3,664,292 | 3,464,231 | 200,061 | 11.0 | 10.4 | 0.5 | 1.664 | |
| 2021 | 3,661,220 | 3,273,705 | 394,053 | 11.0 | 9.8 | 1.2 | 1.665 |
Source: National Center for Health Statistics,[53][54] Census Bureau Intercensal Estimates [9][55][56][57][58][59]
White (including White Hispanic)
_from_1960_to_2020.gif)
Average population and percentage of population figures shown are slightly higher than given Census Bureau data, due to the fact that the definition of "White" in this case includes, along with Non-Hispanic Whites and White Hispanics, Hispanics who identify as "Some Other Race", but are counted as White due to the option and category of "Some Other Race" alone often not being one in CDC demographic data.
| Average population (x 1,000) | Live births[60] | Deaths[61] | Natural change | Crude birth rate (per 1,000) | Crude death rate (per 1,000) | Natural change (per 1,000) | Fertility rates | |
|---|---|---|---|---|---|---|---|---|
| 1990 | 208,227 (83.4%) | 3,290,273 (79.12%) | 1,853,254 | 1,437,019 | 15.8 | 8.8 | 7.0 | 2.00 |
| 1991 | 3,241,273 (78.84%) | 1,868,904 | 1,372,369 | 15.3 | 8.8 | 6.5 | 1.99 | |
| 1992 | 3,201,678 (78.76%) | 1,873,781 | 1,327,897 | 15.0 | 8.8 | 6.2 | 1.98 | |
| 1993 | 3,149,833 (78.74%) | 1,951,437 | 1,198,396 | 14.6 | 9.0 | 5.6 | 1.96 | |
| 1994 | 3,121,004 (78.96%) | 1,959,875 | 1,161,129 | 14.3 | 9.0 | 5.3 | 1.96 | |
| 1995 | 3,098,885 (79.46%) | 1,987,437 | 1,111,448 | 14.1 | 9.0 | 5.1 | 1.95 | |
| 1996 | 3,093,057 (79.48%) | 1,992,966 | 1,100,091 | 13.9 | 9.0 | 4.9 | 1.96 | |
| 1997 | 3,072,640 (79.17%) | 1,996,393 | 1,076,247 | 13.7 | 8.9 | 4.8 | 1.96 | |
| 1998 | 3,118,727 (79.12%) | 2,015,984 | 1,102,743 | 13.8 | 8.9 | 4.9 | 1.99 | |
| 1999 | 3,132,501 (79.11%) | 2,061,348 | 1,071,153 | 13.7 | 9.0 | 4.7 | 2.01 | |
| 2000 | 229,784 (81.4%) | 3,194,005 (78.69%) | 2,071,287 | 1,122,718 | 13.9 | 9.0 | 4.9 | 2.05 |
| 2001 | 3,177,626 (78.92%) | 2,079,691 | 1,097,935 | 13.7 | 8.9 | 4.8 | 2.04 | |
| 2002 | 3,174,760 (78.94%) | 2,102,589 | 1,072,171 | 13.6 | 9.0 | 4.6 | 2.04 | |
| 2003 | 3,225,848 (78.87%) | 2,103,714 | 1,122,134 | 13.7 | 8.9 | 4.8 | 2.07 | |
| 2004 | 3,222,928 (78.38%) | 2,056,643 | 1,166,285 | 13.6 | 8.7 | 4.9 | 2.07 | |
| 2005 | 3,229,294 (78.03%) | 2,098,097 | 1,131,197 | 13.6 | 8.8 | 4.8 | 2.08 | |
| 2006 | 3,310,308 (77.60%) | 2,077,549 | 1,232,759 | 13.8 | 8.7 | 5.1 | 2.12 | |
| 2007 | 3,336,626 (77.30%) | 2,074,151 | 1,262,475 | 13.8 | 8.6 | 5.2 | 2.14 | |
| 2008 | 3,274,163 (77.08%) | 2,120,233 | 1,153,930 | 13.5 | 8.7 | 4.8 | 2.09 | |
| 2009 | 3,173,293 (76.82%) | 2,086,355 | 1,086,938 | 13.0 | 8.5 | 4.5 | 2.02 | |
| 2010 | 245,520 (79.4%) | 3,069,315 (76.74%) | 2,114,749 | 954,566 | 12.5 | 8.6 | 3.9 | 1.95 |
| 2011 | 3,020,355 (76.39%) | 2,156,077 | 864,278 | 12.2 | 8.7 | 3.5 | 1.91 | |
| 2012 | 2,999,820 (75.89%) | 2,175,178 | 824,642 | 12.1 | 8.8 | 3.3 | 1.89 | |
| 2013 | 2,985,757 (75.93%) | 2,217,103 | 768,654 | 12.0 | 8.9 | 3.1 | 1.87 | |
| 2014 | 3,019,863 (75.72%) | 2,237,880 | 781,983 | 12.0 | 8.9 | 3.1 | 1.88 | |
| 2015 | 251,071 (78.1%) | 3,012,855 (75.73%) | 12.0 | 1.86 | ||||
| 2016 | 2,900,933 (73.5%) | 1.77 | ||||||
| 2017 | 2,812,267 (72.9%) | 1.76 | ||||||
| 2018 | 2,788,439 (73.5%) | 1.75 | ||||||
| 2019 | 2,744,570 (73.2%) |
White (non-Hispanic)
The natural increase is slightly smaller than shown for non-Hispanic whites and slightly different for non-Hispanic blacks because the birth figures shown refer to mothers of that race, not the children. Most non-white babies of non-Hispanic white mothers are either Hispanic or black, and non-Hispanic black mothers occasionally have Hispanic children. On the other hand, all children born to Hispanic mothers, even if the mothers are white Hispanic, are counted as Hispanic.
| Average population (x 1,000) | Live births1 | Deaths | Natural change1 | Crude birth rate (per 1,000) | Crude death rate (per 1,000) | Natural change (per 1,000) | Fertility rates | |
|---|---|---|---|---|---|---|---|---|
| 19902 | 188,128 (75.6) | 2,626,500 (63.16%) | 14.4 | 1.85 | ||||
| 19912 | 2,589,878 (63.00%) | 13.9 | 1.82 | |||||
| 19922 | 2,527,207 (62.17%) | 13.4 | 1.80 | |||||
| 1993 | 2,472,031 (61.80%) | 13.1 | 1.79 | |||||
| 1994 | 2,438,855 (61.70%) | 12.8 | 1.78 | |||||
| 1995 | 2,382,638 (61.10%) | 12.5 | 1.78 | |||||
| 1996 | 2,358,989 (60.62%) | 12.3 | 1.78 | |||||
| 1997 | 2,333,363 (60.12%) | 1,895,461 | 437,902 | 12.2 | 9.7 | 2.5 | 1.79 | |
| 1998 | 2,361,462 (59.91%) | 1,912,802 | 448,660 | 12.2 | 9.7 | 2.5 | 1.82 | |
| 1999 | 2,346,450 (59.26%) | 1,953,197 | 393,253 | 12.1 | 9.9 | 2.2 | 1.84 | |
| 2000 | 195,702 (69.3%) | 2,362,968 (58.22%) | 1,959,919 | 403,049 | 12.2 | 9.9 | 2.3 | 1.87 |
| 2001 | 195,975 (68.7%) | 2,326,578 (57.79%) | 1,962,810 | 363,768 | 11.9 | 9.9 | 2.0 | 1.85 |
| 2002 | 196,141 (68.1%) | 2,298,156 (57.14%) | 1,981,973 | 316,183 | 11.7 | 10.0 | 1.7 | 1.84 |
| 2003 | 196,233 (67.6%) | 2,321,904 (56.77%) | 1,979,465 | 342,439 | 11.8 | 10.0 | 1.8 | 1.87 |
| 2004 | 196,462 (67.0%) | 2,296,683 (55.85%) | 1,933,382 | 363,301 | 11.7 | 9.7 | 2.0 | 1.87 |
| 2005 | 196,621 (66.4%) | 2,279,768 (55.09%) | 1,967,142 | 312,626 | 11.6 | 9.9 | 1.7 | 1.87 |
| 2006 | 196,833 (65.9%) | 2,308,640 (54.12%) | 1,944,617 | 364,023 | 11.7 | 9.8 | 1.9 | 1.90 |
| 2007 | 197,011 (65.3%) | 2,310,333 (53.53%) | 1,939,606 | 370,727 | 11.7 | 9.7 | 2.0 | 1.91 |
| 2008 | 197,184 (64.8%) | 2,267,817 (53.39%) | 1,981,034 | 286,783 | 11.5 | 9.9 | 1.6 | 1.87 |
| 2009 | 197,275 (64.3%) | 2,212,552 (53.56%) | 1,944,606 | 267,946 | 11.2 | 9.7 | 1.5 | 1.83 |
| 2010 | 196,929 (63.7%) | 2,162,406 (54.07%) | 1,969,916 | 192,490 | 10.9 | 9.8 | 1.1 | 1.79 |
| 2011 | 197,085 (63.3%) | 2,146,566 (54.29%) | 2,006,319 | 140,247 | 10.8 | 10.0 | 0.8 | 1.77 |
| 2012 | 197,243 (62.8%) | 2,134,044 (53.99%) | 2,016,896 | 117,148 | 10.7 | 10.0 | 0.7 | 1.76 |
| 2013 | 197,392 (62.4%) | 2,129,196 (54.15%) | 2,052,660 | 76,536 | 10.7 | 10.2 | 0.5 | 1.75 |
| 2014 | 197,409 (61.9%) | 2,149,302 (53.89%) | 2,066,949 | 82,353 | 10.8 | 10.3 | 0.5 | 1.76 |
| 2015 | 197,534 (61.5%) | 2,130,279 (53.59%) | 2,123,631 | 6,648 | 10.7 | 10.6 | 0.1 | 1.75 |
| 2016 | 197,479 (61.1%) | 2,056,332 (52.11%) | 2,133,463 | -77,131 | 10.5 | 10.6 | -0.1 | 1.72 |
| 2017 | 197,285 (60.6%) | 1,992,461 (51.67%) | 2,179,857 | -187,396 | 10.2 | 10.8 | -0.7 | 1.67 |
| 2018 | 197,071 (60.3%) | 1,956,413 (51.60%) | 2,188,349 | -231,936 | 10.0 | 10.9 | -1.0 | 1.64 |
| 2019 | 196,705 (59.9%) | 1,915,912 (51.12%) | 2,182,552 | -266,640 | 9.8 | 10.9 | -1.2 | 1.61 |
| 2020 | 196,414 (59.3%) | 1,843,432 (51.01%) | 2,467,419 | -623,987 | 9.4 | 12.5 | -3.0 | 1.55 |
| 2021 | 1,887,656 (51.51%) | 2,548,809 | -661,153 | 9.7 | 13.0 | -3.3 | 1.60 | |
| 2022 | 1,832,532 (50.05%) | 2,444,427 | -611,895 |
Black (non-Hispanic)
| Average population (x 1,000) | Live births1 | Deaths | Natural change1 | Crude birth rate (per 1,000) | Crude death rate (per 1,000) | Natural change (per 1,000) | Fertility rates | |
|---|---|---|---|---|---|---|---|---|
| 19902 | 29,986 (12.1) | 661,701 (15.91%) | 23.0 | 2.55 | ||||
| 19912 | 666,758 (16.22%) | 22.4 | 2.53 | |||||
| 19922 | 657,450 (16.17%) | 21.6 | 2.48 | |||||
| 1993 | 641,273 (16.03%) | 20.7 | 2.41 | |||||
| 1994 | 619,198 (15.66%) | 19.5 | 2.31 | |||||
| 1995 | 587,781 (15.07%) | 18.2 | 2.19 | |||||
| 1996 | 578,099 (14.86%) | 17.6 | 2.14 | |||||
| 1997 | 581,431 (14.98%) | 273,381 | 308,050 | 17.4 | 8.1 | 9.3 | 2.14 | |
| 1998 | 593,127 (15.05%) | 275,264 | 317,863 | 17.5 | 8.0 | 9.5 | 2.16 | |
| 1999 | 34,722 | 588,981 (14.88%) | 281,979 | 307,002 | 17.0 | 8.1 | 9.0 | 2.13 |
| 2000 | 35,092 (12.4%) | 604,346 (14.89%) | 282,676 | 321,670 | 17.2 | 8.1 | 9.3 | 2.18 |
| 2001 | 35,638 | 589,917 (14.65%) | 284,343 | 305,574 | 16.6 | 8.0 | 8.6 | 2.11 |
| 2002 | 36,050 | 578,335 (14.38%) | 286,573 | 291,762 | 16.0 | 7.9 | 8.2 | 2.05 |
| 2003 | 36,422 | 576,033 (14.08%) | 287,968 | 288,065 | 15.8 | 7.9 | 8.0 | 2.04 |
| 2004 | 36,849 | 578,772 (14.08%) | 283,859 | 294,913 | 15.7 | 7.7 | 8.1 | 2.03 |
| 2005 | 37,271 | 583,759 (14.11%) | 289,163 | 294,596 | 15.7 | 7.8 | 8.1 | 2.03 |
| 2006 | 37,719 | 617,247 (14.47%) | 286,581 | 330,666 | 16.4 | 7.6 | 8.9 | 2.13 |
| 2007 | 38,185 | 627,191 (14.53%) | 286,366 | 340,825 | 16.4 | 7.5 | 9.1 | 2.14 |
| 2008 | 38,652 | 623,029 (14.67%) | 285,522 | 337,507 | 16.1 | 7.4 | 8.9 | 2.12 |
| 2009 | 39,105 | 609,584 (14.76%) | 282,982 | 326,602 | 15.6 | 7.2 | 8.5 | 2.05 |
| 2010 | 39,437 (12.3%) | 589,808 (14.75%) | 283,438 | 306,370 | 15.0 | 7.2 | 7.9 | 1.97 |
| 2011 | 39,945 (12.2%) | 582,345 (14.73%) | 286,797 | 295,548 | 14.6 | 7.2 | 7.5 | 1.92 |
| 2012 | 40,391 (12.3%) | 583,489 (14.76%) | 291,179 | 292,310 | 14.4 | 7.2 | 7.4 | 1.90 |
| 2013 | 40,802 (12.3%) | 583,834 (14.85%) | 299,227 | 284,607 | 14.3 | 7.3 | 7.1 | 1.88 |
| 2014 | 41,317 (12.3%) | 588,891 (14.77%) | 303,844 | 285,047 | 14.3 | 7.4 | 7.1 | 1.87 |
| 2015 | 41,777 (12.3%) | 589,047 (14.86%) | 315,254 | 273,793 | 14.1 | 7.6 | 6.7 | 1.86 |
| 2016 | 42,142 (12.3%) | 558,622 (14.16%) | 326,810 | 231,812 | 14.0 | 7.8 | 6.2 | 1.83 |
| 2017 | 42,624 (12.3%) | 560,715 (14.54%) | 335,667 | 225,048 | 13.9 | 7.9 | 6.0 | 1.82 |
| 2018 | 42,935 | 552,029 (14.56%) | 343,393 | 208,636 | 13.6 | 8.0 | 5.6 | 1.79 |
| 2019 | 43,236 | 548,075 (14.62%) | 348,761 | 199,314 | 13.4 | 8.1 | 5.3 | 1.78 |
| 2020 | 43,577 | 529,811 (14.66%) | 443,116 | 86,695 | 12.8 | 10.1 | 2.8 | 1.71 |
| 2021 | 517,889 (14.13%) | 449,764 | 68,125 | 12.5 | 10.9 | 1.6 | 1.68 | |
| 2022 | 510,469 (13.94%) | 410,126 | 100,343 | 1.65 |
Asian (including of Hispanic origin)
| Average population (x 1,000) | Live births1 | Deaths | Natural change1 | Crude birth rate (per 1,000) | Crude death rate (per 1,000) | Natural change (per 1,000) | Fertility rates | |
|---|---|---|---|---|---|---|---|---|
| 1990 | 141,635 (3.41%) | 21,127 | 120,508 | 19.0 | 2.00 | |||
| 1991 | 145,372 (3.54%) | 22,173 | 123,199 | 18.3 | 1.93 | |||
| 1992 | 150,250 (3.70%) | 23,660 | 126,590 | 17.9 | 1.90 | |||
| 1993 | 152,800 (3.82%) | 25,386 | 127,414 | 17.3 | 1.84 | |||
| 1994 | 157,632 (3.99%) | 27,103 | 130,529 | 17.1 | 1.83 | |||
| 1995 | 160,287 (4.11%) | 28,297 | 131,990 | 16.7 | 1.80 | |||
| 1996 | 165,776 (4.26%) | 29,508 | 136,268 | 16.5 | 1.79 | |||
| 1997 | 169,769 (4.37%) | 30,756 | 139,013 | 16.2 | 1.76 | |||
| 1998 | 172,652 (4.38%) | 31,987 | 140,665 | 15.9 | 1.73 | |||
| 1999 | 180,776 (4.57%) | 33,675 | 147,101 | 15.9 | 1.75 | |||
| 2000 | 11,173 (4.0%) | 200,543 (4.94%) | 34,875 | 165,668 | 17.1 | 1.89 | ||
| 2001 | 11,670 (4.1%) | 200,279 (4.97%) | 37,048 | 163,231 | 16.1 | 3.0 | 13.1 | 1.79 |
| 2002 | 12,157 (4.2%) | 210,907 (5.24%) | 38,332 | 172,575 | 16.3 | 3.0 | 13.3 | 1.79 |
| 2003 | 12,626 (4.3%) | 221,203 (5.41%) | 40,127 | 181,076 | 16.4 | 3.0 | 13.4 | 1.82 |
| 2004 | 13,090 (4.5%) | 229,123 (5.57%) | 40,533 | 188,590 | 16.4 | 2.9 | 13.5 | 1.83 |
| 2005 | 13,576 (4.6%) | 231,108 (5.58%) | 43,194 | 187,914 | 15.9 | 3.0 | 12.9 | 1.78 |
| 2006 | 14,067 (4.7%) | 241,045 (5.65%) | 44,707 | 196,338 | 16.0 | 3.0 | 13.0 | 1.80 |
| 2007 | 14,548 (4.8%) | 254,488 (5.90%) | 45,609 | 208,879 | 16.4 | 2.9 | 13.5 | 1.85 |
| 2008 | 15,031 (4.9%) | 253,185 (5.96%) | 47,903 | 205,282 | 15.7 | 3.0 | 12.7 | 1.80 |
| 2009 | 15,492 (5.0%) | 251,089 (6.08%) | 49,225 | 201,864 | 15.1 | 3.0 | 12.1 | 1.74 |
| 2010 | 15,922 (5.1%) | 246,886 (6.17%) | 50,018 | 196,868 | 14.5 | 3.1 | 11.4 | 1.69 |
| 2011 | 16,270 (5.2%) | 253,915 (6.42%) | 52,346 | 201,479 | 14.5 | 3.2 | 11.3 | 1.71 |
| 2012 | 272,802 (6.90%) | 55,298 | 217,504 | 15.1 | 3.2 | 11.9 | 1.77 | |
| 2013 | 265,673 (6.76%) | 58,702 | 206,971 | 14.3 | 3.3 | 11.0 | 1.68 | |
| 2014 | 282,723 (7.09%) | 60,424 | 222,299 | 14.6 | 3.3 | 11.3 | 1.72 | |
| 2015 | 281,264 (7.12%) | 65,277 | 215,987 | 14.0 | 3.4 | 10.6 | 1.65 | |
| 2016* | 17,345 (5.4%) | 254,471 (6.45%) | 68,235 | 186,236 | 14.6 | 3.5 | 11.1 | 1.69 |
| 2017* | 18,000 (5.5%) | 249,250 (6.46%) | 72,598 | 176,652 | 13.8 | 3.6 | 10.2 | 1.60 |
| 2018* | 18,401 (5.6%) | 240,798 (6.35%) | 75,266 | 165,532 | 13.2 | 3.7 | 9.5 | 1.53 |
| 2019* | 18,798 (5.7%) | 238,769 (6.37%) | 70,532 | 168,237 | 13.0 | 3.7 | 9.3 | 1.51 |
| 2020* | 19,032 (5.7%) | 219,068 (6.06%) | 90,519 | 128,549 | 11.6 | 4.7 | 6.9 | 1.38 |
| 2021* | 213,813 (5.83%) | 11.2 | 1.35 | |||||
| 2022 | 218,683 (5.97%) |
* The data from 2016 to 2021, exclude those of hispanic origin, and also births from the Pacific Islanders and Hawaiian.
American Indian and Alaskan Native (including of Hispanic origin)
| Average population (x 1,000) | Live births1 | Deaths | Natural change1 | Crude birth rate (per 1,000) | Crude death rate (per 1,000) | Natural change (per 1,000) | Fertility rates | |
|---|---|---|---|---|---|---|---|---|
| 1990 | 39,051 (0.94%) | 8,316 | 30,735 | 18.9 | 2.19 | |||
| 1991 | 38,841 (0.94%) | 8,621 | 30,220 | 18.3 | 2.14 | |||
| 1992 | 39,453 (0.97%) | 8,953 | 30,500 | 17.9 | 2.14 | |||
| 1993 | 38,732 (0.97%) | 9,579 | 29,153 | 17.0 | 2.01 | |||
| 1994 | 37,740 (0.95%) | 9,637 | 28,103 | 16.0 | 1.95 | |||
| 1995 | 37,278 (0.96%) | 9,997 | 27,281 | 15.3 | 1.88 | |||
| 1996 | 37,880 (0.97%) | 10,127 | 27,753 | 14.9 | 1.86 | |||
| 1997 | 38,572 (0.99%) | 10,576 | 27,996 | 14.7 | 1.83 | |||
| 1998 | 40,272 (1.02%) | 10,845 | 29,427 | 14.8 | 1.85 | |||
| 1999 | 40,170 (1.01%) | 11,312 | 28,858 | 14.2 | 1.78 | |||
| 2000 | 2,684 (1.0%) | 41,668 (1.03%) | 11,363 | 30,305 | 14.0 | 3.8 | 10.2 | 1.77 |
| 2001 | 2,770 (1.0%) | 41,872 (1.04%) | 11,977 | 29,895 | 13.6 | 3.9 | 9.7 | 1.72 |
| 2002 | 2,857 (1.0%) | 42,368 (1.05%) | 12,415 | 29,953 | 13.3 | 3.9 | 9.4 | 1.68 |
| 2003 | 2,948 (1.0%) | 43,052 (1.05%) | 13,147 | 29,905 | 13.0 | 4.0 | 9.0 | 1.64 |
| 2004 | 3,045 (1.0%) | 43,927 (1.07%) | 13,124 | 30,803 | 12.8 | 3.8 | 9.0 | 1.61 |
| 2005 | 3,148 (1.1%) | 44,813 (1.08%) | 13,918 | 30,895 | 12.6 | 3.9 | 8.7 | 1.59 |
| 2006 | 3,259 (1.1%) | 47,721 (1.12%) | 14,037 | 33,684 | 13.0 | 3.8 | 9.2 | 1.63 |
| 2007 | 3,377 (1.1%) | 49,443 (1.15%) | 14,367 | 35,076 | 12.9 | 3.8 | 9.1 | 1.63 |
| 2008 | 3,505 (1.2%) | 49,537 (1.17%) | 14,776 | 34,761 | 12.5 | 3.7 | 8.8 | 1.57 |
| 2009 | 3,637 (1.2%) | 48,665 (1.18%) | 14,960 | 33,705 | 11.8 | 3.6 | 8.2 | 1.50 |
| 2010 | 3,755 (1.2%) | 46,760 (1.17%) | 15,565 | 31,195 | 11.0 | 3.6 | 7.4 | 1.40 |
| 2011 | 3,815 (1.2%) | 46,419 (1.17%) | 15,945 | 30,474 | 10.7 | 3.7 | 7.0 | 1.37 |
| 2012 | 46,093 (1.17%) | 16,527 | 29,566 | 10.5 | 3.8 | 6.7 | 1.35 | |
| 2013 | 45,991 (1.17%) | 17,052 | 28,939 | 10.3 | 3.8 | 6.5 | 1.33 | |
| 2014 | 44,928 (1.13%) | 18,008 | 26,920 | 9.9 | 4.0 | 5.9 | 1.29 | |
| 2015 | 4,566 (1.4%) | 44,299 (1.11%) | 18,039 | 26,260 | 9.7 | 1.26 | ||
| 2016* | 2,126 (0.7%) | 31,452 (0.80%) | 18,595 | 12,857 | 13.3 | 6.9 | 6.4 | 1.79 |
| 2017* | 2,145 (0.7%) | 29,957 (0.78%) | 19,198 | 10,759 | 12.6 | 8.9 | 3.7 | 1.70 |
| 2018* | 2,157 (0.7%) | 29,092 (0.77%) | 19,491 | 9,673 | 12.2 | 9.0 | 3.2 | 1.65 |
| 2019* | 2,168 (0.7%) | 28,450 (0.76%) | 19,696 | 8,754 | 11.9 | 1.61 | ||
| 2020 | 2,174 (0.7%) | 26,813 (0.74%) | 24,279 | 2,534 | 11.1 | 1.52 | ||
| 2021 | 26,124 (0.71%) | 10.8 | 1.48 | |||||
| 2022 | 25,370 (0.69%) |
* The data from 2016 to 2019, exclude those of hispanic origin.
Pacific Islanders and Hawaiian
| Average population (x 1,000) | Live births1 | Deaths | Natural change1 | Crude birth rate (per 1,000) | Crude death rate (per 1,000) | Natural change (per 1,000) | Fertility rates | |
|---|---|---|---|---|---|---|---|---|
| 2016 | 534 (0.2%) | 9,342 (0.24%) | 16.8 | 2.08 | ||||
| 2017 | 547 (0.2%) | 9,426 (0.24%) | 16.7 | 2.09 | ||||
| 2018 | 571 (0.2%) | 9,476 (0.25%) | 3,277 | 6,199 | 16.6 | 2.11 | ||
| 2019 | 579 (0.2%) | 9,770 (0.26%) | 3,491 | 6,279 | 17.0 | 2.18 | ||
| 2020 | 588 (0.2%) | 9,626 (0.27%) | 4,424 | 5,202 | 16.1 | 2.13 | ||
| 2021 | 9,531 (0.26%) | 15.8 | 2.13 | |||||
| 2022 | 10,085 (0.27%) |
Hispanics (of all racial groups)
- Notes: Estimates for the population of each race by year (available starting in 2000) do not include multiracial individuals which have been "bridged" to the single-race categories for the purposes of calculating the birth and fertility rates.
New Hampshire did not start reporting Hispanic origin until 1993, and Oklahoma until 1991, so data from those states are excluded before then.
| Average population (x 1,000) | Live births | Deaths | Natural change | Crude birth rate (per 1,000) | Crude death rate (per 1,000) | Natural change (per 1,000) | Fertility rates | |
|---|---|---|---|---|---|---|---|---|
| 19902 | 22,354 (9.0%) | 595,073 (14.31%) | 26.7 | 2.96 | ||||
| 19912 | 623,085 (15.16%) | 26.5 | 2.96 | |||||
| 19922 | 643,271 (15.82%) | 26.1 | 2.96 | |||||
| 1993 | 654,418 (16.36%) | 25.4 | 2.89 | |||||
| 1994 | 665,026 (16.82%) | 24.7 | 2.84 | |||||
| 1995 | 679,768 (17.43%) | 24.1 | 2.80 | |||||
| 1996 | 701,339 (18.02%) | 23.8 | 2.77 | |||||
| 1997 | 709,767 (18.29%) | 95,460 | 614,307 | 23.0 | 3.1 | 19.9 | 2.68 | |
| 1998 | 734,661 (18.64%) | 98,406 | 636,255 | 22.7 | 3.0 | 19.6 | 2.65 | |
| 1999 | 764,339 (19.30%) | 103,740 | 660,599 | 22.5 | 3.1 | 19.4 | 2.65 | |
| 2000 | 35,662 (12.6%) | 815,868 (20.10%) | 107,254 | 708,614 | 23.1 | 3.0 | 20.1 | 2.73 |
| 2001 | 37,144 (13.0%) | 851,851 (21.16%) | 113,413 | 738,438 | 22.9 | 3.1 | 19.8 | 2.73 |
| 2002 | 38,618 (13.4%) | 876,642 (21.80%) | 117,135 | 759,507 | 22.7 | 3.0 | 19.7 | 2.71 |
| 2003 | 40,049 (13.8%) | 912,329 (22.31%) | 122,026 | 790,303 | 22.8 | 3.0 | 19.8 | 2.74 |
| 2004 | 41,501 (14.2%) | 946,349 (23.01%) | 122,416 | 823,933 | 22.8 | 3.0 | 19.9 | 2.76 |
| 2005 | 43,024 (14.5%) | 985,505 (23.81%) | 131,161 | 854,344 | 22.9 | 3.0 | 19.9 | 2.79 |
| 2006 | 44,606 (14.9%) | 1,039,077 (24.36%) | 133,004 | 906,073 | 23.3 | 3.0 | 20.3 | 2.86 |
| 2007 | 46,197 (15.3%) | 1,062,779 (24.62%) | 135,519 | 927,260 | 23.0 | 2.9 | 20.1 | 2.84 |
| 2008 | 47,794 (15.7%) | 1,041,239 (24.51%) | 139,241 | 901,998 | 21.8 | 2.9 | 18.9 | 2.71 |
| 2009 | 49,327 (16.1%) | 999,548 (24.20%) | 141,576 | 857,972 | 20.3 | 2.9 | 17.4 | 2.53 |
| 2010 | 50,740 (16.4%) | 945,180 (23.63%) | 144,490 | 800,690 | 18.7 | 2.9 | 15.8 | 2.35 |
| 2011 | 51,940 (16.7%) | 918,129 (23.22%) | 149,635 | 768,494 | 17.6 | 2.9 | 14.7 | 2.24 |
| 2012 | 52,961 (16.9%) | 907,677 (22.96%) | 156,419 | 751,258 | 17.1 | 3.0 | 14.1 | 2.19 |
| 2013 | 53,986 (17.1%) | 901,033 (22.91%) | 163,241 | 737,792 | 16.7 | 3.0 | 13.7 | 2.15 |
| 2014 | 55,279 (17.3%) | 914,065 (22.92%) | 169,387 | 744,678 | 16.5 | 3.0 | 13.5 | 2.13 |
| 2015 | 56,690 (17.6%) | 924,048 (23.27%) | 179,457 | 744,591 | 16.3 | 3.2 | 13.1 | 2.12 |
| 2016 | 57,399 (17.8%) | 918,447 (23.27%) | 188,254 | 730,193 | 16.0 | 3.3 | 12.7 | 2.09 |
| 2017 | 58,846 (18.1%) | 898,764 (23.31%) | 197,249 | 701,515 | 15.2 | 3.3 | 11.9 | 2.01 |
| 2018 | 59,872 (18.3%) | 886,210 (23.37%) | 204,719 | 681,491 | 14.8 | 3.4 | 11.4 | 1.96 |
| 2019 | 60,572 (18.5%) | 886,467 (23.65%) | 212,397 | 674,070 | 14.6 | 3.5 | 11.1 | 1.94 |
| 2020 | 61,188 (18.5%) | 866,713 (23.98%) | 304,488 | 562,225 | 14.0 | 4.9 | 9.2 | 1.88 |
| 2021 | 885,916 (24.18%) | 315,664 | 570,252 | 14.1 | 5.0 | 9.1 | 1.90 | |
| 2022 | 934,842 (25.53%) | 275,254 | 659,588 |
See also
- Demographic history of the United States
- Demographics of Hispanic and Latino Americans
- Demographics of the United States
- History of immigration to the United States (contains historical immigration data for the US, including the foreign-born percentage for the US and for each US state at every US Census year from 1850 and 2010)
- Majority minority
- Race and ethnicity in censuses
- Race and ethnicity in the United States
- Race and ethnicity in the United States Census
Notes
- First census allowing respondents to select more than one race
- Many residents who identified as White or Black alone in 2010 changed their identification to multiracial in 2020
- First census allowing respondents to select more than one race
- Many residents who identified as White or Black alone in 2010 changed their identification to multiracial in 2020, the percentage figures for White and Black etc. represent those who ticked Alone only.
References
- U.S. Bureau of the Census, Historical Statistics of the United States, Colonial Times to 1970, Bicentennial Edition, Part 2, Series Z 1–19. Chapter Z: Colonial and Pre-Federal Statistics Archived 2021-04-07 at the Wayback Machine. Washington, D.C., 1975.
- Gibson, Campbell; Kay Jung (September 2002). "Historical Census Statistics on Population Totals By Race, 1790 to 1990, and By Hispanic Origin, 1970 to 1990, For The United States, Regions, Divisions, and States". Population Division, U. S. Census Bureau. Archived from the original on 2012-08-12. Retrieved 2016-03-02.
- "A Brief History of the OMB Directive 15". American Anthropological Association. 1997. Archived from the original on April 19, 2012. Retrieved May 18, 2013.
- "Revisions to the Standards for the Classification of Federal Data on Race and Ethnicity". Office of Management and Budget. October 30, 1997. Archived from the original on February 8, 2004. Retrieved May 18, 2013.
- "Table 1. United States – Race and Hispanic Origin: 1790 to 1990" (PDF). Archived from the original (PDF) on 2010-03-27. Retrieved 2013-05-04.
- Gibson, Campbell; Kay Jung (September 13, 2002). "Table 4. South Region – Race and Hispanic Origin: 1790 to 1990" (PDF). Historical Census Statistics on Population Totals By Race, 1790 to 1990, and By Hispanic Origin, 1970 to 1990, For The United States, Regions, Divisions, and States. U.S. Census Bureau. Archived from the original (PDF) on 2010-03-27. Retrieved May 15, 2013.
- Copeland, Larry (2011-07-01). "Blacks return to Southern roots - USATODAY.com". Usatoday30.usatoday.com. Archived from the original on 2013-05-14. Retrieved 2013-05-19.
- "Lynching Statistics". Law2.umkc.edu. Archived from the original on 2013-03-28. Retrieved 2013-05-03.
- Wilkerson, Isabel. "Fresh Air Interview: Journalist Isabel Wilkerson – Exploring The Great African-American Migration". NPR.org. NPR. Archived from the original on 2013-05-02. Retrieved 2013-05-12.
- "Great Migration". Encyclopedia.chicagohistory.org. Archived from the original on 2013-05-18. Retrieved 2013-05-12.
- "Table 5. West Region – Race and Hispanic Origin: 1850 to 1990" (PDF). U.S. Census Bureau. September 13, 2002. Archived (PDF) from the original on 2013-01-20. Retrieved 2013-05-04.
- "Asian Americans". History-world.org. 1941-12-07. Archived from the original on 2011-05-27. Retrieved 2013-05-19.
{{cite web}}: CS1 maint: unfit URL (link) - "WebCite query result". www.webcitation.org. Archived from the original on 2020-08-03. Retrieved 2021-10-20.
{{cite web}}: Cite uses generic title (help) - "Hispanics in the United States, 1850–1990" (PDF). Archived (PDF) from the original on 2019-07-17. Retrieved 2018-08-17.
- Gratton, Brian; Gutmann, Myron (January 2006) [2006], Historical Statistics of the United States: Millennial Edition, vol. 1 (First ed.), Cambridge University Press, pp. 1–177 to 1–179
- "Historical Census Statistics on Population Totals By Race, 1790 to 1990, and By Hispanic Origin, 1970 to 1990, For The United States, Regions, Divisions, and States" (PDF). Census.gov. Archived (PDF) from the original on 2019-03-12. Retrieved 2013-04-20.
- "Overview of Race and Hispanic Origin: 2000". March 2001. Archived from the original (PDF) on 2020-02-12. Retrieved 2013-05-04.
- Humes, Karen; Nicholas Jones; Roberto Ramirez (March 2011). "Overview of Race and Hispanic Origin: 2010" (PDF). 2010 Census Briefs. U.S. Census Bureau. Archived from the original (PDF) on April 29, 2011. Retrieved May 15, 2013.
- "Facts on Latinos in America". September 18, 2017. Archived from the original on June 15, 2020. Retrieved June 21, 2020.
- "Native Americans in the Census, 1860–1890". Archives.gov. 2011-10-19. Archived from the original on 2013-05-08. Retrieved 2013-06-20.
- "Questions and Answers for Census 2000 Data on Race". Census.gov. Archived from the original on 2013-05-12. Retrieved 2013-05-17.
- "2020 Census Statistics Highlight Local Population Changes and Nation's Racial and Ethnic Diversity" (Press release). Washington, D.C.: U.S. Census Bureau. August 12, 2021. Archived from the original on 2021-08-28. Retrieved 2021-08-29.
- "How Has Our Nation's Population Changed?".
- "American FactFinder - Results". Archived from the original on 2020-02-12. Retrieved 2015-10-03.
- "Yearbook of Immigration Statistics | Homeland Security". Dhs.gov. 2017-11-14. Archived from the original on 2016-11-03. Retrieved 2018-08-17.
- William H. Frey, "The New Great Migration: Black Americans' Return to the South, 1965–2000", The Brookings Institution, May 2004, pp.1–5 "Archived copy" (PDF). Archived from the original (PDF) on April 28, 2008. Retrieved 2008-05-19.
{{cite web}}: CS1 maint: archived copy as title (link), accessed March 19, 2008 - "Historical Census Statistics on Population Totals By Race, 1790 to 1990, and By Hispanic Origin, 1970 to 1990, For The United States, Regions, Divisions, and States". Census.gov. Archived from the original on December 24, 2014. Retrieved September 15, 2012.
- "Powered by Google Docs". Archived from the original on December 21, 2013. Retrieved September 15, 2012.
- "Powered by Google Docs". Archived from the original on October 20, 2021. Retrieved September 15, 2012.
- "Race and Ethnicity in the United States: 2010 Census and 2020 Census". Census.gov. US Census Bureau. Archived from the original on 2021-08-15. Retrieved 2021-08-15.
- "Population Division Working Paper No. 56" (PDF). Archived (PDF) from the original on 2018-09-30. Retrieved 2018-08-17.
- US Bureau of the Census, Statistical Abstract of the United States: 1951 (1951) pp 14, 306 Archived 2016-03-04 at the Wayback Machine
- "Historical Census Statistics on Population Totals By Race, 1790 to 1990, and By Hispanic Origin, 1970 to 1990, For The United States, Regions, Divisions, and States". Census.gov. Archived from the original on August 12, 2012. Retrieved January 10, 2013.
- "The American Indian and Alaska Native Population: 2000" (PDF). Census.gov. Archived (PDF) from the original on January 20, 2013. Retrieved August 9, 2016.
- "State and County QuickFacts". Quickfacts.census.gov. February 20, 2013. Archived from the original on March 4, 2012. Retrieved June 16, 2013.
- "Historical Census Statistics on Population Totals By Race, 1790 to 1990, and By Hispanic Origin, 1970 to 1990, For The United States, Regions, Divisions, and States". Census.gov. Archived from the original on 2014-12-24. Retrieved 2012-09-15.
- "U.S. Census of Population: 1960" (PDF). Www2.census.gov. Archived (PDF) from the original on 2010-08-09. Retrieved 2012-09-30.
- "Powered by Google Docs". Archived from the original on 2013-12-21. Retrieved 2012-09-15.
- "Powered by Google Docs". Archived from the original on 2013-12-21. Retrieved 2012-09-15.
- "Historical Census Statistics on Population Totals By Race, 1790 to 1990, and By Hispanic Origin, 1970 to 1990, For The United States, Regions, Divisions, and States". Census.gov. Archived from the original on 2014-12-24. Retrieved 2013-01-10.
- "Archived copy" (PDF). Archived (PDF) from the original on 2010-06-01. Retrieved 2010-06-02.
{{cite web}}: CS1 maint: archived copy as title (link) - "Archived copy" (PDF). Archived (PDF) from the original on 2017-07-27. Retrieved 2017-05-10.
{{cite web}}: CS1 maint: archived copy as title (link) - "Archived copy" (PDF). Archived (PDF) from the original on 2017-09-17. Retrieved 2017-09-19.
{{cite web}}: CS1 maint: archived copy as title (link) - "2020 Census Demographic Data Map Viewer". August 15, 2021. Archived from the original on August 12, 2021. Retrieved August 15, 2021.
- "An Older and More Diverse Nation by Midcentury". U.S. Census Bureau. August 14, 2008. Archived from the original on July 24, 2010.
- "U.S. Census Bureau Projections Show a Slower Growing, Older, More Diverse Nation a Half Century from Now". U.S. Census Bureau. December 12, 2012. Archived from the original on December 24, 2017. Retrieved December 7, 2017.
- "Table 4. Projections of the Population by Sex, Race, and Hispanic Origin for the United States: 2015 to 2060. Middle Series". 2012 National Population Projections: Summary Tables. U.S. Census Bureau. May 2013. Archived from the original on May 3, 2013. Retrieved May 18, 2013.
- "Table 5. Percent Distribution of the Projected Population by Sex, Race, and Hispanic Origin for the United States: 2015 to 2060. Middle Series". 2012 National Population Projections: Summary Tables. U.S. Census Bureau. May 2013. Archived from the original on May 3, 2013. Retrieved May 18, 2013.
- "Table 6. Percent Distribution of the Projected Population by Race and Hispanic Origin for the United States: 2015 to 2060. Middle Series". 2012 National Population Projections: Summary Tables. U.S. Census Bureau. May 2013. Archived from the original on May 3, 2013. Retrieved May 18, 2013.
- Ahmad, Farida B. (2023). "Provisional Mortality Data — United States, 2022". MMWR. Morbidity and Mortality Weekly Report. 72. doi:10.15585/mmwr.mm7218a3. ISSN 0149-2195.
- "UNITED STATES OF AMERICA: historical demographical data of the whole country". POPULATION STATISTICS. Jan Lahmeyer. 2000-01-22. Archived from the original on 2019-07-23. Retrieved 2013-10-16.
- 1960 to 2011"United States – Death rate: Death rate, crude (per 1,000 people)". Index Mundi. IndexMundi. Archived from the original on 2021-01-13. Retrieved 2013-10-24.
- "Archived copy" (PDF). Archived (PDF) from the original on 2017-01-20. Retrieved 2017-09-09.
{{cite web}}: CS1 maint: archived copy as title (link) - "National Vital Statistics Reports. Births: Provisional Data for 2019" (PDF). Archived (PDF) from the original on 2021-01-29. Retrieved 2020-05-21.
- Population Estimates: Intercensal Estimates – U.S Census Bureau Archived 2013-10-01 at the Wayback Machine. Census.gov. Retrieved on 2013-07-24.
- "Deaths: Final Data for 2013" (PDF). Archived (PDF) from the original on 2016-05-31. Retrieved 2017-09-09.
- "Products – Data Briefs – Number 229 – December 2015". Cdc.gov. Archived from the original on 2018-08-17. Retrieved 2018-08-17.
- "American FactFinder - Results". Archived from the original on 2020-02-12. Retrieved 2019-10-10.
- "NVSS – Birth Data". www.cdc.gov. March 25, 2020. Archived from the original on October 12, 2019. Retrieved October 10, 2019.
- "Archived copy" (PDF). Archived (PDF) from the original on 2017-02-14. Retrieved 2017-09-09.
{{cite web}}: CS1 maint: archived copy as title (link) - "Archived copy" (PDF). Archived (PDF) from the original on 2016-05-31. Retrieved 2017-09-09.
{{cite web}}: CS1 maint: archived copy as title (link)