Sainte-Clotilde, Quebec
Sainte-Clotilde is a municipality in the Jardins de Napierville Regional County Municipality in Quebec, Canada, situated in the Montérégie administrative region. The population as of the Canada 2021 Census was 2,646.
Sainte-Clotilde | |
|---|---|
 | |
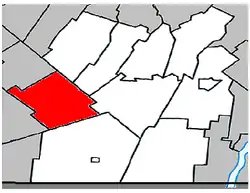 Location within Les Jardins-de-Napierville RCM. | |
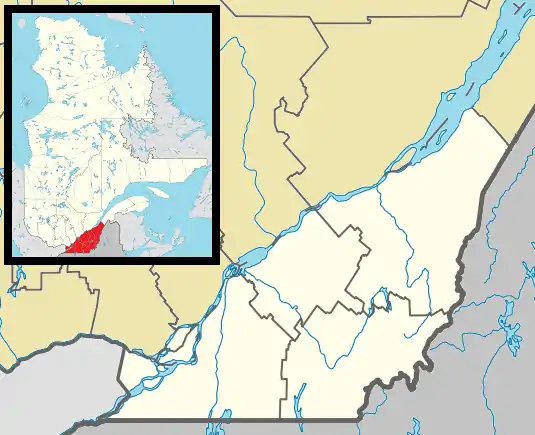 Sainte-Clotilde Location in southern Quebec. | |
| Coordinates: 45°09′N 73°41′W[1] | |
| Country | Canada |
| Province | Quebec |
| Region | Montérégie |
| RCM | Les Jardins-de-Napierville |
| Constituted | April 2, 1885 |
| Government | |
| • Mayor | Clément Lemieux |
| • Federal riding | Beauharnois—Salaberry |
| • Prov. riding | Huntingdon |
| Area | |
| • Total | 78.80 km2 (30.42 sq mi) |
| • Land | 78.21 km2 (30.20 sq mi) |
| Population (2021)[5] | |
| • Total | 2,646 |
| • Density | 33.8/km2 (88/sq mi) |
| • Pop 2016-2021 | |
| • Dwellings | 829 |
| Time zone | UTC−5 (EST) |
| • Summer (DST) | UTC−4 (EDT) |
| Postal code(s) | |
| Area code(s) | 450 and 579 |
| Highways | |
| Geocode | 68020 |
| Website | www |
Before February 6, 2010 it was known as Sainte-Clotilde-de-Châteauguay.[6]
Demographics
Population
Canada census – Sainte-Clotilde community profile
| 2021 | 2016 | 2011 | |
|---|---|---|---|
| Population | 2,646 (+63.1% from 2016) | 1,622 (-4.8% from 2011) | 1,704 (+6.0% from 2006) |
| Land area | 78.21 km2 (30.20 sq mi) | 78.39 km2 (30.27 sq mi) | 78.73 km2 (30.40 sq mi) |
| Population density | 33.8/km2 (88/sq mi) | 20.7/km2 (54/sq mi) | 21.6/km2 (56/sq mi) |
| Median age | 37.6 (M: 38, F: 37.2) | 41.6 (M: 41.4, F: 42.1) | 41.5 (M: 41.2, F: 42.0) |
| Private dwellings | 780 (total) | 704 (total) | 669 (total) |
| Median household income | $79,500 | $60,459 | $NA |
|
|
|
Language
| Canada Census Mother Tongue - Sainte-Clotilde, Quebec[12] | ||||||||||||||||||
|---|---|---|---|---|---|---|---|---|---|---|---|---|---|---|---|---|---|---|
| Census | Total | French |
English |
French & English |
Other | |||||||||||||
| Year | Responses | Count | Trend | Pop % | Count | Trend | Pop % | Count | Trend | Pop % | Count | Trend | Pop % | |||||
2021 |
2,645 |
2,420 | 91.5% | 75 | 2.8% | 65 | 2.5% | 80 | 3.0% | |||||||||
2016 |
1,625 |
1,500 | 92.3% | 55 | 3.4% | 10 | 0.6% | 55 | 3.4% | |||||||||
2011 |
1,700 |
1,445 | 85.0% | 65 | 3.8% | 10 | 0.6% | 180 | 10.6% | |||||||||
2006 |
1,610 |
1,455 | 90.4% | 35 | 2.2% | 10 | 0.6% | 110 | 6.8% | |||||||||
2001 |
1,540 |
1,375 | 89.3% | 95 | 6.2% | 0 | 0.0% | 70 | 4.5% | |||||||||
1996 |
1,595 |
1,515 | n/a | 95.0% | 50 | n/a | 3.1% | 15 | n/a | 0.9% | 15 | n/a | 0.9% | |||||
See also
References
- "Reference number 251292 in Banque de noms de lieux du Québec". toponymie.gouv.qc.ca (in French). Commission de toponymie du Québec.
- "Ministère des Affaires municipales, des Régions et de l'Occupation du territoire: Sainte-Clotilde". Archived from the original on 2011-08-06. Retrieved 2012-05-21.
- Riding history for Beauharnois—Salaberry, Quebec from the Library of Parliament
- "Data table, Census Profile, 2021 Census of Population - Sainte-Clotilde, Municipalité (MÉ) [Census subdivision], Quebec". 9 February 2022.
- "Data table, Census Profile, 2021 Census of Population - Sainte-Clotilde, Municipalité (MÉ) [Census subdivision], Quebec". 9 February 2022.
- http://www.stat.gouv.qc.ca/publications/referenc/pdf2010/modif_fev10.pdf%5B%5D
- "2021 Community Profiles". 2021 Canadian Census. Statistics Canada. February 4, 2022. Retrieved 2022-08-22.
- "2016 Community Profiles". 2016 Canadian Census. Statistics Canada. August 12, 2021. Retrieved 2022-06-23.
- "2011 Community Profiles". 2011 Canadian Census. Statistics Canada. March 21, 2019. Retrieved 2014-04-10.
- "2006 Community Profiles". 2006 Canadian Census. Statistics Canada. August 20, 2019.
- "2001 Community Profiles". 2001 Canadian Census. Statistics Canada. July 18, 2021.
- Statistics Canada: 1996, 2001, 2006, 2011, 2016, 2021 census
Adjacent Municipal Subdivisions | |
|---|---|
| Cities | |
|---|---|
| Municipalities | |
| Townships | |
| Villages | |
| |
This article is issued from Wikipedia. The text is licensed under Creative Commons - Attribution - Sharealike. Additional terms may apply for the media files.