San Jose de Buan
San Jose de Buan, officially the Municipality of San Jose de Buan (Waray: Bungto han San Jose de Buan; Tagalog: Bayan ng San Jose de Buan), is a 4th class municipality in the province of Samar, Philippines. According to the 2020 census, it has a population of 7,767 people.[3]
San Jose de Buan | |
|---|---|
| Municipality of San Jose de Buan | |
 Flag | |
| Nickname: Heart of Samar Island | |
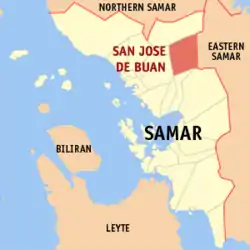 Map of Samar with San Jose de Buan highlighted | |
OpenStreetMap | |
.svg.png.webp) San Jose de Buan Location within the Philippines | |
| Coordinates: 12°03′18″N 125°01′38″E | |
| Country | Philippines |
| Region | Eastern Visayas |
| Province | Samar |
| District | 2nd district |
| Barangays | 14 (see Barangays) |
| Government | |
| • Type | Sangguniang Bayan |
| • Mayor | Joaquin R. Elizalde |
| • Vice Mayor | Wilson F. Orcino |
| • Representative | Reynolds Michael Tan |
| • Councilors | List |
| • Electorate | 6,377 voters (2022) |
| Area | |
| • Total | 366.90 km2 (141.66 sq mi) |
| Elevation | 304 m (997 ft) |
| Highest elevation | 815 m (2,674 ft) |
| Lowest elevation | 121 m (397 ft) |
| Population (2020 census)[3] | |
| • Total | 7,767 |
| • Density | 21/km2 (55/sq mi) |
| • Households | 1,675 |
| Economy | |
| • Income class | 4th municipal income class |
| • Poverty incidence | 38.77 |
| • Revenue | ₱ 124.6 million (2020) |
| • Assets | ₱ 271.6 million (2020) |
| • Expenditure | ₱ 91.97 million (2020) |
| • Liabilities | ₱ 72.56 million (2020) |
| Service provider | |
| • Electricity | Samar 2 Electric Cooperative (SAMELCO 2) |
| Time zone | UTC+8 (PST) |
| ZIP code | 6714 |
| PSGC | |
| IDD : area code | +63 (0)55 |
| Native languages | Waray Tagalog |
San Jose de Buan was a municipal District Gandara from 1948 to 1969, when it was converted into a municipality.
Geography
San Jose de Buan is an Elevated Municipality, it is by and at the Huraw Mountain Ranges. The river or creek from this town is the upstream of Popular Blanca Aurora Falls it is at the left tributary creek/river. It is the only river that contribute west of Huraw, other tributary rivers are going East of Samar to the Pacific Ocean.
Barangays
San Jose de Buan is politically subdivided into 14 barangays. Each barangay consists of puroks and some have sitios.
Climate
| Climate data for San Jose de Buan, Samar | |||||||||||||
|---|---|---|---|---|---|---|---|---|---|---|---|---|---|
| Month | Jan | Feb | Mar | Apr | May | Jun | Jul | Aug | Sep | Oct | Nov | Dec | Year |
| Average high °C (°F) | 26 (79) |
27 (81) |
27 (81) |
29 (84) |
29 (84) |
29 (84) |
28 (82) |
29 (84) |
28 (82) |
28 (82) |
28 (82) |
27 (81) |
28 (82) |
| Average low °C (°F) | 21 (70) |
21 (70) |
21 (70) |
22 (72) |
23 (73) |
23 (73) |
23 (73) |
23 (73) |
23 (73) |
23 (73) |
22 (72) |
22 (72) |
22 (72) |
| Average precipitation mm (inches) | 97 (3.8) |
64 (2.5) |
69 (2.7) |
58 (2.3) |
98 (3.9) |
161 (6.3) |
167 (6.6) |
140 (5.5) |
158 (6.2) |
171 (6.7) |
169 (6.7) |
154 (6.1) |
1,506 (59.3) |
| Average rainy days | 17.1 | 13.4 | 14.8 | 15.2 | 21.1 | 25.2 | 26.8 | 25.4 | 25.5 | 26.5 | 23.0 | 20.3 | 254.3 |
| Source: Meteoblue[5] | |||||||||||||
Demographics
| Year | Pop. | ±% p.a. |
|---|---|---|
| 1918 | 382 | — |
| 1939 | 633 | +2.43% |
| 1948 | 646 | +0.23% |
| 1960 | 1,372 | +6.48% |
| 1970 | 2,530 | +6.30% |
| 1975 | 3,250 | +5.15% |
| 1980 | 5,455 | +10.91% |
| 1990 | 4,217 | −2.54% |
| 1995 | 5,471 | +5.00% |
| 2000 | 6,438 | +3.55% |
| 2007 | 6,814 | +0.79% |
| 2010 | 6,563 | −1.36% |
| 2015 | 7,769 | +3.26% |
| 2020 | 7,767 | −0.01% |
| Source: Philippine Statistics Authority[6][7][8][9] | ||
Infrastructure
Education
Tourism
Economy
References
- Municipality of San Jose de Buan | (DILG)
- "2015 Census of Population, Report No. 3 – Population, Land Area, and Population Density" (PDF). Philippine Statistics Authority. Quezon City, Philippines. August 2016. ISSN 0117-1453. Archived (PDF) from the original on May 25, 2021. Retrieved July 16, 2021.
- Census of Population (2020). "Region VIII (Eastern Visayas)". Total Population by Province, City, Municipality and Barangay. Philippine Statistics Authority. Retrieved 8 July 2021.
- "PSA Releases the 2018 Municipal and City Level Poverty Estimates". Philippine Statistics Authority. 15 December 2021. Retrieved 22 January 2022.
- "San Jose de Buan: Average Temperatures and Rainfall". Meteoblue. Retrieved 29 February 2020.
- Census of Population (2015). "Region VIII (Eastern Visayas)". Total Population by Province, City, Municipality and Barangay. Philippine Statistics Authority. Retrieved 20 June 2016.
- Census of Population and Housing (2010). "Region VIII (Eastern Visayas)" (PDF). Total Population by Province, City, Municipality and Barangay. National Statistics Office. Retrieved 29 June 2016.
- Censuses of Population (1903–2007). "Region VIII (Eastern Visayas)". Table 1. Population Enumerated in Various Censuses by Province/Highly Urbanized City: 1903 to 2007. National Statistics Office.
- "Province of Samar (Western Samar)". Municipality Population Data. Local Water Utilities Administration Research Division. Retrieved 17 December 2016.
- "Poverty incidence (PI):". Philippine Statistics Authority. Retrieved December 28, 2020.
- "Estimation of Local Poverty in the Philippines" (PDF). Philippine Statistics Authority. 29 November 2005.
- "2003 City and Municipal Level Poverty Estimates" (PDF). Philippine Statistics Authority. 23 March 2009.
- "City and Municipal Level Poverty Estimates; 2006 and 2009" (PDF). Philippine Statistics Authority. 3 August 2012.
- "2012 Municipal and City Level Poverty Estimates" (PDF). Philippine Statistics Authority. 31 May 2016.
- "Municipal and City Level Small Area Poverty Estimates; 2009, 2012 and 2015". Philippine Statistics Authority. 10 July 2019.
- "PSA Releases the 2018 Municipal and City Level Poverty Estimates". Philippine Statistics Authority. 15 December 2021. Retrieved 22 January 2022.
External links
- San Jose de Buan Profile at PhilAtlas.com
- Philippine Standard Geographic Code
- Philippine Census Information
- Local Governance Performance Management System
Places adjacent to San Jose de Buan | ||||||||||||||||
|---|---|---|---|---|---|---|---|---|---|---|---|---|---|---|---|---|
| ||||||||||||||||
| Municipalities | |
|---|---|
| Component cities | |