Santo Niño, Samar
Santo Niño, officially the Municipality of Santo Niño (Cebuano: Lungsod sa Santo Niño; Waray: Bungto han Santo Niño; Tagalog: Bayan ng Santo Niño), is a 5th class municipality in the province of Samar, Philippines. According to the 2020 census, it has a population of 12,519 people.[3]
Santo Niño | |
|---|---|
| Municipality of Santo Niño | |
 Flag | |
 Map of Samar with Santo Niño highlighted | |
OpenStreetMap | |
.svg.png.webp) Santo Niño Location within the Philippines | |
| Coordinates: 11°55′35″N 124°26′57″E | |
| Country | Philippines |
| Region | Eastern Visayas |
| Province | Samar |
| District | 1st district |
| Barangays | 13 (see Barangays) |
| Government | |
| • Type | Sangguniang Bayan |
| • Mayor | Marinell A. Apolonio |
| • Vice Mayor | Lilia A. Coñejos |
| • Representative | Stephen James Tan |
| • Electorate | 11,275 voters (2022) |
| Area | |
| • Total | 29.53 km2 (11.40 sq mi) |
| Elevation | 10 m (30 ft) |
| Highest elevation | 899 m (2,949 ft) |
| Lowest elevation | 0 m (0 ft) |
| Population (2020 census)[3] | |
| • Total | 12,519 |
| • Density | 420/km2 (1,100/sq mi) |
| • Households | 3,029 |
| Economy | |
| • Income class | 5th municipal income class |
| • Poverty incidence | 30.68 |
| • Revenue | ₱ 68.15 million (2020) |
| • Assets | ₱ 281.5 million (2020) |
| • Expenditure | ₱ 62.56 million (2020) |
| • Liabilities | ₱ 65.89 million (2020) |
| Service provider | |
| • Electricity | Samar 1 Electric Cooperative (SAMELCO 1) |
| Time zone | UTC+8 (PST) |
| ZIP code | 6712 |
| PSGC | |
| IDD : area code | +63 (0)55 |
| Native languages | Cebuano Waray Tagalog |
Formerly known as Limbancauayan, it consists of the northern island of Camandag and the larger Santo Niño Island about 3.1 kilometers (1.9 mi) to the south. In between those two islands is the smaller Pilar Island.[5] The municipality's poblacion (town center) is located in Santo Niño Island.
History
This town has an ancient Bisayan name Limbankawayan which derived from the word limba meaning red and kawayan means bamboo thus a red colored bamboo (phyllostachys iridescens) which is abundant during those days.
It was separated from Calbayog and made a pueblo and a parish by a Royal Decree of September 29, 1898. The Bishop of Cebu had recommended in 1895 that it achieve parish status, though final approval and confirmation was not relayed from Madrid through Manila until the year 1897.
Geography
The islands are located in the Samar Sea about 24 kilometers (15 mi) south-west of Calbayog on the main island of Samar.
Santo Niño Island
The larger Santo Niño Island is about 18 kilometers (11 mi) north-west of Maripipi, Biliran province with an area of about 19.4 square kilometers (7.5 sq mi). Both islands are volcanic in origin with Santo Niño having the highest elevation in the municipality at 470 meters (1,540 ft).[6] [7]
Camandag Island
The circular Camandag Island is located north of Santo Niño Island, about 3.1 kilometers (1.9 mi) shore to shore. It has area of about 9.8 square kilometers (3.8 sq mi) with an elevation of 429 meters (1,407 ft).[6][8]
- Balatguti
- Corocawayan
- Lobelobe
- Pinanangnan (JMBere Coco+Cacao Farms)
- Sevilla
- Villahermosa
Pilar Island
The smallest island of the municipality is located 2.3 kilometers (1.4 mi) off north-west of Santo Niño Island and about 3.5 kilometers (2.2 mi) south-west of Camandag Island. Pilar Island has an elevation of 145 feet (44 m).[9]
Barangays
Santo Niño is politically subdivided into 13 barangays. Each barangay consists of puroks and some have sitios.
Climate
| Climate data for Santo Niño, Samar | |||||||||||||
|---|---|---|---|---|---|---|---|---|---|---|---|---|---|
| Month | Jan | Feb | Mar | Apr | May | Jun | Jul | Aug | Sep | Oct | Nov | Dec | Year |
| Average high °C (°F) | 28 (82) |
29 (84) |
29 (84) |
31 (88) |
31 (88) |
30 (86) |
29 (84) |
29 (84) |
29 (84) |
29 (84) |
29 (84) |
28 (82) |
29 (85) |
| Average low °C (°F) | 21 (70) |
21 (70) |
21 (70) |
22 (72) |
24 (75) |
24 (75) |
24 (75) |
25 (77) |
24 (75) |
24 (75) |
23 (73) |
22 (72) |
23 (73) |
| Average precipitation mm (inches) | 72 (2.8) |
52 (2.0) |
65 (2.6) |
62 (2.4) |
87 (3.4) |
129 (5.1) |
153 (6.0) |
124 (4.9) |
147 (5.8) |
157 (6.2) |
139 (5.5) |
117 (4.6) |
1,304 (51.3) |
| Average rainy days | 17.4 | 13.4 | 16.8 | 18.0 | 22.0 | 25.3 | 26.2 | 24.2 | 24.9 | 26.0 | 23.3 | 20.8 | 258.3 |
| Source: Meteoblue[10] | |||||||||||||
Demographics
| Year | Pop. | ±% p.a. |
|---|---|---|
| 1903 | 3,372 | — |
| 1918 | 3,833 | +0.86% |
| 1939 | 4,926 | +1.20% |
| 1948 | 6,003 | +2.22% |
| 1960 | 8,304 | +2.74% |
| 1970 | 9,086 | +0.90% |
| 1975 | 11,124 | +4.14% |
| 1980 | 11,132 | +0.01% |
| 1990 | 11,743 | +0.54% |
| 1995 | 12,761 | +1.57% |
| 2000 | 12,545 | −0.37% |
| 2007 | 12,777 | +0.25% |
| 2010 | 13,504 | +2.03% |
| 2015 | 12,863 | −0.92% |
| 2020 | 12,519 | −0.53% |
| Source: Philippine Statistics Authority [11][12][13][14] | ||
Economy
Transportation
There are no airports on the islands of Santo Niño and Camandag. The islands are reached by boats from the Port of Calbayog.[7]
See also
References
- Municipality of Santo Niño | (DILG)
- "2015 Census of Population, Report No. 3 – Population, Land Area, and Population Density" (PDF). Philippine Statistics Authority. Quezon City, Philippines. August 2016. ISSN 0117-1453. Archived (PDF) from the original on May 25, 2021. Retrieved July 16, 2021.
- Census of Population (2020). "Region VIII (Eastern Visayas)". Total Population by Province, City, Municipality and Barangay. Philippine Statistics Authority. Retrieved 8 July 2021.
- "PSA Releases the 2018 Municipal and City Level Poverty Estimates". Philippine Statistics Authority. 15 December 2021. Retrieved 22 January 2022.
- "Pilar Island, Santo Niño, Philippines". Google Maps. Retrieved on 2013-11-10.
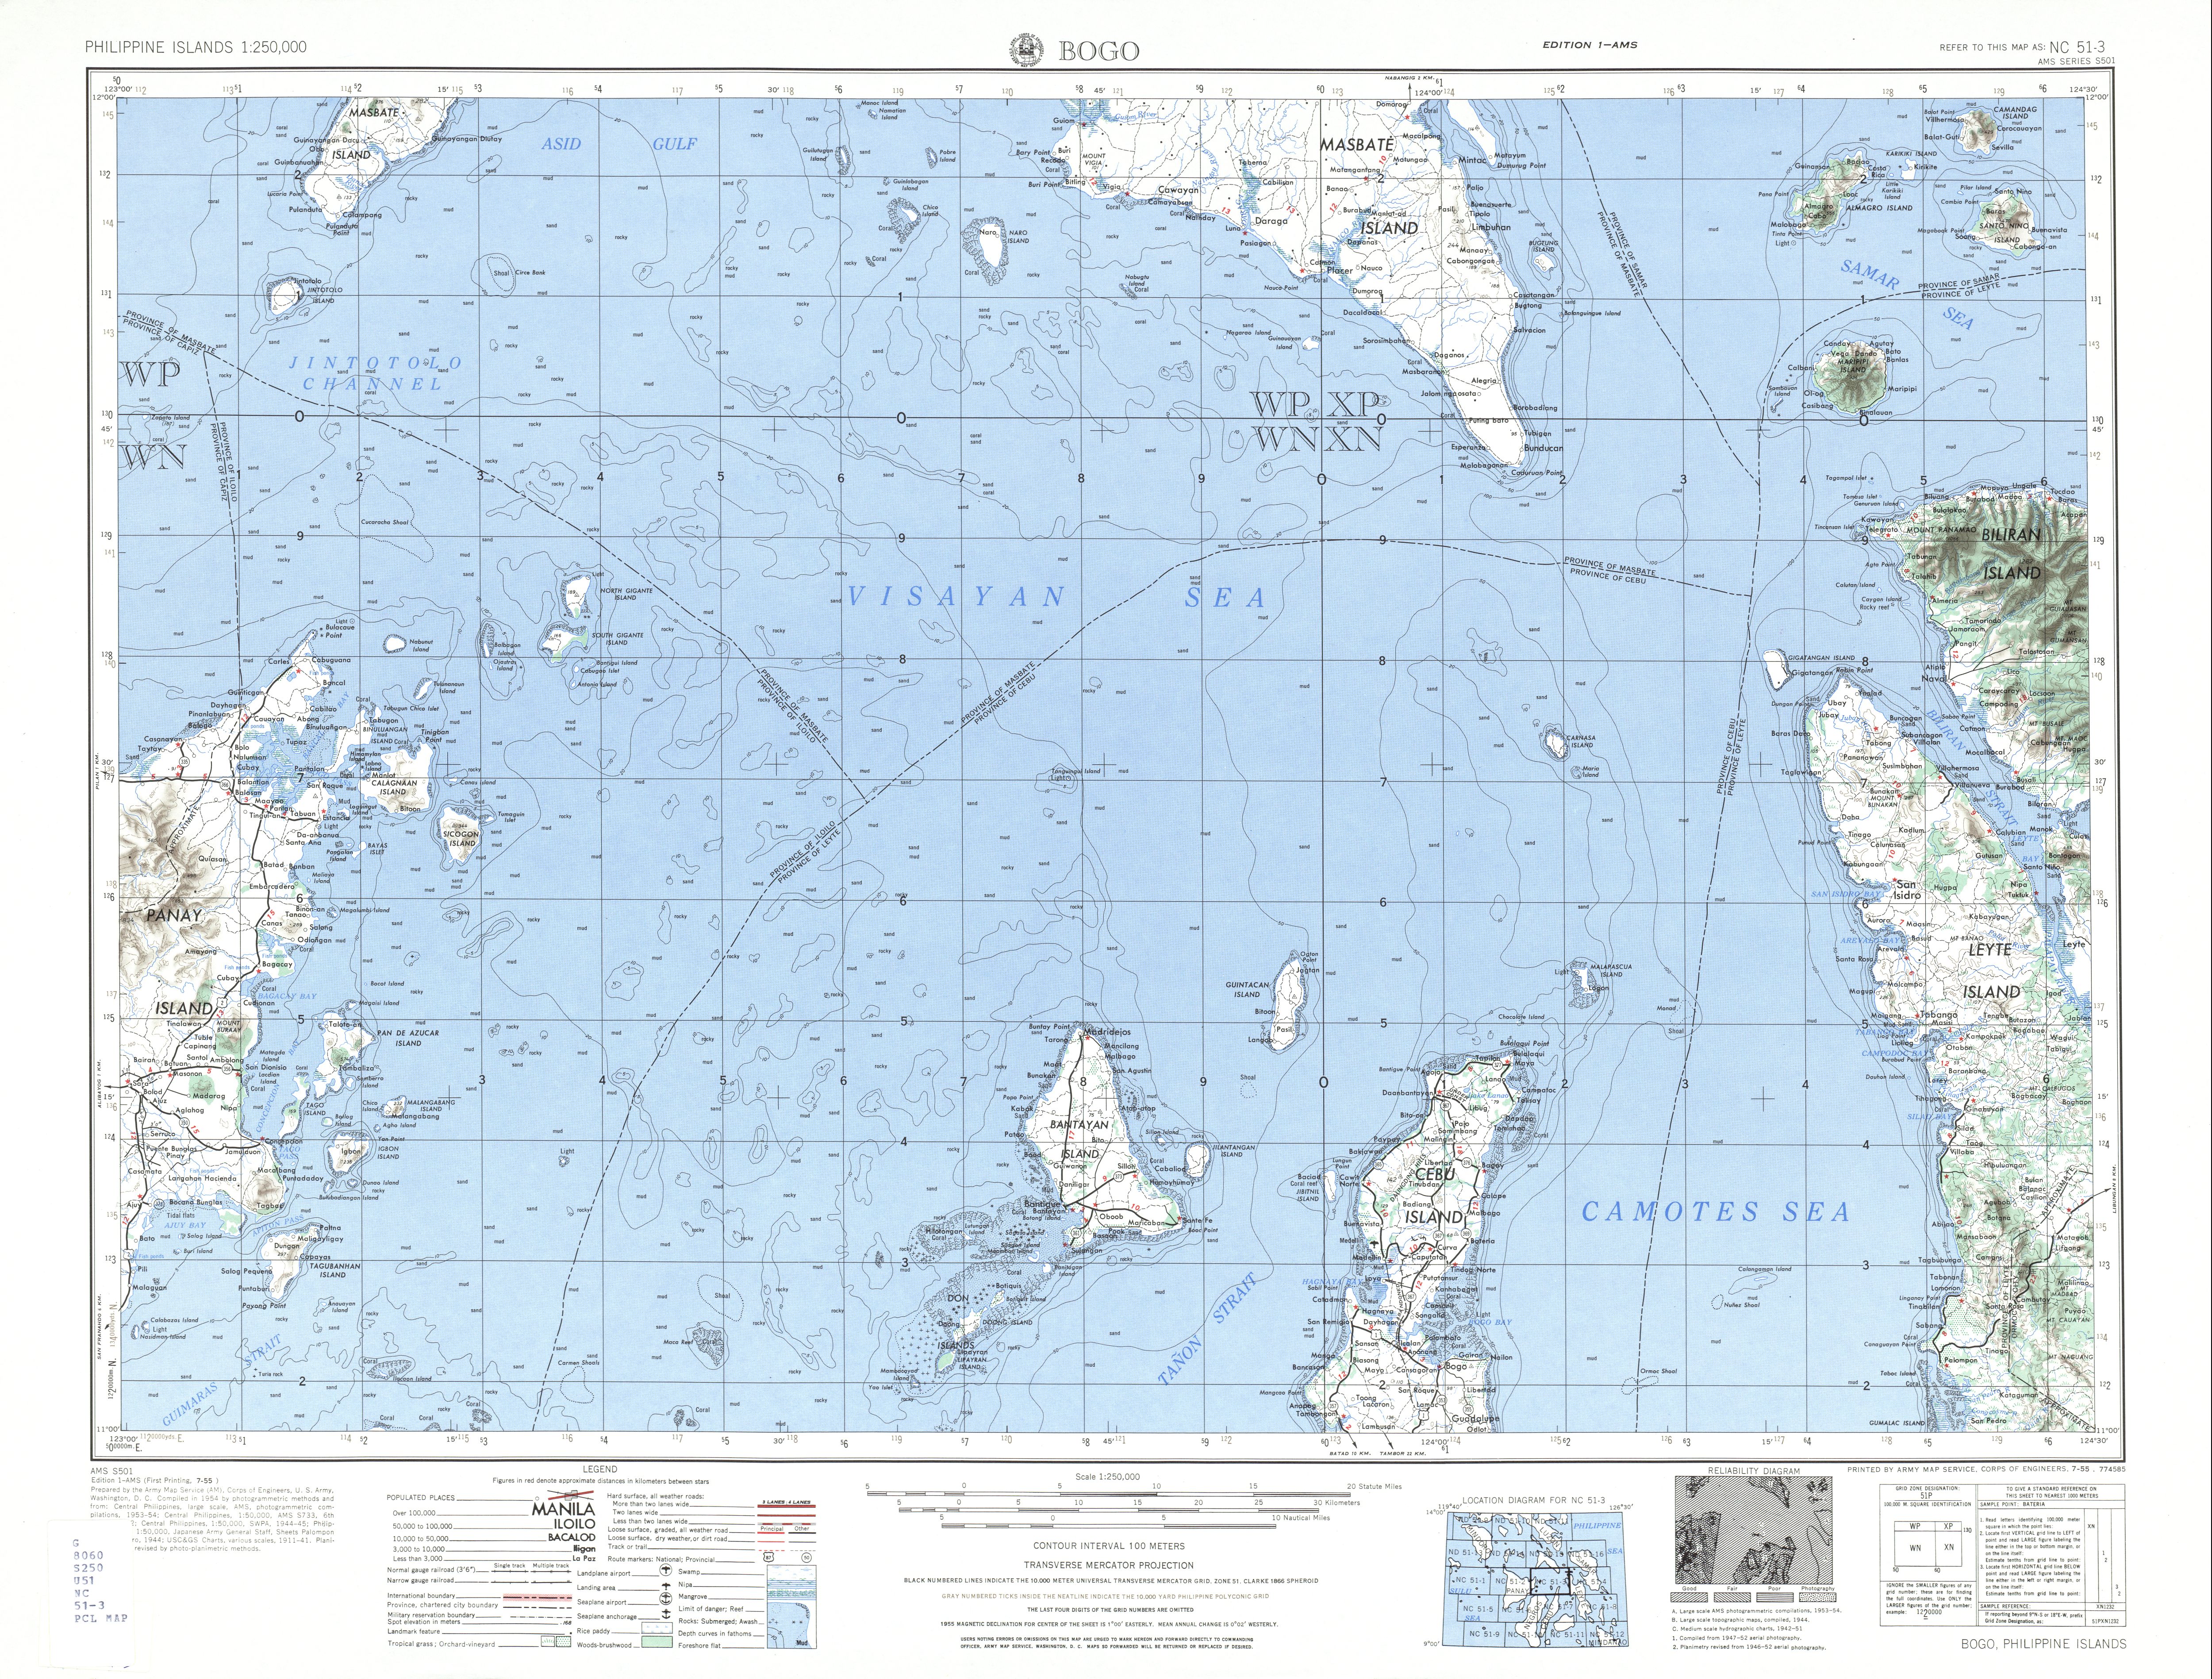
- U.S. Army Corps of Engineer (1954). "Bogo (topographical map)". University of Austin Library. Retrieved on 2013-11-11.
- Fabian, Galwin (2013-09-21). "Santo Niño Island in Samar". Intrepid Wanderer. Retrieved on 2013-11-11.
- Fabian, Galwin (2013-09-19). "Camandag Island in Samar". Intrepid Wanderer. Retrieved on 2013-11-11.
- U.S. Coast and Geodetic Survey (1919). "United States Coast Pilot, Philippine Islands, Part 1", pg. 205. Government Printing Office, Washington.
- "Santo Niño: Average Temperatures and Rainfall". Meteoblue. Retrieved 29 February 2020.
- Census of Population (2015). "Region VIII (Eastern Visayas)". Total Population by Province, City, Municipality and Barangay. Philippine Statistics Authority. Retrieved 20 June 2016.
- Census of Population and Housing (2010). "Region VIII (Eastern Visayas)" (PDF). Total Population by Province, City, Municipality and Barangay. National Statistics Office. Retrieved 29 June 2016.
- Censuses of Population (1903–2007). "Region VIII (Eastern Visayas)". Table 1. Population Enumerated in Various Censuses by Province/Highly Urbanized City: 1903 to 2007. National Statistics Office.
- "Province of Samar (Western Samar)". Municipality Population Data. Local Water Utilities Administration Research Division. Retrieved 17 December 2016.
- "Poverty incidence (PI):". Philippine Statistics Authority. Retrieved December 28, 2020.
- "Estimation of Local Poverty in the Philippines" (PDF). Philippine Statistics Authority. 29 November 2005.
- "2003 City and Municipal Level Poverty Estimates" (PDF). Philippine Statistics Authority. 23 March 2009.
- "City and Municipal Level Poverty Estimates; 2006 and 2009" (PDF). Philippine Statistics Authority. 3 August 2012.
- "2012 Municipal and City Level Poverty Estimates" (PDF). Philippine Statistics Authority. 31 May 2016.
- "Municipal and City Level Small Area Poverty Estimates; 2009, 2012 and 2015". Philippine Statistics Authority. 10 July 2019.
- "PSA Releases the 2018 Municipal and City Level Poverty Estimates". Philippine Statistics Authority. 15 December 2021. Retrieved 22 January 2022.
External links
- Santo Niño Profile at PhilAtlas.com
- Philippine Standard Geographic Code
- Philippine Census Information
- Local Governance Performance Management System
Places adjacent to Santo Niño, Samar | |
|---|---|
| Municipalities | |
|---|---|
| Component cities | |