St. Norbert (electoral district)
St. Norbert is a former provincial electoral division in the Canadian province of Manitoba.
 | |
| Defunct provincial electoral district | |
| Legislature | Legislative Assembly of Manitoba |
| District created | 1979 |
| First contested | 1981 |
| Last contested | 2016 |
Historical riding
The original riding of St. Norbert was established at the time of the province's creation in 1870. For the 1870 provincial election, it was divided into two separate ridings: St. Norbert North and St. Norbert South. Subsequently, it was reduced to a single riding.
St. Norbert was a francophone-majority riding. It was eliminated in 1879, at a time when francophone representation in the province was being reduced.
List of provincial representatives (St. Norbert North)
| Name | Party | Took office | Left office |
|---|---|---|---|
| Joseph Lemay | Government/French Party | 1870 | 1874 |
List of provincial representatives (St. Norbert South)
| Name | Party | Took office | Left office |
|---|---|---|---|
| Pierre Delorme | Government/French Party | 1870 | 1874 |
List of provincial representatives (St. Norbert)
| Name | Party | Took office | Left office |
|---|---|---|---|
| Joseph Dubuc | Government/French Party | 1874 | 1878 |
| Pierre Delorme | Government/French Party | 1878 | 1879 |
| Pierre Delorme | Opposition/French Party | 1879 | 1879 |
Most recent riding
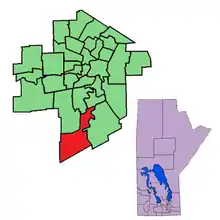
It was recreated by redistribution in 1979, and was contested at the 1981 Manitoba general election. It was abolished at the redistribution of 2018 and ceased to exist under its old name effective at the 2019 Manitoba general election. The riding was located in the southernmost tip of the City of Winnipeg.
St. Norbert was bordered to the east by Seine River, to the south and west by the rural ridings of Dawson Trail and Morris (respectively), and to the north by Riel, Fort Garry (later Fort Richmond) and Fort Whyte. The riding's character is suburban.
St. Norbert's population in 1996 was 19,184. In 1999, the average family income was $59,444, and the unemployment rate was 8.20%. The riding is ethnically diverse: 5% of the riding's residents are German, 4% are Chinese, 3% are East Indian and 2% are Italian. Six per cent of the riding's residents are francophone. Almost 28% of the riding's residents have a university degree.
The service sector accounts for 16% of St. Norbert's industry, with a further 15% in the educational services.
List of provincial representatives
| Name | Party | Took office | Left office |
|---|---|---|---|
| Gerry Mercier | PC | 1981 | 1988 |
| John Angus | Lib | 1988 | 1990 |
| Marcel Laurendeau | PC | 1990 | 2003 |
| Marilyn Brick | NDP | 2003 | 2011 |
| Dave Gaudreau | NDP | 2011 | 2016 |
| Jon Reyes | PC | 2016 | 2019 |
Electoral results
1870 general election St. Norbert North
| 1870 Manitoba general election | ||||||||
|---|---|---|---|---|---|---|---|---|
| Party | Candidate | Votes | % | |||||
| Government | Joseph Lemay | 35 | 79.55% | |||||
| Undeclared | Joseph Genthan | 9 | 20.45% | |||||
| Total | 44 | – | ||||||
| Rejected | N/A | – | ||||||
| Eligible voters / Turnout | N/A | – | ||||||
Source(s)
Source: Manitoba. Chief Electoral Officer (1999). Statement of Votes for the 37th Provincial General Election, September 21, 1999 (PDF) (Report). Winnipeg: Elections Manitoba. | ||||||||
1870 general election St. Norbert South
| 1870 Manitoba general election | ||||||||
|---|---|---|---|---|---|---|---|---|
| Party | Candidate | Votes | % | |||||
| Government | Pierre Delorme | 50 | 69.44% | |||||
| Undeclared | Joseph Hamelin | 22 | 30.56% | |||||
| Total | 72 | – | ||||||
| Rejected | N/A | – | ||||||
| Eligible voters / Turnout | N/A | – | ||||||
Source(s)
Source: Manitoba. Chief Electoral Officer (1999). Statement of Votes for the 37th Provincial General Election, September 21, 1999 (PDF) (Report). Winnipeg: Elections Manitoba. | ||||||||
1874 general election
| 1874 Manitoba general election | ||||||||
|---|---|---|---|---|---|---|---|---|
| Party | Candidate | Votes | % | |||||
| Government | Joseph Dubuc | 51 | 62.20% | |||||
| Undeclared | Pierre Delorme | 31 | 37.80% | |||||
| Total | 82 | – | ||||||
| Rejected | N/A | – | ||||||
| Eligible voters / Turnout | 115 | 71.30% | ||||||
Source(s)
Source: Manitoba. Chief Electoral Officer (1999). Statement of Votes for the 37th Provincial General Election, September 21, 2000 (PDF) (Report). Winnipeg: Elections Manitoba. | ||||||||
1878 general election
| 1878 Manitoba general election | ||||||||
|---|---|---|---|---|---|---|---|---|
| Party | Candidate | Votes | % | ±% | ||||
| Government | Pierre Delorme | Acclaimed | – | – | ||||
| Total | – | – | ||||||
| Rejected | N/A | – | ||||||
| Eligible voters / Turnout | 168 | – | – | |||||
Source(s)
Source: Manitoba. Chief Electoral Officer (1999). Statement of Votes for the 37th Provincial General Election, September 21, 2004 (PDF) (Report). Winnipeg: Elections Manitoba. | ||||||||
1879 by-election
| Manitoba provincial by-election, 1879 | ||||||||
|---|---|---|---|---|---|---|---|---|
| Party | Candidate | Votes | % | ±% | ||||
| Unknown | Pierre Delorme | Acclaimed | – | – | ||||
| Total | – | – | ||||||
| Rejected | N/A | – | ||||||
| Eligible voters / Turnout | N/A | – | – | |||||
Source(s)
Source: Manitoba. Chief Electoral Officer (1999). Statement of Votes for the 37th Provincial General Election, September 21, 2005 (PDF) (Report). Winnipeg: Elections Manitoba. | ||||||||
1981 general election
| 1981 Manitoba general election | ||||||||
|---|---|---|---|---|---|---|---|---|
| Party | Candidate | Votes | % | ±% | ||||
| Progressive Conservative | Gerry Mercier | 5,728 | 53.90% | – | ||||
| New Democratic | Ruth Pear | 3,826 | 36.00% | – | ||||
| Liberal | Grant Temple | 857 | 8.06% | – | ||||
| Progressive | Allan Yap | 216 | 2.03% | – | ||||
| Total | 10,627 | – | – | |||||
| Rejected | 20 | – | ||||||
| Eligible voters / Turnout | 14,409 | 73.75% | – | |||||
Source(s)
Source: Manitoba. Chief Electoral Officer (1999). Statement of Votes for the 37th Provincial General Election, September 21, 2081 (PDF) (Report). Winnipeg: Elections Manitoba. | ||||||||
1986 general election
| 1986 Manitoba general election | ||||||||
|---|---|---|---|---|---|---|---|---|
| Party | Candidate | Votes | % | ±% | ||||
| Progressive Conservative | Gerry Mercier | 5,788 | 50.72% | -3.18% | ||||
| New Democratic | Ruth Pear | 2,839 | 24.88% | -11.12% | ||||
| Liberal | Mark O’Neill | 2,784 | 24.40% | 16.33% | ||||
| Total | 11,411 | – | – | |||||
| Rejected | 15 | – | ||||||
| Eligible voters / Turnout | 16,589 | 68.79% | -4.97% | |||||
Source(s)
Source: Manitoba. Chief Electoral Officer (1999). Statement of Votes for the 37th Provincial General Election, September 21, 2084 (PDF) (Report). Winnipeg: Elections Manitoba. | ||||||||
1988 general election
| 1988 Manitoba general election | ||||||||
|---|---|---|---|---|---|---|---|---|
| Party | Candidate | Votes | % | ±% | ||||
| Liberal | John Angus | 6,073 | 45.91% | 21.51% | ||||
| Progressive Conservative | Gerry Mercier | 5,695 | 43.05% | -7.67% | ||||
| New Democratic | Bennetta Benson | 1,460 | 11.04% | -13.84% | ||||
| Total | 13,228 | – | – | |||||
| Rejected | 36 | – | ||||||
| Eligible voters / Turnout | 17,237 | 76.74% | 7.96% | |||||
Source(s)
Source: Manitoba. Chief Electoral Officer (1999). Statement of Votes for the 37th Provincial General Election, September 21, 2085 (PDF) (Report). Winnipeg: Elections Manitoba. | ||||||||
1990 general election
| 1990 Manitoba general election | ||||||||
|---|---|---|---|---|---|---|---|---|
| Party | Candidate | Votes | % | ±% | ||||
| Progressive Conservative | Marcel Laurendeau | 4,502 | 45.48% | 2.43% | ||||
| Liberal | John Angus | 4,385 | 44.30% | -1.61% | ||||
| New Democratic | Andrew Sawatsky | 1,011 | 10.21% | -0.82% | ||||
| Total | 9,898 | – | – | |||||
| Rejected | 29 | – | ||||||
| Eligible voters / Turnout | 13,501 | 73.31% | -3.43% | |||||
Source(s)
Source: Manitoba. Chief Electoral Officer (1999). Statement of Votes for the 37th Provincial General Election, September 21, 2086 (PDF) (Report). Winnipeg: Elections Manitoba. | ||||||||
1995 general election
| 1995 Manitoba general election | ||||||||
|---|---|---|---|---|---|---|---|---|
| Party | Candidate | Votes | % | ±% | ||||
| Progressive Conservative | Marcel Laurendeau | 4,699 | 43.90% | -1.58% | ||||
| Liberal | Val Thompson | 4,172 | 38.98% | -5.33% | ||||
| New Democratic | Pat Peters | 1,833 | 17.12% | 6.91% | ||||
| Total | 10,704 | – | – | |||||
| Rejected | 55 | – | ||||||
| Eligible voters / Turnout | 14,971 | 71.50% | -1.81% | |||||
Source(s)
Source: Manitoba. Chief Electoral Officer (1999). Statement of Votes for the 37th Provincial General Election, September 21, 2089 (PDF) (Report). Winnipeg: Elections Manitoba. | ||||||||
1999 general election
| 1999 Manitoba general election | ||||||||
|---|---|---|---|---|---|---|---|---|
| Party | Candidate | Votes | % | ±% | Expenditures | |||
| Progressive Conservative | Marcel Laurendeau | 4,152 | 46.14 | +2.24 | $26,724.22 | |||
| New Democratic | Marilyn Brick | 3,483 | 38.69 | +21.57 | $10,804.00 | |||
| Liberal | Mohinder Dhillon | 1,313 | 14.59 | -25.39 | $17,998.46 | |||
| Total valid votes | 8,947 | – | – | |||||
| Rejected and declined votes | 52 | – | – | |||||
| Turnout | 8,999 | 72.96 | 0.76% | |||||
| Registered voters | 12,380 | – | – | |||||
Source(s)
Source: Manitoba. Chief Electoral Officer (1999). Statement of Votes for the 37th Provincial General Election, September 21, 2092 (PDF) (Report). Winnipeg: Elections Manitoba. | ||||||||
2003 general election
| 2003 Manitoba general election | ||||||||
|---|---|---|---|---|---|---|---|---|
| Party | Candidate | Votes | % | ±% | Expenditures | |||
| New Democratic | Marilyn Brick | 3,355 | 48.68 | +7.99 | $12,670.25 | |||
| Progressive Conservative | Marcel Laurendeau | 2,610 | 37.87 | −8.27 | $24,397.23 | |||
| Liberal | Jocelyn Greenwood | 741 | 10.75 | −3.84 | $8,473.22 | |||
| Green | Keith Barber | 186 | 2.70 | +2.70 | $117.06 | |||
| Total valid votes | 6,892 | – | – | |||||
| Rejected | 28 | – | – | |||||
| Eligible voters / turnout | 11,911 | 57.86 | −14.40 | |||||
Source(s)
Source: Manitoba. Chief Electoral Officer (2003). Statement of Votes for the 38th Provincial General Election, June 3, 2003 (PDF) (Report). Winnipeg: Elections Manitoba. | ||||||||
2007 general election
| 2007 Manitoba general election | ||||||||
|---|---|---|---|---|---|---|---|---|
| Party | Candidate | Votes | % | ±% | Expenditures | |||
| New Democratic | Marilyn Brick | 4,044 | 53.74 | +9.08 | $18,993.62 | |||
| Progressive Conservative | Tara Brousseau | 2,404 | 31.94 | −5.93 | $28,159.72 | |||
| Liberal | Wendy Bloomfield | 1,077 | 14.31 | +3.58 | $19,690.78 | |||
| Total | 7,525 | – | – | |||||
| Rejected | 29 | – | – | |||||
| Eligible voters / turnout | 11,552 | 65.14 | +7.28 | |||||
Source(s)
Source: Manitoba. Chief Electoral Officer (2007). Statement of Votes for the 39th Provincial General Election, May 22, 2007 (PDF) (Report). Winnipeg: Elections Manitoba. | ||||||||
2011 general election
| 2011 Manitoba general election | ||||||||
|---|---|---|---|---|---|---|---|---|
| Party | Candidate | Votes | % | ±% | Expenditures | |||
| New Democratic | Dave Gaudreau | 3,966 | 45.15 | -8.59 | $25,959.60 | |||
| Progressive Conservative | Karen Velthuys | 3,935 | 44.80 | 12.85 | $32,439.47 | |||
| Liberal | Marcel Laurendeau | 883 | 10.05 | -4.26 | $31,742.60 | |||
| Total valid votes | 8,784 | – | – | |||||
| Rejected | 41 | – | ||||||
| Eligible voters / turnout | 13,736 | 64.25 | -1.22 | |||||
Source(s)
Source: Manitoba. Chief Electoral Officer (2011). Statement of Votes for the 40th Provincial General Election, October 4, 2011 (PDF) (Report). Winnipeg: Elections Manitoba. "Election Returns: 40th General Election". Elections Manitoba. 2011. Retrieved September 12, 2018. | ||||||||
2016 general election
| 2016 Manitoba general election | ||||||||
|---|---|---|---|---|---|---|---|---|
| Party | Candidate | Votes | % | ±% | Expenditures | |||
| Progressive Conservative | Jon Reyes | 4,673 | 51.02 | 6.22 | $36,660.34 | |||
| New Democratic | Dave Gaudreau | 3,062 | 33.43 | -11.72 | $24,532.06 | |||
| Liberal | James Bloomfield | 1,251 | 13.66 | 3.60 | $38,985.78 | |||
| Independent | Narinder Kaur Johar | 174 | 1.90 | – | $5,367.70 | |||
| Total valid votes / expense limit | 9,160 | – | – | $44,386.00 | ||||
| Rejected | 134 | – | ||||||
| Eligible voters / Turnout | 14,278 | 65.09 | 0.85 | |||||
Source(s)
Source: Manitoba. Chief Electoral Officer (2016). Statement of Votes for the 41st Provincial General Election, April 19, 2016 (PDF) (Report). Winnipeg: Elections Manitoba. "Election Returns: 41st General Election". Elections Manitoba. 2016. Retrieved September 10, 2018. | ||||||||
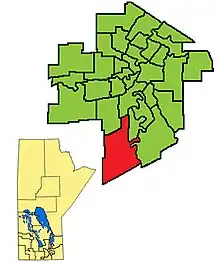
Previous boundaries