The Pas (electoral district)
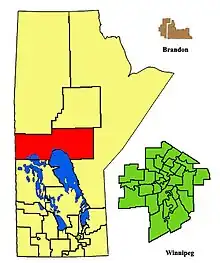
The Pas was a provincial electoral division in north-central Manitoba, Canada. It was created in 1912 following the expansion of the province's northern border, and existed until its dissolution in 2018. It was named for the rural town of The Pas.
 | |
| Defunct provincial electoral district | |
| Legislature | Legislative Assembly of Manitoba |
| District created | 1912 |
| First contested | 1912 |
| Last contested | 2015 |
| Demographics | |
| Census division(s) | Division No. 21, Division No. 22 |
| Census subdivision(s) | Cross Lake 19, Division No. 21, Unorganized, Division No. 22, Unorganized, Kelsey, Moose Lake 31A, Norway House 17, Opaskwayak Cree Nation 21, The Pas |
Until the 1960s, elections in The Pas were deferred until a few weeks after the rest of the province for logistical reasons. It was not unheard of for politicians from the south of the province to run in The Pas after being chosen as cabinet ministers by newly elected provincial governments; Edward Brown and John Bracken were both elected in this manner.
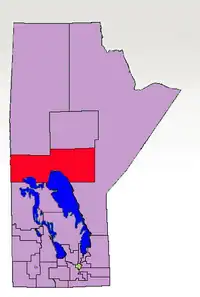
Located in the north of the province, The Pas was bordered by the riding of Rupertsland to the east and south, Thompson and Flin Flon to the north, Swan River and Lake Winnipeg to the south, and the province of Saskatchewan to the west. In addition to the Town of The Pas, it also included Easterville and Norway House.
The Pas was represented by candidates of the New Democratic Party from 1969 onward (and for all but 11 years since 1943), and for much of that time was considered safe for the party. Its last three MLAs—Oscar Lathlin, Frank Whitehead, and Oscar's daughter Amanda Lathlin—were all Indigenous. Whitehead had previously won a by-election on March 24, 2009, following Oscar Lathlin's death. He held it until his resignation in 2014, and Amanda Lathlin won the ensuing by-election.
Following the 2018 redistribution, the riding was abolished, and its area was re-distributed into The Pas-Kameesak, Flin Flon and Keewatinook ridings. Amanda Lathlin transferred to The Pas-Kameesak.
Demographics
The riding's population in 1996 was 19,449. In 1999, the average family income was $42,878, and the unemployment rate was 17.80%. Health and social services account for 14% of the riding's economy, with retail trade accounting for another 14%.
Sixty-seven per cent of the riding's residents are aboriginal, the second-highest rate in the province.
List of provincial representatives
| Name | Party | Took office | Left office |
|---|---|---|---|
| Robert Orok | Conservative | 1912 | 1915 |
| Edward Brown | Liberal | 1915 | 1922 |
| John Bracken | Progressive | 1922 | 1932 |
| Liberal-Progressive | 1932 | 1943 | |
| Beresford Richards | Co-operative Commonwealth | 1943 | 1945 |
| Independent CCF | 1945 | 1945 | |
| Co-operative Commonwealth | 1945 | 1949 | |
| Independent CCF | 1949 | 1949 | |
| Francis Bud Jobin | Liberal-Progressive | 1949 | 1958 |
| John Carroll | Progressive Conservative | 1958 | 1969 |
| Ron McBryde | New Democrat | 1969 | 1977 |
| Harry Harapiak | New Democrat | 1977 | 1990 |
| Oscar Lathlin | New Democrat | 1990 | 2008 |
| Frank Whitehead | New Democrat | 2009 | 2014 |
| Amanda Lathlin | New Democrat | 2015 | 2019 |
Electoral results
1912 by-election
| Manitoba provincial by-election, 1912 | ||||||||
|---|---|---|---|---|---|---|---|---|
| Party | Candidate | Votes | % | |||||
| Conservative | Robert Orok | 0.00 | ||||||
| Total valid votes | – | |||||||
| Rejected | N/A | – | ||||||
| Eligible voters / Turnout | N/A | – | ||||||
Source(s)
Source: Manitoba. Chief Electoral Officer (1999). Statement of Votes for the 37th Provincial General Election, September 21, 1999 (PDF) (Report). Winnipeg: Elections Manitoba. | ||||||||
1914 general election
| 1914 Manitoba general election | ||||||||
|---|---|---|---|---|---|---|---|---|
| Party | Candidate | Votes | % | ±% | ||||
| Conservative | Robert Orok | 0.00 | – | |||||
| Total valid votes | – | – | ||||||
| Rejected | N/A | – | ||||||
| Eligible voters / Turnout | 1,919 | 0.00 | – | |||||
Source(s)
Source: Manitoba. Chief Electoral Officer (1999). Statement of Votes for the 37th Provincial General Election, September 21, 1999 (PDF) (Report). Winnipeg: Elections Manitoba. | ||||||||
1915 general election
| 1915 Manitoba general election | ||||||||
|---|---|---|---|---|---|---|---|---|
| Party | Candidate | Votes | % | ±% | ||||
| Liberal | Edward Brown | 0.00 | – | |||||
| Total valid votes | – | – | ||||||
| Rejected | N/A | – | ||||||
| Eligible voters / Turnout | 736 | 0.00 | 0.00 | |||||
Source(s)
Source: Manitoba. Chief Electoral Officer (1999). Statement of Votes for the 37th Provincial General Election, September 21, 1999 (PDF) (Report). Winnipeg: Elections Manitoba. | ||||||||
1920 general election
| 1920 Manitoba general election | ||||||||
|---|---|---|---|---|---|---|---|---|
| Party | Candidate | Votes | % | ±% | ||||
| Liberal | Edward Brown | 560 | 81.63 | – | ||||
| Labour | Allan Norgrove | 126 | 18.37 | – | ||||
| Total valid votes | 686 | – | – | |||||
| Rejected | N/A | – | ||||||
| Eligible voters / Turnout | 1,006 | 68.19 | 68.19 | |||||
Source(s)
Source: Manitoba. Chief Electoral Officer (1999). Statement of Votes for the 37th Provincial General Election, September 21, 1999 (PDF) (Report). Winnipeg: Elections Manitoba. | ||||||||
1922 general election
| 1922 Manitoba general election | ||||||||
|---|---|---|---|---|---|---|---|---|
| Party | Candidate | Votes | % | ±% | ||||
| United Farmers | John Bracken | 472 | 67.53 | – | ||||
| Independent | Herman Finger | 118 | 16.88 | – | ||||
| Independent | Peter Cecil Robertson | 71 | 10.16 | – | ||||
| Independent | R. H. MacNeill | 38 | 5.44 | – | ||||
| Total valid votes | 699 | – | – | |||||
| Rejected | N/A | – | ||||||
| Eligible voters / Turnout | 1,355 | 51.59 | -16.60 | |||||
Source(s)
Source: Manitoba. Chief Electoral Officer (1999). Statement of Votes for the 37th Provincial General Election, September 21, 1999 (PDF) (Report). Winnipeg: Elections Manitoba. | ||||||||
1927 general election
| 1927 Manitoba general election | ||||||||
|---|---|---|---|---|---|---|---|---|
| Party | Candidate | Votes | % | ±% | ||||
| Progressive | John Bracken | 582 | 56.18 | – | ||||
| Liberal | Stephan Stephansson | 454 | 43.82 | – | ||||
| Total valid votes | 1,036 | – | – | |||||
| Rejected | N/A | – | ||||||
| Eligible voters / Turnout | 1,375 | 75.35 | 23.76 | |||||
Source(s)
Source: Manitoba. Chief Electoral Officer (1999). Statement of Votes for the 37th Provincial General Election, September 21, 1999 (PDF) (Report). Winnipeg: Elections Manitoba. | ||||||||
1932 general election
| 1932 Manitoba general election | ||||||||
|---|---|---|---|---|---|---|---|---|
| Party | Candidate | Votes | % | ±% | ||||
| Liberal–Progressive | John Bracken | 1,915 | 60.62 | – | ||||
| Labour | N. S. McDonald | 1,071 | 33.90 | – | ||||
| Independent Conservative | Harold Frederick Maulson | 173 | 5.48 | – | ||||
| Total valid votes | 3,159 | – | – | |||||
| Rejected | N/A | – | ||||||
| Eligible voters / Turnout | 4,825 | 65.47 | -9.87 | |||||
Source(s)
Source: Manitoba. Chief Electoral Officer (1999). Statement of Votes for the 37th Provincial General Election, September 21, 1999 (PDF) (Report). Winnipeg: Elections Manitoba. | ||||||||
1936 general election
| 1936 Manitoba general election | ||||||||
|---|---|---|---|---|---|---|---|---|
| Party | Candidate | Votes | % | ±% | ||||
| Liberal–Progressive | John Bracken | 2,968 | 60.30 | -0.32 | ||||
| Conservative | George Baskerville Mainwaring | 1,954 | 39.70 | – | ||||
| Total valid votes | 4,922 | – | – | |||||
| Rejected | 121 | – | ||||||
| Eligible voters / Turnout | 6,910 | 72.98 | 7.51 | |||||
Source(s)
Source: Manitoba. Chief Electoral Officer (1999). Statement of Votes for the 37th Provincial General Election, September 21, 1999 (PDF) (Report). Winnipeg: Elections Manitoba. | ||||||||
1941 general election
| 1941 Manitoba general election | ||||||||
|---|---|---|---|---|---|---|---|---|
| Party | Candidate | Votes | % | ±% | ||||
| Liberal–Progressive | John Bracken | 0.00 | -60.30 | |||||
| Total valid votes | – | – | ||||||
| Rejected | N/A | – | ||||||
| Eligible voters / Turnout | 8,819 | 0.00 | -72.98 | |||||
Source(s)
Source: Manitoba. Chief Electoral Officer (1999). Statement of Votes for the 37th Provincial General Election, September 21, 1999 (PDF) (Report). Winnipeg: Elections Manitoba. | ||||||||
1943 by-election
| Manitoba provincial by-election, 1943 | ||||||||
|---|---|---|---|---|---|---|---|---|
| Party | Candidate | Votes | % | ±% | ||||
| Co-operative Commonwealth | Beresford Richards | 3,504 | 61.15 | – | ||||
| Unknown | R. M. McIsaac | 1,270 | 22.16 | – | ||||
| Liberal–Progressive | Orson F. Wright | 526 | 9.18 | – | ||||
| Progressive Conservative | George Baskerville Mainwaring | 430 | 7.50 | – | ||||
| Total valid votes | 5,730 | – | – | |||||
| Rejected | N/A | – | ||||||
| Eligible voters / Turnout | N/A | – | – | |||||
Source(s)
Source: Manitoba. Chief Electoral Officer (1999). Statement of Votes for the 37th Provincial General Election, September 21, 1999 (PDF) (Report). Winnipeg: Elections Manitoba. | ||||||||
1945 general election
| 1945 Manitoba general election | ||||||||
|---|---|---|---|---|---|---|---|---|
| Party | Candidate | Votes | % | ±% | ||||
| Co-operative Commonwealth | Beresford Richards | 2,840 | 50.72 | -10.43 | ||||
| Independent | Robert Franklin Milton | 2,759 | 49.28 | – | ||||
| Total valid votes | 5,599 | – | – | |||||
| Rejected | 68 | – | ||||||
| Eligible voters / Turnout | 7,856 | 72.14 | – | |||||
Source(s)
Source: Manitoba. Chief Electoral Officer (1999). Statement of Votes for the 37th Provincial General Election, September 21, 1999 (PDF) (Report). Winnipeg: Elections Manitoba. | ||||||||
1949 general election
| 1949 Manitoba general election | ||||||||
|---|---|---|---|---|---|---|---|---|
| Party | Candidate | Votes | % | ±% | ||||
| Liberal–Progressive | Francis Lawrence Jobin | 4,311 | 64.85 | – | ||||
| Independent | Beresford Richards | 1,521 | 22.88 | – | ||||
| Co-operative Commonwealth | Gordon Murray Ferg | 816 | 12.27 | -38.45 | ||||
| Total valid votes | 6,648 | – | – | |||||
| Rejected | 92 | – | ||||||
| Eligible voters / Turnout | 11,033 | 61.09 | -11.05 | |||||
Source(s)
Source: Manitoba. Chief Electoral Officer (1999). Statement of Votes for the 37th Provincial General Election, September 21, 1999 (PDF) (Report). Winnipeg: Elections Manitoba. | ||||||||
1953 general election
| 1953 Manitoba general election | ||||||||
|---|---|---|---|---|---|---|---|---|
| Party | Candidate | Votes | % | ±% | ||||
| Liberal–Progressive | Francis Lawrence Jobin | 4,875 | 60.42 | -4.43 | ||||
| Social Credit | William Henry Calvert | 1,668 | 20.67 | – | ||||
| Co-operative Commonwealth | Walter Arthur Thompson | 1,526 | 18.91 | 6.64 | ||||
| Total valid votes | 8,069 | – | – | |||||
| Rejected | 177 | – | ||||||
| Eligible voters / Turnout | 13,425 | 61.42 | 0.33 | |||||
Source(s)
Source: Manitoba. Chief Electoral Officer (1999). Statement of Votes for the 37th Provincial General Election, September 21, 1999 (PDF) (Report). Winnipeg: Elections Manitoba. | ||||||||
1958 general election
| 1958 Manitoba general election | ||||||||
|---|---|---|---|---|---|---|---|---|
| Party | Candidate | Votes | % | ±% | ||||
| Progressive Conservative | John Carroll | 2,325 | 57.78 | – | ||||
| Liberal–Progressive | Wilfred E. Cudmore | 898 | 22.32 | -38.10 | ||||
| Co-operative Commonwealth | Howard Pawley | 801 | 19.91 | 0.99 | ||||
| Total valid votes | 4,024 | – | – | |||||
| Rejected | 40 | – | ||||||
| Eligible voters / Turnout | 5,932 | 68.51 | 7.09 | |||||
Source(s)
Source: Manitoba. Chief Electoral Officer (1999). Statement of Votes for the 37th Provincial General Election, September 21, 1999 (PDF) (Report). Winnipeg: Elections Manitoba. | ||||||||
1959 general election
| 1959 Manitoba general election | ||||||||
|---|---|---|---|---|---|---|---|---|
| Party | Candidate | Votes | % | ±% | ||||
| Progressive Conservative | John Carroll | 2,345 | 56.49 | -1.29 | ||||
| Liberal–Progressive | Mervin Hill | 1,027 | 24.74 | 2.42 | ||||
| Co-operative Commonwealth | Peter Shewchuk | 779 | 18.77 | -1.14 | ||||
| Total valid votes | 4,151 | – | – | |||||
| Rejected | 28 | – | ||||||
| Eligible voters / Turnout | 5,950 | 70.24 | 1.73 | |||||
Source(s)
Source: Manitoba. Chief Electoral Officer (1999). Statement of Votes for the 37th Provincial General Election, September 21, 1999 (PDF) (Report). Winnipeg: Elections Manitoba. | ||||||||
1962 general election
| 1962 Manitoba general election | ||||||||
|---|---|---|---|---|---|---|---|---|
| Party | Candidate | Votes | % | ±% | ||||
| Progressive Conservative | John Carroll | 2,484 | 56.31 | -0.18 | ||||
| Liberal | Adam Deminick | 1,497 | 33.94 | – | ||||
| New Democratic | Rachel Shewchuk | 430 | 9.75 | – | ||||
| Total valid votes | 4,411 | – | – | |||||
| Rejected | 44 | – | ||||||
| Eligible voters / Turnout | 6,398 | 69.63 | -0.60 | |||||
Source(s)
Source: Manitoba. Chief Electoral Officer (1999). Statement of Votes for the 37th Provincial General Election, September 21, 1999 (PDF) (Report). Winnipeg: Elections Manitoba. | ||||||||
1966 general election
| 1966 Manitoba general election | ||||||||
|---|---|---|---|---|---|---|---|---|
| Party | Candidate | Votes | % | ±% | ||||
| Progressive Conservative | John Carroll | 2,278 | 52.55 | -3.76 | ||||
| Liberal | Calvin D. Gibson | 1,769 | 40.81 | 6.87 | ||||
| New Democratic | Glen F. Allen | 288 | 6.64 | -3.10 | ||||
| Total valid votes | 4,335 | – | – | |||||
| Rejected | 16 | – | ||||||
| Eligible voters / Turnout | 6,318 | 68.87 | -0.76 | |||||
Source(s)
Source: Manitoba. Chief Electoral Officer (1999). Statement of Votes for the 37th Provincial General Election, September 21, 1999 (PDF) (Report). Winnipeg: Elections Manitoba. | ||||||||
1969 general election
| 1969 Manitoba general election | ||||||||
|---|---|---|---|---|---|---|---|---|
| Party | Candidate | Votes | % | ±% | ||||
| New Democratic | Ron McBryde | 1,556 | 40.10 | 33.46 | ||||
| Progressive Conservative | John Carroll | 1,361 | 35.08 | -17.47 | ||||
| Liberal | Calvert D. Gibson | 963 | 24.82 | -15.99 | ||||
| Total valid votes | 3,880 | – | – | |||||
| Rejected | 29 | – | ||||||
| Eligible voters / Turnout | 5,914 | 66.10 | -2.77 | |||||
Source(s)
Source: Manitoba. Chief Electoral Officer (1999). Statement of Votes for the 37th Provincial General Election, September 21, 1999 (PDF) (Report). Winnipeg: Elections Manitoba. | ||||||||
1973 general election
| 1973 Manitoba general election | ||||||||
|---|---|---|---|---|---|---|---|---|
| Party | Candidate | Votes | % | ±% | ||||
| New Democratic | Ron McBryde | 3,673 | 66.23 | 26.12 | ||||
| Independent | George Takashima | 1,873 | 33.77 | – | ||||
| Total valid votes | 5,546 | – | – | |||||
| Rejected | 56 | – | ||||||
| Eligible voters / Turnout | 8,088 | 69.26 | 3.17 | |||||
Source(s)
Source: Manitoba. Chief Electoral Officer (1999). Statement of Votes for the 37th Provincial General Election, September 21, 1999 (PDF) (Report). Winnipeg: Elections Manitoba. | ||||||||
1977 general election
| 1977 Manitoba general election | ||||||||
|---|---|---|---|---|---|---|---|---|
| Party | Candidate | Votes | % | ±% | ||||
| New Democratic | Ron McBryde | 3,471 | 56.44 | -9.79 | ||||
| Progressive Conservative | Percy Pielak | 1,965 | 31.95 | – | ||||
| Liberal | Edwin Jebb | 714 | 11.61 | – | ||||
| Total valid votes | 6,150 | – | – | |||||
| Rejected | 21 | – | ||||||
| Eligible voters / Turnout | 8,909 | 69.27 | 0.00 | |||||
Source(s)
Source: Manitoba. Chief Electoral Officer (1999). Statement of Votes for the 37th Provincial General Election, September 21, 1999 (PDF) (Report). Winnipeg: Elections Manitoba. | ||||||||
1981 general election
| 1981 Manitoba general election | ||||||||
|---|---|---|---|---|---|---|---|---|
| Party | Candidate | Votes | % | ±% | ||||
| New Democratic | Harry Harapiak | 4,236 | 70.04 | 13.60 | ||||
| Progressive Conservative | Percy Pielak | 1,303 | 21.54 | -10.41 | ||||
| Liberal | Laverne Jaeb | 509 | 8.42 | -3.19 | ||||
| Total valid votes | 6,048 | – | – | |||||
| Rejected | 49 | – | ||||||
| Eligible voters / Turnout | 8,252 | 73.89 | 4.62 | |||||
Source(s)
Source: Manitoba. Chief Electoral Officer (1999). Statement of Votes for the 37th Provincial General Election, September 21, 1999 (PDF) (Report). Winnipeg: Elections Manitoba. | ||||||||
1986 general election
| 1986 Manitoba general election | ||||||||
|---|---|---|---|---|---|---|---|---|
| Party | Candidate | Votes | % | ±% | ||||
| New Democratic | Harry Harapiak | 4,051 | 68.34 | -1.70 | ||||
| Progressive Conservative | Ernest Polsom | 1,088 | 18.35 | -3.19 | ||||
| Liberal | Scott Gray | 789 | 13.31 | 4.89 | ||||
| Total valid votes | 5,928 | – | – | |||||
| Rejected | 17 | – | ||||||
| Eligible voters / Turnout | 8,720 | 68.18 | -5.71 | |||||
Source(s)
Source: Manitoba. Chief Electoral Officer (1999). Statement of Votes for the 37th Provincial General Election, September 21, 1999 (PDF) (Report). Winnipeg: Elections Manitoba. | ||||||||
1988 general election
| 1988 Manitoba general election | ||||||||
|---|---|---|---|---|---|---|---|---|
| Party | Candidate | Votes | % | ±% | ||||
| New Democratic | Harry Harapiak | 3,221 | 51.69 | -16.64 | ||||
| Progressive Conservative | Bruce Unfried | 1,584 | 25.42 | 7.07 | ||||
| Liberal | Scott Gray | 1,426 | 22.89 | 9.58 | ||||
| Total valid votes | 6,231 | – | – | |||||
| Rejected | 17 | – | ||||||
| Eligible voters / Turnout | 8,550 | 73.08 | 4.90 | |||||
Source(s)
Source: Manitoba. Chief Electoral Officer (1999). Statement of Votes for the 37th Provincial General Election, September 21, 1999 (PDF) (Report). Winnipeg: Elections Manitoba. | ||||||||
1990 general election
| 1990 Manitoba general election | ||||||||
|---|---|---|---|---|---|---|---|---|
| Party | Candidate | Votes | % | ±% | ||||
| New Democratic | Oscar Lathlin | 3,390 | 44.36 | -7.33 | ||||
| Progressive Conservative | Alfred McDonald | 3,247 | 42.49 | 17.07 | ||||
| Liberal | David Merasty | 1,005 | 13.15 | -9.73 | ||||
| Total valid votes | 7,642 | – | – | |||||
| Rejected | 21 | – | ||||||
| Eligible voters / Turnout | 11,651 | 65.77 | -7.30 | |||||
Source(s)
Source: Manitoba. Chief Electoral Officer (1999). Statement of Votes for the 37th Provincial General Election, September 21, 1999 (PDF) (Report). Winnipeg: Elections Manitoba. | ||||||||
1995 general election
| 1995 Manitoba general election | ||||||||
|---|---|---|---|---|---|---|---|---|
| Party | Candidate | Votes | % | ±% | ||||
| New Democratic | Oscar Lathlin | 3,616 | 51.70 | 7.34 | ||||
| Progressive Conservative | Alfred MacDonald | 2,501 | 35.76 | -6.73 | ||||
| Liberal | Clem Jones | 877 | 12.54 | -0.61 | ||||
| Total valid votes | 6,994 | – | – | |||||
| Rejected | 27 | – | ||||||
| Eligible voters / Turnout | 12,056 | 58.24 | -7.53 | |||||
Source(s)
Source: Manitoba. Chief Electoral Officer (1999). Statement of Votes for the 37th Provincial General Election, September 21, 1999 (PDF) (Report). Winnipeg: Elections Manitoba. | ||||||||
1999 general election
| 1999 Manitoba general election | ||||||||
|---|---|---|---|---|---|---|---|---|
| Party | Candidate | Votes | % | ±% | ||||
| New Democratic | Oscar Lathlin | 2,952 | 46.85 | -4.85 | ||||
| Progressive Conservative | Ron Evans | 2,737 | 43.44 | 7.68 | ||||
| Liberal | Don Sandberg | 612 | 9.71 | -2.83 | ||||
| Total valid votes | 6,301 | – | – | |||||
| Rejected | 101 | – | ||||||
| Eligible voters / turnout | 12,377 | 51.72 | -6.51 | |||||
Source(s)
Source: Manitoba. Chief Electoral Officer (1999). Statement of Votes for the 37th Provincial General Election, September 21, 1999 (PDF) (Report). Winnipeg: Elections Manitoba. | ||||||||
2003 general election
| 2003 Manitoba general election | ||||||||
|---|---|---|---|---|---|---|---|---|
| Party | Candidate | Votes | % | ±% | Expenditures | |||
| New Democratic | Oscar Lathlin | 3,104 | 65.61 | 18.76 | $18,254.02 | |||
| Liberal | Mark Sweeny | 836 | 17.67 | 7.96 | $6,302.87 | |||
| Progressive Conservative | Richard Goudry | 791 | 16.72 | -26.72 | $4,258.53 | |||
| Total valid votes | 4,731 | – | – | |||||
| Rejected | 19 | – | ||||||
| Eligible voters / turnout | 11,739 | 40.46 | -11.26 | |||||
Source(s)
Source: Manitoba. Chief Electoral Officer (2003). Statement of Votes for the 38th Provincial General Election, June 3, 2003 (PDF) (Report). Winnipeg: Elections Manitoba. | ||||||||
2007 general election
| 2007 Manitoba general election | ||||||||
|---|---|---|---|---|---|---|---|---|
| Party | Candidate | Votes | % | ±% | Expenditures | |||
| New Democratic | Oscar Lathlin | 3,262 | 68.86 | 3.25 | $22,521.26 | |||
| Progressive Conservative | George Muswaggon | 1,016 | 21.45 | 4.73 | $7,505.06 | |||
| Liberal | James Houston | 459 | 9.69 | -7.98 | $224.51 | |||
| Total valid votes | 4,737 | – | – | |||||
| Rejected | 39 | – | ||||||
| Eligible voters / turnout | 13,040 | 36.63 | -3.84 | |||||
Source(s)
Source: Manitoba. Chief Electoral Officer (2007). Statement of Votes for the 39th Provincial General Election, May 22, 2007 (PDF) (Report). Winnipeg: Elections Manitoba. | ||||||||
2009 by-election
| Manitoba provincial by-election, March 24, 2009 | ||||||||
|---|---|---|---|---|---|---|---|---|
| Party | Candidate | Votes | % | ±% | Expenditures | |||
| New Democratic | Frank Whitehead | 2,949 | 75.11 | 6.25 | 25,898.41 | |||
| Progressive Conservative | Edna Nabess | 722 | 18.39 | -3.06 | 31,676.75 | |||
| Liberal | Maurice Berens | 255 | 6.50 | -3.19 | 9,255.99 | |||
| Total valid votes | 3,926 | – | – | |||||
| Rejected | 23 | – | ||||||
| Eligible voters / Turnout | 13,334 | 29.44 | – | |||||
| New Democratic hold | Swing | +4.66 | ||||||
Source(s) | ||||||||
2011 general election
| 2011 Manitoba general election | ||||||||
|---|---|---|---|---|---|---|---|---|
| Party | Candidate | Votes | % | ±% | Expenditures | |||
| New Democratic | Frank Whitehead | 2,995 | 73.61 | -1.51 | $20,683.92 | |||
| Progressive Conservative | Alfred McDonald | 959 | 23.57 | 5.18 | $ 5,562.86 | |||
| Liberal | Girma Tessema | 115 | 2.83 | -3.67 | $ 0.00 | |||
| Total valid votes | 4,069 | – | – | |||||
| Rejected | 22 | – | ||||||
| Eligible voters / turnout | 13,459 | 30.40 | – | |||||
| New Democratic hold | Swing | −3.34 | ||||||
Source(s)
Source: Manitoba. Chief Electoral Officer (2011). Statement of Votes for the 40th Provincial General Election, October 4, 2011 (PDF) (Report). Winnipeg: Elections Manitoba. | ||||||||
2015 by-election
| Manitoba provincial by-election, April 21, 2015 | ||||||||
|---|---|---|---|---|---|---|---|---|
| Party | Candidate | Votes | % | ±% | Expenditures | |||
| New Democratic | Amanda Lathlin | 1,557 | 56.76 | -16.84 | $26,202.75 | |||
| Progressive Conservative | Jacob Nasekapow | 817 | 29.78 | 6.22 | $31,878.68 | |||
| Liberal | Inez Vystrcil-Spence | 369 | 13.45 | 10.63 | $2,941.26 | |||
| Total valid votes | 2,743 | – | – | |||||
| Rejected | 10 | – | ||||||
| Eligible voters / Turnout | 13,111 | 20.92 | – | |||||
| New Democratic hold | Swing | -11.53 | ||||||
Source(s) | ||||||||
2016 general election
| 2016 Manitoba general election | ||||||||
|---|---|---|---|---|---|---|---|---|
| Party | Candidate | Votes | % | ±% | Expenditures | |||
| New Democratic | Amanda Lathlin | 1,976 | 43.49 | -13.28 | $26,898.08 | |||
| Progressive Conservative | Doug Lauvstad | 1,765 | 38.84 | 9.06 | $14,083.14 | |||
| Liberal | Tyler Duncan | 586 | 12.90 | -0.56 | $2,326.92 | |||
| Green | Patrick Wood | 217 | 4.78 | – | $33.78 | |||
| Total valid votes | 4,544 | – | – | |||||
| Rejected | 25 | – | ||||||
| Eligible voters / Turnout | 14,883 | 30.70 | – | |||||
Source(s)
Source: Manitoba. Chief Electoral Officer (2016). Statement of Votes for the 41st Provincial General Election, April 19, 2016 (PDF) (Report). Winnipeg: Elections Manitoba. "Election Returns: 41st General Election". Elections Manitoba. 2016. Retrieved September 10, 2018. | ||||||||
Previous boundaries
References
- "Candidates: The Pas By-election". Elections Manitoba. 2015. Retrieved August 22, 2018.
- "2015 The Pas Byelection Results" (PDF). Elections Manitoba.