List of countries by oil production
This is a list of countries by oil production (i.e., petroleum production), as compiled from the U.S. Energy Information Administration database for calendar year 2022, tabulating all countries on a comparable best-estimate basis. Compared with shorter-term data, the full-year figures are less prone to distortion from periodic maintenance shutdowns and other seasonal cycles. The volumes in the table represent crude oil and lease condensate, the hydrocarbon liquids collected at or near the wellhead. The volumes in this table does not include biofuel, refinery gain (the increase in liquid volumes during oil refining), or liquids separated from natural gas in gas processing plants (natural gas liquids).[1] Production data including these other liquids is usually referred to as "Total Liquids Production," "Petroleum & Other Liquids," etc.[2]

Under this definition (crude and condensate), total world oil production in 2022 averaged 80,618,895 barrels per day. Approximately 69% came from the top ten countries, and an overlapping 38% came from the thirteen current OPEC members, in the table below. Members of OPEC+, which includes current OPEC members produce 58% of the world's petroleum.
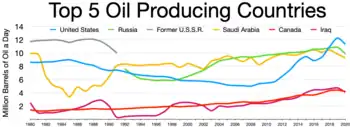
In recent history, the top three producers have been the United States, Russia, and Saudi Arabia. Each of these countries experienced major production declines at different times in the past, but since 2014 all three have been producing near their peak rates of 9 to 11 million barrels per day.[3] Saudi Arabia and Russia also top the list of oil exporting countries.[4]
The United States became a net petroleum exporter in 2020, for the first time since at least 1949.[5] U.S. crude oil exports reached a record high in the first half of 2023.[6] U.S. oil production reached a record high in October 2023.[7]
| Country | Oil production July 2023 (bbl/day) |
|---|---|
| 12,800,000[8] | |
| 9,400,000[9] | |
| 9,060,000[9] | |
| 4,480,000[10] | |
| 4,270,000[9] | |
| 4,249,809[11] | |
| 3,300,000[12] | |
| 3,240,000[9] | |
| 2,550,000[9] | |
See also
References
- "Annual petroleum and other liquids production". U.S. Energy Information Administration. Retrieved 15 April 2022.
- "Petroleum & Other Liquids". US Energy Information Administration.
- "Monthly Energy Review" (PDF). U.S. Energy Information Administration. 25 May 2017. Figure 11.1a. Retrieved 28 May 2017.
- "OPEC+ not to increase oil production in April". International Insider. 5 March 2021. Retrieved 6 March 2021.
- "Oil and petroleum products explained". Energy Information Administration. 2 October 2023.
- "U.S. crude oil exports reached a record high in first half of 2023". Energy Information Administration. 10 October 2023.
- Borenstein, Seth (20 October 2023). "US oil production hits all-time high, conflicting with efforts to cut heat-trapping pollution". Associated Press.
- "Weekly U.S. Field Production of Crude Oil (Thousand Barrels per Day)". eia.gov. Retrieved 25 September 2023.
- "Oil Market Report - August 2023 – Analysis". IEA. Retrieved 25 September 2023.
- "Brazil's oil and gas output hits fresh record in July". Reuters. 30 August 2023. Retrieved 25 September 2023.
- "Energy Production in July 2023". stats.gov.cn. Retrieved 25 September 2023.
- "Owji: Iran's crude oil output rises to 3.3 million barrels a day". Shana. 23 August 2023. Retrieved 25 September 2023.