HSL and HSV
HSL (for hue, saturation, lightness) and HSV (for hue, saturation, value; also known as HSB, for hue, saturation, brightness) are alternative representations of the RGB color model, designed in the 1970s by computer graphics researchers to more closely align with the way human vision perceives color-making attributes. In these models, colors of each hue are arranged in a radial slice, around a central axis of neutral colors which ranges from black at the bottom to white at the top.

The HSL representation models the way different paints mix together to create color in the real world, with the lightness dimension resembling the varying amounts of black or white paint in the mixture (e.g. to create "light red", a red pigment can be mixed with white paint; this white paint corresponds to a high "lightness" value in the HSL representation). Fully saturated colors are placed around a circle at a lightness value of ½, with a lightness value of 0 or 1 corresponding to fully black or white, respectively.
Meanwhile, the HSV representation models how colors appear under light. The difference between HSL and HSV is that a color with maximum lightness in HSL is pure white, but a color with maximum value/brightness in HSV is analogous to shining a white light on a colored object (e.g. shining a bright white light on a red object causes the object to still appear red, just brighter and more intense, while shining a dim light on a red object causes the object to appear darker and less bright).
The issue with both HSV and HSL is that these approaches do not effectively separate color into their three value components according to human perception of color.[1][2][3] This can be seen when the saturation settings are altered — it is quite easy to notice the difference in perceptual lightness despite the "V" or "L" setting being fixed.
Basic principle
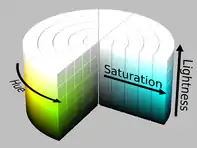
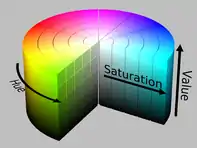
HSL and HSV are both cylindrical geometries (fig. 2), with hue, their angular dimension, starting at the red primary at 0°, passing through the green primary at 120° and the blue primary at 240°, and then wrapping back to red at 360°. In each geometry, the central vertical axis comprises the neutral, achromatic, or gray colors ranging, from top to bottom, white at lightness 1 (value 1) to black at lightness 0 (value 0).
In both geometries, the additive primary and secondary colors—red, yellow, green, cyan, blue and magenta—and linear mixtures between adjacent pairs of them, sometimes called pure colors, are arranged around the outside edge of the cylinder with saturation 1. These saturated colors have lightness 0.5 in HSL, while in HSV they have value 1. Mixing these pure colors with black—producing so-called shades—leaves saturation unchanged. In HSL, saturation is also unchanged by tinting with white, and only mixtures with both black and white—called tones—have saturation less than 1. In HSV, tinting alone reduces saturation.


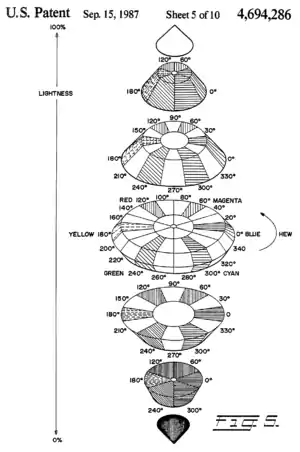
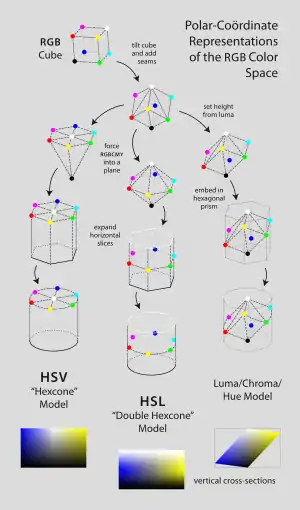
Because these definitions of saturation—in which very dark (in both models) or very light (in HSL) near-neutral colors are considered fully saturated (for instance, from the bottom right in the sliced HSL cylinder or from the top right)—conflict with the intuitive notion of color purity, often a conic or biconic solid is drawn instead (fig. 3), with what this article calls chroma as its radial dimension (equal to the range of the RGB values), instead of saturation (where the saturation is equal to the chroma over the maximum chroma in that slice of the (bi)cone). Confusingly, such diagrams usually label this radial dimension "saturation", blurring or erasing the distinction between saturation and chroma.[upper-alpha 1] As described below, computing chroma is a helpful step in the derivation of each model. Because such an intermediate model—with dimensions hue, chroma, and HSV value or HSL lightness—takes the shape of a cone or bicone, HSV is often called the "hexcone model" while HSL is often called the "bi-hexcone model" (fig. 8).[upper-alpha 2]
Motivation
The HSL color space was invented for television in 1938 by Georges Valensi as a method to add color encoding to existing monochrome (i.e. only containing the L signal) broadcasts, allowing existing receivers to receive new color broadcasts (in black and white) without modification as the luminance (black and white) signal is broadcast unmodified. It has been used in all major analog broadcast television encoding including NTSC, PAL and SECAM and all major digital broadcast systems and is the basis for composite video.[4][5]
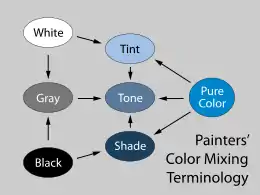
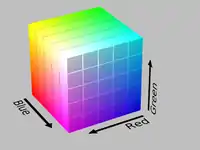
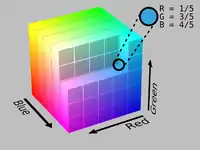
Most televisions, computer displays, and projectors produce colors by combining red, green, and blue light in varying intensities—the so-called RGB additive primary colors. The resulting mixtures in RGB color space can reproduce a wide variety of colors (called a gamut); however, the relationship between the constituent amounts of red, green, and blue light and the resulting color is unintuitive, especially for inexperienced users, and for users familiar with subtractive color mixing of paints or traditional artists' models based on tints and shades (fig. 4). Furthermore, neither additive nor subtractive color models define color relationships the same way the human eye does.[upper-alpha 3]
For example, imagine we have an RGB display whose color is controlled by three sliders ranging from 0–255, one controlling the intensity of each of the red, green, and blue primaries. If we begin with a relatively colorful orange , with sRGB values R = 217, G = 118, B = 33, and want to reduce its colorfulness by half to a less saturated orange , we would need to drag the sliders to decrease R by 31, increase G by 24, and increase B by 59, as pictured below.
![]()
In an attempt to accommodate more traditional and intuitive color mixing models, computer graphics pioneers at PARC and NYIT introduced the HSV model for computer display technology in the mid-1970s, formally described by Alvy Ray Smith[13] in the August 1978 issue of Computer Graphics. In the same issue, Joblove and Greenberg[14] described the HSL model—whose dimensions they labeled hue, relative chroma, and intensity—and compared it to HSV (fig. 1). Their model was based more upon how colors are organized and conceptualized in human vision in terms of other color-making attributes, such as hue, lightness, and chroma; as well as upon traditional color mixing methods—e.g., in painting—that involve mixing brightly colored pigments with black or white to achieve lighter, darker, or less colorful colors.
The following year, 1979, at SIGGRAPH, Tektronix introduced graphics terminals using HSL for color designation, and the Computer Graphics Standards Committee recommended it in their annual status report (fig. 7). These models were useful not only because they were more intuitive than raw RGB values, but also because the conversions to and from RGB were extremely fast to compute: they could run in real time on the hardware of the 1970s. Consequently, these models and similar ones have become ubiquitous throughout image editing and graphics software since then. Some of their uses are described below.[15][16][17][18]
Formal derivation
Color-making attributes
The dimensions of the HSL and HSV geometries—simple transformations of the not-perceptually-based RGB model—are not directly related to the photometric color-making attributes of the same names, as defined by scientists such as the CIE or ASTM. Nonetheless, it is worth reviewing those definitions before leaping into the derivation of our models.[upper-alpha 4] For the definitions of color-making attributes which follow, see:[19][20][21][22][23][24]
- Hue
- The "attribute of a visual sensation according to which an area appears to be similar to one of the perceived colors: red, yellow, green, and blue, or to a combination of two of them".[19]
- Radiance (Le,Ω)
- The radiant power of light passing through a particular surface per unit solid angle per unit projected area, measured in SI units in watt per steradian per square metre (W·sr−1·m−2).
- Luminance (Y or Lv,Ω)
- The radiance weighted by the effect of each wavelength on a typical human observer, measured in SI units in candela per square meter (cd/m2). Often the term luminance is used for the relative luminance, Y/Yn, where Yn is the luminance of the reference white point.
- Luma (Y′)
- The weighted sum of gamma-corrected R′, G′, and B′ values, and used in Y′CbCr, for JPEG compression and video transmission.
- Brightness (or value)
- The "attribute of a visual sensation according to which an area appears to emit more or less light".[19]
- Lightness
- The "brightness relative to the brightness of a similarly illuminated white".[19]
- Colorfulness
- The "attribute of a visual sensation according to which the perceived color of an area appears to be more or less chromatic".[19]
- Chroma
- The "colorfulness relative to the brightness of a similarly illuminated white".[19]
- Saturation
- The "colorfulness of a stimulus relative to its own brightness".[19]
Brightness and colorfulness are absolute measures, which usually describe the spectral distribution of light entering the eye, while lightness and chroma are measured relative to some white point, and are thus often used for descriptions of surface colors, remaining roughly constant even as brightness and colorfulness change with different illumination. Saturation can be defined as either the ratio of colorfulness to brightness, or that of chroma to lightness.
General approach
HSL, HSV, and related models can be derived via geometric strategies, or can be thought of as specific instances of a "generalized LHS model". The HSL and HSV model-builders took an RGB cube—with constituent amounts of red, green, and blue light in a color denoted R, G, B ∈ [0, 1][upper-alpha 5]—and tilted it on its corner, so that black rested at the origin with white directly above it along the vertical axis, then measured the hue of the colors in the cube by their angle around that axis, starting with red at 0°. Then they came up with a characterization of brightness/value/lightness, and defined saturation to range from 0 along the axis to 1 at the most colorful point for each pair of other parameters.[6][13][14]
Hue and chroma
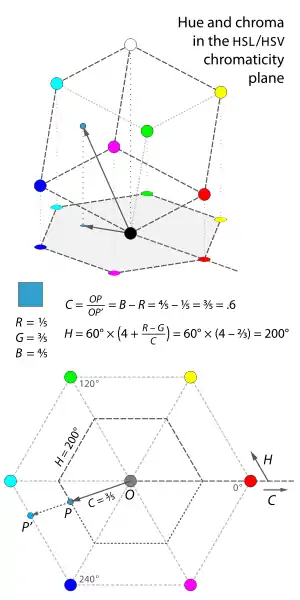
In each of our models, we calculate both hue and what this article will call chroma, after Joblove and Greenberg (1978), in the same way—that is, the hue of a color has the same numerical values in all of these models, as does its chroma. If we take our tilted RGB cube, and project it onto the "chromaticity plane" perpendicular to the neutral axis, our projection takes the shape of a hexagon, with red, yellow, green, cyan, blue, and magenta at its corners (fig. 9). Hue is roughly the angle of the vector to a point in the projection, with red at 0°, while chroma is roughly the distance of the point from the origin.[upper-alpha 6][upper-alpha 7]
More precisely, both hue and chroma in this model are defined with respect to the hexagonal shape of the projection. The chroma is the proportion of the distance from the origin to the edge of the hexagon. In the lower part of the adjacent diagram, this is the ratio of lengths OP/OP′, or alternatively the ratio of the radii of the two hexagons. This ratio is the difference between the largest and smallest values among R, G, or B in a color. To make our definitions easier to write, we'll define these maximum, minimum, and chroma component values as M, m, and C, respectively.[upper-alpha 8]
To understand why chroma can be written as M − m, notice that any neutral color, with R = G = B, projects onto the origin and so has 0 chroma. Thus if we add or subtract the same amount from all three of R, G, and B, we move vertically within our tilted cube, and do not change the projection. Therefore, any two colors of (R, G, B) and (R − m, G − m, B − m) project on the same point, and have the same chroma. The chroma of a color with one of its components equal to zero (m = 0) is simply the maximum of the other two components. This chroma is M in the particular case of a color with a zero component, and M − m in general.
The hue is the proportion of the distance around the edge of the hexagon which passes through the projected point, originally measured on the range [0, 1] but now typically measured in degrees [0°, 360°]. For points which project onto the origin in the chromaticity plane (i.e., grays), hue is undefined. Mathematically, this definition of hue is written piecewise:[upper-alpha 9]
Sometimes, neutral colors (i.e. with C = 0) are assigned a hue of 0° for convenience of representation.
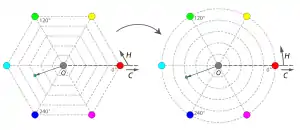
These definitions amount to a geometric warping of hexagons into circles: each side of the hexagon is mapped linearly onto a 60° arc of the circle (fig. 10). After such a transformation, hue is precisely the angle around the origin and chroma the distance from the origin: the angle and magnitude of the vector pointing to a color.

Sometimes for image analysis applications, this hexagon-to-circle transformation is skipped, and hue and chroma (we'll denote these H2 and C2) are defined by the usual cartesian-to-polar coordinate transformations (fig. 11). The easiest way to derive those is via a pair of cartesian chromaticity coordinates which we'll call α and β:[25][26][27]
(The atan2 function, a "two-argument arctangent", computes the angle from a cartesian coordinate pair.)
Notice that these two definitions of hue (H and H2) nearly coincide, with a maximum difference between them for any color of about 1.12°—which occurs at twelve particular hues, for instance H = 13.38°, H2 = 12.26°—and with H = H2 for every multiple of 30°. The two definitions of chroma (C and C2) differ more substantially: they are equal at the corners of our hexagon, but at points halfway between two corners, such as H = H2 = 30°, we have C = 1, but C2 = √¾ ≈ 0.866, a difference of about 13.4%.
Lightness
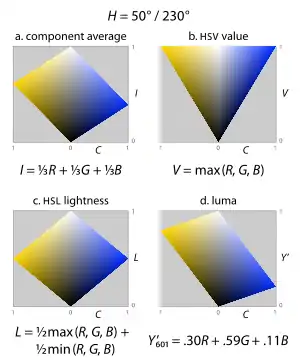
While the definition of hue is relatively uncontroversial—it roughly satisfies the criterion that colors of the same perceived hue should have the same numerical hue—the definition of a lightness or value dimension is less obvious: there are several possibilities depending on the purpose and goals of the representation. Here are four of the most common (fig. 12; three of these are also shown in fig. 8):
- The simplest definition is just the arithmetic mean, i.e. average, of the three components, in the HSI model called intensity (fig. 12a). This is simply the projection of a point onto the neutral axis—the vertical height of a point in our tilted cube. The advantage is that, together with Euclidean-distance calculations of hue and chroma, this representation preserves distances and angles from the geometry of the RGB cube.[26][28]
- In the HSV "hexcone" model, value is defined as the largest component of a color, our M above (fig. 12b). This places all three primaries, and also all of the "secondary colors"—cyan, yellow, and magenta—into a plane with white, forming a hexagonal pyramid out of the RGB cube.[13]
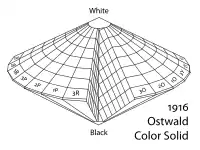
- In the HSL "bi-hexcone" model, lightness is defined as the average of the largest and smallest color components (fig. 12c), i.e. the mid-range of the RGB components. This definition also puts the primary and secondary colors into a plane, but a plane passing halfway between white and black. The resulting color solid is a double-cone similar to Ostwald's, shown above.[14]
- A more perceptually relevant alternative is to use luma, Y′, as a lightness dimension (fig. 12d). Luma is the weighted average of gamma-corrected R, G, and B, based on their contribution to perceived lightness, long used as the monochromatic dimension in color television broadcast. For sRGB, the Rec. 709 primaries yield Y′709, digital NTSC uses Y′601 according to Rec. 601 and some other primaries are also in use which result in different coefficients.[29][upper-alpha 10]
- (SDTV)
- (Adobe)
- (HDTV)
- (UHDTV, HDR)
All four of these leave the neutral axis alone. That is, for colors with R = G = B, any of the four formulations yields a lightness equal to the value of R, G, or B.
For a graphical comparison, see fig. 13 below.
Saturation
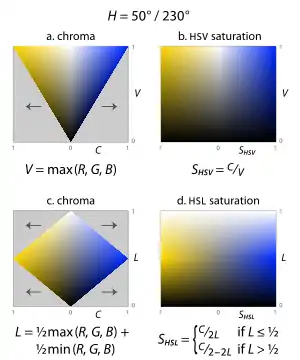
When encoding colors in a hue/lightness/chroma or hue/value/chroma model (using the definitions from the previous two sections), not all combinations of lightness (or value) and chroma are meaningful: that is, half of the colors denotable using H ∈ [0°, 360°), C ∈ [0, 1], and V ∈ [0, 1] fall outside the RGB gamut (the gray parts of the slices in figure 14). The creators of these models considered this a problem for some uses. For example, in a color selection interface with two of the dimensions in a rectangle and the third on a slider, half of that rectangle is made of unused space. Now imagine we have a slider for lightness: the user's intent when adjusting this slider is potentially ambiguous: how should the software deal with out-of-gamut colors? Or conversely, If the user has selected as colorful as possible a dark purple , and then shifts the lightness slider upward, what should be done: would the user prefer to see a lighter purple still as colorful as possible for the given hue and lightness , or a lighter purple of exactly the same chroma as the original color ?[14]
To solve problems such as these, the HSL and HSV models scale the chroma so that it always fits into the range [0, 1] for every combination of hue and lightness or value, calling the new attribute saturation in both cases (fig. 14). To calculate either, simply divide the chroma by the maximum chroma for that value or lightness.
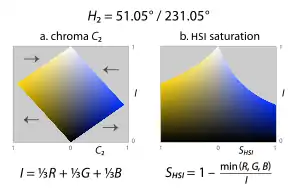
The HSI model commonly used for computer vision, which takes H2 as a hue dimension and the component average I ("intensity") as a lightness dimension, does not attempt to "fill" a cylinder by its definition of saturation. Instead of presenting color choice or modification interfaces to end users, the goal of HSI is to facilitate separation of shapes in an image. Saturation is therefore defined in line with the psychometric definition: chroma relative to lightness (fig. 15). See the Use in image analysis section of this article.[31]
Using the same name for these three different definitions of saturation leads to some confusion, as the three attributes describe substantially different color relationships; in HSV and HSI, the term roughly matches the psychometric definition, of a chroma of a color relative to its own lightness, but in HSL it does not come close. Even worse, the word saturation is also often used for one of the measurements we call chroma above (C or C2).
Examples
All parameter values shown below are given as values in the interval [0, 1], except those for H and H2 which are in the interval [0°, 360°).[upper-alpha 11]
| Color | R | G | B | H | H2 | C | C2 | V | L | I | Y′601 | SHSV | SHSL | SHSI |
|---|---|---|---|---|---|---|---|---|---|---|---|---|---|---|
| #FFFFFF | 1.000 | 1.000 | 1.000 | n/a | n/a | 0.000 | 0.000 | 1.000 | 1.000 | 1.000 | 1.000 | 0.000 | 0.000 | 0.000 |
| #808080 | 0.500 | 0.500 | 0.500 | n/a | n/a | 0.000 | 0.000 | 0.500 | 0.500 | 0.500 | 0.500 | 0.000 | 0.000 | 0.000 |
| #000000 | 0.000 | 0.000 | 0.000 | n/a | n/a | 0.000 | 0.000 | 0.000 | 0.000 | 0.000 | 0.000 | 0.000 | 0.000 | 0.000 |
| #FF0000 | 1.000 | 0.000 | 0.000 | 0.0° | 0.0° | 1.000 | 1.000 | 1.000 | 0.500 | 0.333 | 0.299 | 1.000 | 1.000 | 1.000 |
| #BFBF00 | 0.750 | 0.750 | 0.000 | 60.0° | 60.0° | 0.750 | 0.750 | 0.750 | 0.375 | 0.500 | 0.664 | 1.000 | 1.000 | 1.000 |
| #008000 | 0.000 | 0.500 | 0.000 | 120.0° | 120.0° | 0.500 | 0.500 | 0.500 | 0.250 | 0.167 | 0.293 | 1.000 | 1.000 | 1.000 |
| #80FFFF | 0.500 | 1.000 | 1.000 | 180.0° | 180.0° | 0.500 | 0.500 | 1.000 | 0.750 | 0.833 | 0.850 | 0.500 | 1.000 | 0.400 |
| #8080FF | 0.500 | 0.500 | 1.000 | 240.0° | 240.0° | 0.500 | 0.500 | 1.000 | 0.750 | 0.667 | 0.557 | 0.500 | 1.000 | 0.250 |
| #BF40BF | 0.750 | 0.250 | 0.750 | 300.0° | 300.0° | 0.500 | 0.500 | 0.750 | 0.500 | 0.583 | 0.457 | 0.667 | 0.500 | 0.571 |
| #A0A424 | 0.628 | 0.643 | 0.142 | 61.8° | 61.5° | 0.501 | 0.494 | 0.643 | 0.393 | 0.471 | 0.581 | 0.779 | 0.638 | 0.699 |
| #411BEA | 0.255 | 0.104 | 0.918 | 251.1° | 250.0° | 0.814 | 0.750 | 0.918 | 0.511 | 0.426 | 0.242 | 0.887 | 0.832 | 0.756 |
| #1EAC41 | 0.116 | 0.675 | 0.255 | 134.9° | 133.8° | 0.559 | 0.504 | 0.675 | 0.396 | 0.349 | 0.460 | 0.828 | 0.707 | 0.667 |
| #F0C80E | 0.941 | 0.785 | 0.053 | 49.5° | 50.5° | 0.888 | 0.821 | 0.941 | 0.497 | 0.593 | 0.748 | 0.944 | 0.893 | 0.911 |
| #B430E5 | 0.704 | 0.187 | 0.897 | 283.7° | 284.8° | 0.710 | 0.636 | 0.897 | 0.542 | 0.596 | 0.423 | 0.792 | 0.775 | 0.686 |
| #ED7651 | 0.931 | 0.463 | 0.316 | 14.3° | 13.2° | 0.615 | 0.556 | 0.931 | 0.624 | 0.570 | 0.586 | 0.661 | 0.817 | 0.446 |
| #FEF888 | 0.998 | 0.974 | 0.532 | 56.9° | 57.4° | 0.466 | 0.454 | 0.998 | 0.765 | 0.835 | 0.931 | 0.467 | 0.991 | 0.363 |
| #19CB97 | 0.099 | 0.795 | 0.591 | 162.4° | 163.4° | 0.696 | 0.620 | 0.795 | 0.447 | 0.495 | 0.564 | 0.875 | 0.779 | 0.800 |
| #362698 | 0.211 | 0.149 | 0.597 | 248.3° | 247.3° | 0.448 | 0.420 | 0.597 | 0.373 | 0.319 | 0.219 | 0.750 | 0.601 | 0.533 |
| #7E7EB8 | 0.495 | 0.493 | 0.721 | 240.5° | 240.4° | 0.228 | 0.227 | 0.721 | 0.607 | 0.570 | 0.520 | 0.316 | 0.290 | 0.135 |
Use in end-user software
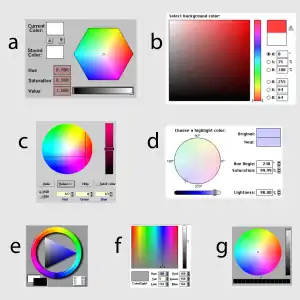
· (a) SGI IRIX 5, c. 1995;
· (b) Adobe Photoshop, c. 1990;
· (c) IBM OS/2 Warp 3, c. 1994;
· (d) Apple Macintosh System 7, c. 1996;
· (e) Fractal Design Painter, c. 1993;
· (f) Microsoft Windows 3.1, c. 1992;
· (g) NeXTSTEP, c. 1995.
These are undoubtedly based on earlier examples, stretching back to PARC and NYIT in the mid-1970s.[upper-alpha 12]
The original purpose of HSL and HSV and similar models, and their most common current application, is in color selection tools. At their simplest, some such color pickers provide three sliders, one for each attribute. Most, however, show a two-dimensional slice through the model, along with a slider controlling which particular slice is shown. The latter type of GUI exhibits great variety, because of the choice of cylinders, hexagonal prisms, or cones/bicones that the models suggest (see the diagram near the top of the page). Several color choosers from the 1990s are shown to the right, most of which have remained nearly unchanged in the intervening time: today, nearly every computer color chooser uses HSL or HSV, at least as an option. Some more sophisticated variants are designed for choosing whole sets of colors, basing their suggestions of compatible colors on the HSL or HSV relationships between them.[upper-alpha 13]
Most web applications needing color selection also base their tools on HSL or HSV, and pre-packaged open source color choosers exist for most major web front-end frameworks. The CSS 3 specification allows web authors to specify colors for their pages directly with HSL coordinates.[upper-alpha 14][32]
HSL and HSV are sometimes used to define gradients for data visualization, as in maps or medical images. For example, the popular GIS program ArcGIS historically applied customizable HSV-based gradients to numerical geographical data.[upper-alpha 15]
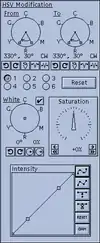 Fig. 17. xv's HSV-based color modifier. |
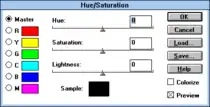 Fig. 18. The hue/saturation tool in Photoshop 2.5, ca. 1992.
|
Image editing software also commonly includes tools for adjusting colors with reference to HSL or HSV coordinates, or to coordinates in a model based on the "intensity" or luma defined above. In particular, tools with a pair of "hue" and "saturation" sliders are commonplace, dating to at least the late-1980s, but various more complicated color tools have also been implemented. For instance, the Unix image viewer and color editor xv allowed six user-definable hue (H) ranges to be rotated and resized, included a dial-like control for saturation (SHSV), and a curves-like interface for controlling value (V)—see fig. 17. The image editor Picture Window Pro includes a "color correction" tool which affords complex remapping of points in a hue/saturation plane relative to either HSL or HSV space.[upper-alpha 16]
Video editors also use these models. For example, both Avid and Final Cut Pro include color tools based on HSL or a similar geometry for use adjusting the color in video. With the Avid tool, users pick a vector by clicking a point within the hue/saturation circle to shift all the colors at some lightness level (shadows, mid-tones, highlights) by that vector.
Since version 4.0, Adobe Photoshop's "Luminosity", "Hue", "Saturation", and "Color" blend modes composite layers using a luma/chroma/hue color geometry. These have been copied widely, but several imitators use the HSL (e.g. PhotoImpact, Paint Shop Pro) or HSV geometries instead.[upper-alpha 17][upper-alpha 18]
Use in image analysis
HSL, HSV, HSI, or related models are often used in computer vision and image analysis for feature detection or image segmentation. The applications of such tools include object detection, for instance in robot vision; object recognition, for instance of faces, text, or license plates; content-based image retrieval; and analysis of medical images.[31]
For the most part, computer vision algorithms used on color images are straightforward extensions to algorithms designed for grayscale images, for instance k-means or fuzzy clustering of pixel colors, or canny edge detection. At the simplest, each color component is separately passed through the same algorithm. It is important, therefore, that the features of interest can be distinguished in the color dimensions used. Because the R, G, and B components of an object's color in a digital image are all correlated with the amount of light hitting the object, and therefore with each other, image descriptions in terms of those components make object discrimination difficult. Descriptions in terms of hue/lightness/chroma or hue/lightness/saturation are often more relevant.[31]
Starting in the late 1970s, transformations like HSV or HSI were used as a compromise between effectiveness for segmentation and computational complexity. They can be thought of as similar in approach and intent to the neural processing used by human color vision, without agreeing in particulars: if the goal is object detection, roughly separating hue, lightness, and chroma or saturation is effective, but there is no particular reason to strictly mimic human color response. John Kender's 1976 master's thesis proposed the HSI model. Ohta et al. (1980) instead used a model made up of dimensions similar to those we have called I, α, and β. In recent years, such models have continued to see wide use, as their performance compares favorably with more complex models, and their computational simplicity remains compelling.[upper-alpha 19][31][39][40][41]
Disadvantages
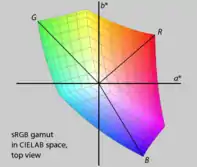
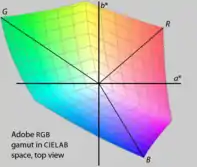
While HSL, HSV, and related spaces serve well enough to, for instance, choose a single color, they ignore much of the complexity of color appearance. Essentially, they trade off perceptual relevance for computation speed, from a time in computing history (high-end 1970s graphics workstations, or mid-1990s consumer desktops) when more sophisticated models would have been too computationally expensive.[upper-alpha 20]
HSL and HSV are simple transformations of RGB which preserve symmetries in the RGB cube unrelated to human perception, such that its R, G, and B corners are equidistant from the neutral axis, and equally spaced around it. If we plot the RGB gamut in a more perceptually-uniform space, such as CIELAB (see below), it becomes immediately clear that the red, green, and blue primaries do not have the same lightness or chroma, or evenly spaced hues. Furthermore, different RGB displays use different primaries, and so have different gamuts. Because HSL and HSV are defined purely with reference to some RGB space, they are not absolute color spaces: to specify a color precisely requires reporting not only HSL or HSV values, but also the characteristics of the RGB space they are based on, including the gamma correction in use.
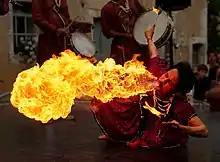
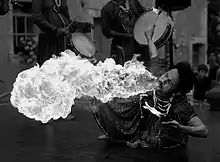
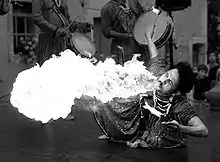
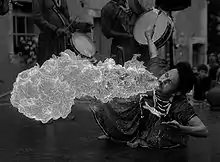
If we take an image and extract the hue, saturation, and lightness or value components, and then compare these to the components of the same name as defined by color scientists, we can quickly see the difference, perceptually. For example, examine the following images of a fire breather (fig. 13). The original is in the sRGB colorspace. CIELAB L* is a CIE-defined achromatic lightness quantity (dependent solely on the perceptually achromatic luminance Y, but not the mixed-chromatic components X or Z, of the CIEXYZ colorspace from which the sRGB colorspace itself is derived), and it is plain that this appears similar in perceptual lightness to the original color image. Luma is roughly similar, but differs somewhat at high chroma, where it deviates most from depending solely on the true achromatic luminance (Y, or equivalently L*) and is influenced by the colorimetric chromaticity (x,y, or equivalently, a*,b* of CIELAB). HSL L and HSV V, by contrast, diverge substantially from perceptual lightness.

_I.jpg.webp)
Though none of the dimensions in these spaces match their perceptual analogs, the value of HSV and the saturation of HSL are particular offenders. In HSV, the blue primary and white are held to have the same value, even though perceptually the blue primary has somewhere around 10% of the luminance of white (the exact fraction depends on the particular RGB primaries in use). In HSL, a mix of 100% red, 100% green, 90% blue—that is, a very light yellow —is held to have the same saturation as the green primary , even though the former color has almost no chroma or saturation by the conventional psychometric definitions. Such perversities led Cynthia Brewer, expert in color scheme choices for maps and information displays, to tell the American Statistical Association:
Computer science offers a few poorer cousins to these perceptual spaces that may also turn up in your software interface, such as HSV and HLS. They are easy mathematical transformations of RGB, and they seem to be perceptual systems because they make use of the hue–lightness/value–saturation terminology. But take a close look; don't be fooled. Perceptual color dimensions are poorly scaled by the color specifications that are provided in these and some other systems. For example, saturation and lightness are confounded, so a saturation scale may also contain a wide range of lightnesses (for example, it may progress from white to green which is a combination of both lightness and saturation). Likewise, hue and lightness are confounded so, for example, a saturated yellow and saturated blue may be designated as the same 'lightness' but have wide differences in perceived lightness. These flaws make the systems difficult to use to control the look of a color scheme in a systematic manner. If much tweaking is required to achieve the desired effect, the system offers little benefit over grappling with raw specifications in RGB or CMY.[42]
If these problems make HSL and HSV problematic for choosing colors or color schemes, they make them much worse for image adjustment. HSL and HSV, as Brewer mentioned, confound perceptual color-making attributes, so that changing any dimension results in non-uniform changes to all three perceptual dimensions, and distorts all of the color relationships in the image. For instance, rotating the hue of a pure dark blue toward green will also reduce its perceived chroma, and increase its perceived lightness (the latter is grayer and lighter), but the same hue rotation will have the opposite impact on lightness and chroma of a lighter bluish-green— to (the latter is more colorful and slightly darker). In the example below (fig. 21), the image on the left (a) is the original photograph of a green turtle. In the middle image (b), we have rotated the hue (H) of each color by −30°, while keeping HSV value and saturation or HSL lightness and saturation constant. In the image on the right (c), we make the same rotation to the HSL/HSV hue of each color, but then we force the CIELAB lightness (L*, a decent approximation of perceived lightness) to remain constant. Notice how the hue-shifted middle version without such a correction dramatically changes the perceived lightness relationships between colors in the image. In particular, the turtle's shell is much darker and has less contrast, and the background water is much lighter.


Because hue is a circular quantity, represented numerically with a discontinuity at 360°, it is difficult to use in statistical computations or quantitative comparisons: analysis requires the use of circular statistics.[43] Furthermore, hue is defined piecewise, in 60° chunks, where the relationship of lightness, value, and chroma to R, G, and B depends on the hue chunk in question. This definition introduces discontinuities, corners which can plainly be seen in horizontal slices of HSL or HSV.[44]
Charles Poynton, digital video expert, lists the above problems with HSL and HSV in his Color FAQ, and concludes that:
HSB and HLS were developed to specify numerical Hue, Saturation and Brightness (or Hue, Lightness and Saturation) in an age when users had to specify colors numerically. The usual formulations of HSB and HLS are flawed with respect to the properties of color vision. Now that users can choose colors visually, or choose colors related to other media (such as PANTONE), or use perceptually-based systems like L*u*v* and L*a*b*, HSB and HLS should be abandoned.[45]
Other cylindrical-coordinate color models
The creators of HSL and HSV were far from the first to imagine colors fitting into conic or spherical shapes, with neutrals running from black to white in a central axis, and hues corresponding to angles around that axis. Similar arrangements date back to the 18th century, and continue to be developed in the most modern and scientific models.
Color conversion formulae
To convert from HSL or HSV to RGB, we essentially invert the steps listed above (as before, R, G, B ∈ [0, 1]). First, we compute chroma, by multiplying saturation by the maximum chroma for a given lightness or value. Next, we find the point on one of the bottom three faces of the RGB cube which has the same hue and chroma as our color (and therefore projects onto the same point in the chromaticity plane). Finally, we add equal amounts of R, G, and B to reach the proper lightness or value.[upper-alpha 7]
HSL to RGB
Given a color with hue H ∈ [0°, 360°], saturation SL ∈ [0, 1], and lightness L ∈ [0, 1], we first find chroma:
Then we can find a point (R1, G1, B1) along the bottom three faces of the RGB cube, with the same hue and chroma as our color (using the intermediate value X for the second largest component of this color):
In the above equation, the notation refers to the remainder of the Euclidean division of by 2. is not necessarily an integer.
When is an integer, the "neighbouring" formula would yield the same result, as or , as appropriate.
Finally, we can find R, G, and B by adding the same amount to each component, to match lightness:
HSL to RGB alternative
The polygonal piecewise functions can be somewhat simplified by a clever use of minimum and maximum values as well as the remainder operation.
Given a color with hue , saturation , and lightness , we first define the function:
where and:
And output R,G,B values (from ) are:
The above alternative formulas allow for shorter implementations. In the above formulas the operation also returns the fractional part of the module e.g. , and .
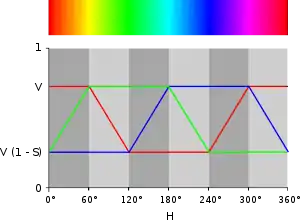
The base shape is constructed as follows: is a "triangle" for which values greater or equal to −1 start from k=2 and end at k=10, and the highest point is at k=6. Then by we change values bigger than 1 to equal 1. Then by we change values less than −1 to equal −1. At this point we get something similar to the red shape from fig. 24 after a vertical flip (where the maximum is 1 and the minimum is −1). The R,G,B functions of use this shape transformed in following way: modulo-shifted on (by ) (differently for R,G,B) scaled on (by ) and shifted on (by ).
We observe following shape properties (Fig. 24 can help to get intuition about them):
HSV to RGB
Given an HSV color with hue H ∈ [0°, 360°], saturation SV ∈ [0, 1], and value V ∈ [0, 1], we can use the same strategy. First, we find chroma:
Then we can, again, find a point (R1, G1, B1) along the bottom three faces of the RGB cube, with the same hue and chroma as our color (using the intermediate value X for the second largest component of this color):
As before, when is an integer, "neighbouring" formulas would yield the same result.
Finally, we can find R, G, and B by adding the same amount to each component, to match value:
HSV to RGB alternative
Given a color with hue , saturation , and value , first we define function :
where and:
And output R,G,B values (from ) are:
Above alternative equivalent formulas allow shorter implementation. In above formulas the returns also fractional part of module e.g. the formula . The values of . The base shape
is constructed as follows: is "triangle" for which non-negative values starts from k=0, highest point at k=2 and "ends" at k=4, then we change values bigger than one to one by , then change negative values to zero by – and we get (for ) something similar to green shape from Fig. 24 (which max value is 1 and min value is 0). The R,G,B functions of use this shape transformed in following way: modulo-shifted on (by ) (differently for R,G,B) scaled on (by ) and shifted on (by ). We observe following shape properties(Fig. 24 can help to get intuition about this):
HSI to RGB
Given an HSI color with hue H ∈ [0°, 360°], saturation SI ∈ [0, 1], and intensity I ∈ [0, 1], we can use the same strategy, in a slightly different order:
Where is the chroma.
Then we can, again, find a point (R1, G1, B1) along the bottom three faces of the RGB cube, with the same hue and chroma as our color (using the intermediate value X for the second largest component of this color):
Overlap (when is an integer) occurs because two ways to calculate the value are equivalent: or , as appropriate.
Finally, we can find R, G, and B by adding the same amount to each component, to match lightness:
Luma, chroma and hue to RGB
Given a color with hue H ∈ [0°, 360°), chroma C ∈ [0, 1], and luma Y′601 ∈ [0, 1],[upper-alpha 21] we can again use the same strategy. Since we already have H and C, we can straightaway find our point (R1, G1, B1) along the bottom three faces of the RGB cube:
Overlap (when is an integer) occurs because two ways to calculate the value are equivalent: or , as appropriate.
Then we can find R, G, and B by adding the same amount to each component, to match luma:
HSV to HSL
Given a color with hue , saturation , and value ,
HSL to HSV
Given a color with hue , saturation , and luminance ,
From RGB
This is a reiteration of the previous conversion.
Value must be in range .
With maximum component (i. e. value)
and minimum component
- ,
range (i. e. chroma)
and mid-range (i. e. lightness)
- ,
we get common hue:
and distinct saturations:
Swatches
Mouse over the swatches below to see the R, G, and B values for each swatch in a tooltip.
HSL
|
| ||||||||||||||||||||||||||||||||||||||||||||||||||||||||||||||||||||||||||||||||||||||||||||||||||||||||||||||||||||||||||||||||||||||||||||||||||||||||||||||||||||||||||||||||||||||||||||||||||||||||||||||||||||||||||||
|
| ||||||||||||||||||||||||||||||||||||||||||||||||||||||||||||||||||||||||||||||||||||||||||||||||||||||||||||||||||||||||||||||||||||||||||||||||||||||||||||||||||||||||||||||||||||||||||||||||||||||||||||||||||||||||||||
|
| ||||||||||||||||||||||||||||||||||||||||||||||||||||||||||||||||||||||||||||||||||||||||||||||||||||||||||||||||||||||||||||||||||||||||||||||||||||||||||||||||||||||||||||||||||||||||||||||||||||||||||||||||||||||||||||
HSV
|
| ||||||||||||||||||||||||||||||||||||||||||||||||||||||||||||||||||||||||||||||||||||||||||||||||||||||||||||||||||||||||||||||||||||||||||||||||||||||||||||||||||||||||||||||||||||||||||||||||||||||||||||||||||||||||||||
|
| ||||||||||||||||||||||||||||||||||||||||||||||||||||||||||||||||||||||||||||||||||||||||||||||||||||||||||||||||||||||||||||||||||||||||||||||||||||||||||||||||||||||||||||||||||||||||||||||||||||||||||||||||||||||||||||
|
| ||||||||||||||||||||||||||||||||||||||||||||||||||||||||||||||||||||||||||||||||||||||||||||||||||||||||||||||||||||||||||||||||||||||||||||||||||||||||||||||||||||||||||||||||||||||||||||||||||||||||||||||||||||||||||||
See also
- TSL color space
Notes
- The Joblove and Greenberg (1978) paper first introducing HSL, they called HSL lightness "intensity", called HSL saturation "relative chroma", called HSV saturation "saturation" and called HSV value "value". They carefully and unambiguously described and compared three models: hue/chroma/intensity, hue/relative chroma/intensity, and hue/value/saturation. Unfortunately, later authors were less fastidious, and current usage of these terms is inconsistent and often misleading.
- The name hexcone for hexagonal pyramid was coined in Smith (1978), and stuck.
- For instance, a 1982 study by Berk, et al., found that users were better at describing colors in terms of HSL than RGB coordinates, after being taught both systems, but were much better still at describing them in terms of the natural-language CNS model (which uses names such as "very dark grayish yellow-green" or "medium strong bluish purple"). This shouldn't be taken as gospel however: a 1987 study by Schwarz, et al., found that users could match colors using RGB controls faster than with HSL controls; a 1999 study by Douglas and Kirkpatrick found that the visual feedback in the user interface mattered more than the particular color model in use, for user matching speed.[10][11][12]
- "Clearly, if color appearance is to be described in a systematic, mathematical way, definitions of the phenomena being described need to be precise and universally agreed upon."[19]
- In Levkowitz and Herman’s formulation, R, G, and B stand for the voltages on the guns of a CRT display, which might have different maxima, and so their cartesian gamut could be a box of any unequal dimensions. Other definitions commonly use integer values in the range [0, 255], storing the value for each component in one byte. We define the RGB gamut to be a unit cube for convenience because it simplifies and clarifies the math. Also, in general, HSL and HSV are today computed directly from gamma-corrected R′, G′, and B′—for instance in sRGB space—but, when the models were developed, might have been transformations of a linear RGB space. Early authors don’t address gamma correction at all, except Alvy Ray Smith[13] who clearly states that "We shall assume that an RGB monitor is a linear device", and thus designed HSV using linear RGB. We will drop the primes, and the labels R, G, and B should be taken to stand for the three attributes of the origin RGB space, whether or not it is gamma corrected.
- Using the chroma here not only agrees with the original Joblove and Greenberg (1978) paper, but is also in the proper spirit of the psychometric definition of the term. Some models call this attribute saturation—for instance Adobe Photoshop's "Saturation" blend mode—but such use is even more confusing than the use of the term in HSL or HSV, especially when two substantially different definitions are used side by side.
- Most of the computer graphics papers and books discussing HSL or HSV have a formula or algorithm describing them formally. Our formulas which follow are some mix of those. See, for instance, Agoston (2005) or Foley (1995)
- Hanbury and Serra (2002) put a great deal of effort into explaining why what we call chroma here can be written as max(R, G, B) − min(R, G, B), and showing that this value is a seminorm. They reserve the name chroma for the Euclidean norm in the chromaticity plane (our C2), and call this hexagonal distance saturation instead, as part of their IHLS model
- In the following, the multiplication of hue by 60°—that is, 360°/6—can be seen as the hexagonal-geometry analogue of the conversion from radians to degrees, a multiplication by 360°/2π: the circumference of a unit circle is 2π; the circumference of a unit hexagon is 6.
- For a more specific discussion of the term luma, see Charles Poynton (2008). See also RGB color space#Specifications. Photoshop exclusively uses the NTSC coefficients for its "Luminosity" blend mode regardless of the RGB color space involved.[30]
- The first nine colors in this table were chosen by hand, and the last ten colors were chosen at random.
- See Smith (1978). Many of these screenshots were taken from the GUIdebook, and the rest were gathered from image search results.
- For instance, a tool in Illustrator CS4, and Adobe's related web tool, Kuler, both allow users to define color schemes based on HSV relationships, but with a hue circle modified to better match the RYB model used traditionally by painters. The web tools ColorJack, Color Wizard, and ColorBlender all pick color schemes with reference to HSL or HSV.
- Try a web search for "[framework name] color picker" for examples for a given framework, or "JavaScript color picker" for general results.
- ArcGIS calls its map-symbol gradients "color ramps". Current versions of ArcGIS can use CIELAB instead for defining them.[33]
- For instance, the first version of Photoshop had an HSL-based tool; see "Photoshop hue/saturation" in the GUIdebook for screenshots.[34][35]
- Photoshop's documentation explains that, e.g., "Luminosity: Creates a result color with the hue and saturation of the base color and the luminance of the blend color."[36]
- The HSL-style mode (with a Rec. 601 Luminosity) are also standardized in CSS from a documentation contributed by Adobe and Canon.[37] GIMP 2.10 has switched to LCH(ab) from its older HSV geometry.[38]
- The Ohta et al. model has parameters I1 = (R + G + B)/3, I2 = (R − B)/2, I3 = (2G − R − B)/4. I1 is the same as our I, and I2 and I3 are similar to our β and α, respectively, except that (a) where α points in the direction of R in the "chromaticity plane", I3 points in the direction of G, and (b) the parameters have a different linear scaling which avoids the √3 of our β.
- Most of the disadvantages below are listed in Poynton (1997), though as mere statements, without examples.
- Some points in this cylinder fall out of gamut.
References
- "HSL Colors". CSS Color Module Level 4 (Working draft). World Wide Web Consortium. Retrieved 27 January 2022.
- Ihaka R, Murrell P, Hornik K, Fisher JC, Stauffer R, Wilke CO, McWhite CD, Zeileis A. Color Spaces: S4 Classes and Utilities. R Project: colorspace package (Article). Retrieved 27 January 2022.
- Ottosson, Björn (8 September 2021). "Okhsv and Okhsl" (Blog post). GitHub. Retrieved 27 January 2022.
- FR patent 841335, Valensi, Georges, "Procédé de télévision en couleurs", published 1939-05-17, issued 1939-02-06
- US patent 2375966, Valensi, Georges, "System of television in colors", published 1945-05-15
- Levkowitz and Herman (1993)
- Wilhelm Ostwald (1916). Die Farbenfibel. Leipzig.
- Wilhelm Ostwald (1918). Die Harmonie der Farben. Leipzig.
- US patent 4694286, Bergstedt, Gar A., "Apparatus and method for modifying displayed color images", published 1987-09-15, assigned to Tektronix, Inc
- Toby Berk; Arie Kaufman; Lee Brownston (August 1982). "A human factors study of color notation systems for computer graphics". Communications of the ACM. 25 (8): 547–550. doi:10.1145/358589.358606. S2CID 14838329.
- Michael W. Schwarz; William B. Cowan; John C. Beatty (April 1987). "An experimental comparison of RGB, YIQ, LAB, HSV, and opponent color models". ACM Transactions on Graphics. 6 (2): 123–158. doi:10.1145/31336.31338. S2CID 17287484.
- Sarah A. Douglas; Arthur E. Kirkpatrick (April 1999). "Model and representation: the effect of visual feedback on human performance in a color picker interface". ACM Transactions on Graphics. 18 (2): 96–127. doi:10.1145/318009.318011. S2CID 14678328.
- Smith (1978)
- Joblove and Greenberg (1978)
- Maureen C. Stone (August 2001). "A Survey of Color for Computer Graphics". Course at SIGGRAPH 2001.
- Ware Myers (July 1979). "Interactive Computer Graphics: Flying High-Part I". Computer. 12 (7): 8–17. doi:10.1109/MC.1979.1658808. S2CID 15344162.
- N. Magnetat-Thalmann; N. Chourot; D. Thalmann (March 1984). "Colour Gradation, Shading and Texture Using a Limited Terminal". Computer Graphics Forum. 3: 83–90. doi:10.1111/j.1467-8659.1984.tb00092.x. S2CID 29541525.
- Computer Graphics Staff (August 1979). "Status Report of the Graphics Standards Planning Committee". ACM SIGGRAPH Computer Graphics. 13 (3): 1–10. doi:10.1145/988497.988498. S2CID 43687764.
- Fairchild (2005), pp. 83–93
- Kuehni (2003)
- Standard Terminology of Appearance E284. ASTM. 2009.
- International Lighting Vocabulary (4th ed.). CIE and IEC. 1987. ISBN 978-3-900734-07-7. Archived from the original on 2010-02-27. Retrieved 2010-02-05.
- Poynton (1997)
- Sharma, G. (2003). Digital Color Imaging Handbook. Boca Raton, FL: CRC Press. ISBN 978-0-8493-0900-7.
- Hanbury and Serra (2002)
- Hanbury (2008)
- Patrick Lambert; Thierry Carron (1999). "Symbolic fusion of luminance-hue-chroma features for region segmentation". Pattern Recognition. 32 (11): 1857. doi:10.1016/S0031-3203(99)00010-2.
- Rafael C. Gonzalez and Richard Eugene Woods (2008). Digital Image Processing, 3rd ed. Upper Saddle River, NJ: Prentice Hall. ISBN 0-13-168728-X. pp. 407–413.
- Poynton (1997). "What weighting of red, green and blue corresponds to brightness?"
- Bruce Lindbloom (2001-09-25). http://lists.apple.com/archives/colorsync-users/2001/Sep/msg00488.html "Re: Luminosity channel...".
- Cheng et al. (2001)
- Tantek Çelik, Chris Lilley, and L. David Baron (July 2008). "CSS3 Color Module Level 3".
- "Working with color ramps". Environmental Systems Research Institute. January 2008. Retrieved August 30, 2017.
- Bradley, John (1994). "The HSV Modification Tools". John's World of XV and Other Cool Stuff.
- Sinkel, Kiril (January 2010). "User Guide for Picture Window and Picture Window Pro Digital Light & Color" (PDF). Archived from the original (PDF) on 2014-05-12.
- "Blending Modes". Photoshop User Guide. Adobe Systems Incorporated. February 15, 2017.
- "Compositing and Blending Level 1". www.w3.org.
- "GIMP's LCH Blend Modes". Nine Degrees Below.
- John Kender (1976). "Saturation, hue and normalized color". Carnegie Mellon University, Computer Science Dept. Pittsburgh, PA.
- Yu-Ichi Ohta; Takeo Kanade; Toshiyuki Sakai (1980). "Color information for region segmentation". Computer Graphics and Image Processing. 13 (3): 222. doi:10.1016/0146-664X(80)90047-7.
- Ffrank Perez; Christof Koch (1994). "Toward color image segmentation in analog VLSI: Algorithm and hardware" (PDF). International Journal of Computer Vision. 12: 17–42. doi:10.1007/BF01420983. S2CID 6140819.
- Brewer, Cynthia A. (1999). "Color Use Guidelines for Data Representation". Proceedings of the Section on Statistical Graphics. Alexandria, VA: American Statistical Association. pp. 55–60.
- Fisher, Nicholas (1996). Statistical Analysis of Circular Data. Cambridge, England: Cambridge University Press.
- Hanbury, Allan (2003). Circular Statistics Applied to Colour Images. 8th Computer Vision Winter Workshop. CiteSeerX 10.1.1.4.1381.
- Poynton (1997). "What are HSB and HLS?"
Bibliography
- Agoston, Max K. (2005). Computer Graphics and Geometric Modeling: Implementation and Algorithms. London: Springer. pp. 300–306. ISBN 978-1-85233-818-3. Agoston's book contains a description of HSV and HSL, and algorithms in pseudocode for converting to each from RGB, and back again.
- Cheng, Heng-Da; Jiang, Xihua; Sun, Angela; Wang, Jingli (2001). "Color image segmentation: Advances and prospects". Pattern Recognition. 34 (12): 2259. CiteSeerX 10.1.1.119.2886. doi:10.1016/S0031-3203(00)00149-7. This computer vision literature review briefly summarizes research in color image segmentation, including that using HSV and HSI representations.
- Fairchild, Mark D. (2005). Color Appearance Models (2nd ed.). Addison-Wesley. This book doesn't discuss HSL or HSV specifically, but is one of the most readable and precise resources about current color science.
- Foley, J. D.; et al. (1995). Computer Graphics: Principles and Practice (2nd ed.). Redwood City, CA: Addison-Wesley. ISBN 978-0-201-84840-3. The standard computer graphics textbook of the 1990s, this tome has a chapter full of algorithms for converting between color models, in C.
- Hanbury, Allan; Serra, Jean (December 2002). A 3D-polar Coordinate Colour Representation Suitable for Image Analysis. Pattern Recognition and Image Processing Group Technical Report 77. Vienna, Austria: Vienna University of Technology.
- Hanbury, Allan (2008). "Constructing cylindrical coordinate colour spaces" (PDF). Pattern Recognition Letters. 29 (4): 494–500. CiteSeerX 10.1.1.211.6425. doi:10.1016/j.patrec.2007.11.002.
- Joblove, George H.; Greenberg, Donald (August 1978). "Color spaces for computer graphics" (PDF). Computer Graphics. 12 (3): 20–25. doi:10.1145/965139.807362. Joblove and Greenberg's paper was the first describing the HSL model, which it compares to HSV.
- Kuehni, Rolf G. (2003). Color Space and Its Divisions: Color Order from Antiquity to the present. New York: Wiley. ISBN 978-0-471-32670-0. This book only briefly mentions HSL and HSV, but is a comprehensive description of color order systems through history.
- Levkowitz, Haim; Herman, Gabor T. (1993). "GLHS: A Generalized Lightness, Hue and Saturation Color Model". CVGIP: Graphical Models and Image Processing. 55 (4): 271–285. doi:10.1006/cgip.1993.1019. This paper explains how both HSL and HSV, as well as other similar models, can be thought of as specific variants of a more general "GLHS" model. Levkowitz and Herman provide pseudocode for converting from RGB to GLHS and back.
- MacEvoy, Bruce (January 2010). "Color Vision". handprint.com.. Especially the sections about "Modern Color Models" and "Modern Color Theory". MacEvoy's extensive site about color science and paint mixing is one of the best resources on the web. On this page, he explains the color-making attributes, and the general goals and history of color order systems—including HSL and HSV—and their practical relevance to painters.
- Poynton, Charles (1997). "Frequently Asked Questions About Color". poynton.com. This self-published frequently asked questions page, by digital video expert Charles Poynton, explains, among other things, why in his opinion these models "are useless for the specification of accurate color", and should be abandoned in favor of more psychometrically relevant models.
- Poynton, Charles (2008). "YUV and luminance considered harmful". poynton.com. Retrieved August 30, 2017.
- Smith, Alvy Ray (August 1978). "Color gamut transform pairs". Computer Graphics. 12 (3): 12–19. doi:10.1145/965139.807361. This is the original paper describing the "hexcone" model, HSV. Smith was a researcher at NYIT's Computer Graphics Lab. He describes HSV's use in an early digital painting program.
External links
- Demonstrative color conversion applet
- HSV Colors by Hector Zenil, The Wolfram Demonstrations Project.
- HSV to RGB by CodeBeautify.