Demographics of Canada
Statistics Canada conducts a country-wide census that collects demographic data every five years on the first and sixth year of each decade. The 2021 Canadian Census enumerated a total population of 36,991,981, an increase of around 5.2 percent over the 2016 figure.[1] Between 2011 and May 2016, Canada's population grew by 1.7 million people, with immigrants accounting for two-thirds of the increase.[2] Between 1990 and 2008, the population increased by 5.6 million, equivalent to 20.4 percent overall growth.[3] The main driver of population growth is immigration and, to a lesser extent, natural growth.[4]
| Demographics of Canada | |
|---|---|
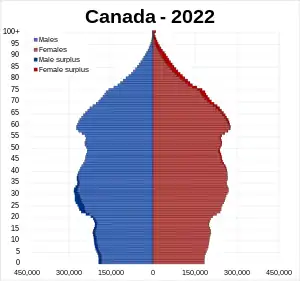 Population pyramid of Canada in 2022 | |
| Population | 38,232,593 (2022) |
| Growth rate | 0.75% (2022 est.) |
| Birth rate | 10.17 births/1,000 population (2022 est.) |
| Death rate | 8.12 deaths/1,000 population (2022 est.) |
| Life expectancy | 83.8 years |
| • male | 81.52 years |
| • female | 86.21 years (2022 est.) |
| Fertility rate | 1.57 children born/woman (2022 est.) |
| Infant mortality rate | 4.38 deaths/1,000 live births |
| Net migration rate | 5.46 migrant(s)/1,000 population (2022 est.) |
| Age structure | |
| 0–14 years | 15.99% |
| 65 and over | 18.98% |
| Sex ratio | |
| Total | 0.98 male(s)/female (2022 est.) |
| At birth | 1.05 male(s)/female |
| Under 15 | 1.06 male(s)/female |
| 65 and over | 0.75 male(s)/female |
| Nationality | |
| Nationality | Canadian |
| Major ethnic | European Canadians (72.9%) |
| Minor ethnic | Asian Canadians (17.7%) Indigenous Canadians (4.9%) Black Canadians (3.1%) Latin American Canadians (1.3%) |
| Language | |
| Official | English (55.97%) French (20.61%) |
| Spoken | Mandarin (1.7%) Cantonese (1.63%) Punjabi (1.44%) Spanish (1.32%) Tagalog (1.24%) Arabic (1.21%) German (1.1%) Italian (1.08%) Others (12.7%) |
| Language figures are from the 2016 Canadian census and based on total number of first language speakers (mother tongue), and not total number of individuals who may speak the language as a second (L2), third (L3), or more language. See knowledge of languages for this information. | |

Canada has one of the highest per-capita immigration rates in the world,[5] driven mainly by economic policy and, to a lesser extent, family reunification.[6][7] In 2019, a total of 341,180 immigrants were admitted to Canada, mainly from Asia.[8] New immigrants settle mostly in major urban areas such as Toronto, Montreal and Vancouver.[9] Canada also accepts large numbers of refugees,[10] accounting for over 10 percent of annual global refugee resettlements.[11][12]
Population
.svg.png.webp)
The Canada 2021 Census had a total population count of 36,991,981 individuals, making up approximately 0.5% of the world's total population.[1][13] A population estimate for 2022 put the total number of people in Canada at 38,232,593.[14]
Demographic statistics according to the World Population Review in 2022.[15]
- One birth every 1 minutes
- One death every 2 minutes
- One net migrant every 2 minutes
- Net gain of one person every 2 minutes
Death rate
- 8.12 deaths/1,000 population (2022 est.) Country comparison to the world: 81
Net migration rate
- 5.46 migrant(s)/1,000 population (2022 est.) Country comparison to the world: 21st
Urbanization
- urban population: 81.8% of total population (2022)
- rate of urbanization: 0.95% annual rate of change (2020-25 est.)
Provinces and territories
| Population | Name[17] | Population, 2021 Census |
Growth, 2016–21 |
Land area (km2) |
Population density (per km2) |
House of Commons seats |
Senate seats | |||
|---|---|---|---|---|---|---|---|---|---|---|
| Total | Proportion | Total | Proportion | Total | Proportion | |||||
| 1 | Ontario | 14,223,942 | 38.45% | 5.8% | 908,699.33 | 15.2 | 121 | 35.8% | 24 | 22.86% |
| 2 | Quebec | 8,501,833 | 22.98% | 4.1% | 1,356,625.27 | 6.5 | 78 | 23.1% | 24 | 22.86% |
| 3 | British Columbia | 5,000,879 | 13.52% | 7.6% | 922,503.01 | 5.4 | 42 | 12.4% | 6 | 5.71% |
| 4 | Alberta | 4,262,635 | 11.52% | 4.8% | 640,330.46 | 6.7 | 34 | 10.1% | 6 | 5.71% |
| 5 | Manitoba | 1,342,153 | 3.63% | 5.8% | 552,370.99 | 2.3 | 14 | 4.1% | 6 | 5.71% |
| 6 | Saskatchewan | 1,132,505 | 3.06% | 3.4% | 588,243.54 | 2.0 | 14 | 4.1% | 6 | 5.71% |
| 7 | Nova Scotia | 969,383 | 2.62% | 5.0% | 52,942.27 | 18.4 | 11 | 3.3% | 10 | 9.52% |
| 8 | New Brunswick | 775,610 | 2.09% | 3.8% | 71,388.81 | 10.9 | 10 | 3.0% | 10 | 9.52% |
| 9 | Newfoundland and Labrador | 510,550 | 1.38% | -1.8% | 370,514.08 | 1.4 | 7 | 2.1% | 6 | 5.71% |
| 10 | Prince Edward Island | 154,331 | 0.42% | 8.0% | 5,686.03 | 27.2 | 4 | 1.2% | 4 | 3.81% |
| 11 | Northwest Territories | 41,070 | 0.11% | -1.7% | 1,143,793.86 | 0.04 | 1 | 0.3% | 1 | 0.95% |
| 12 | Yukon | 40,232 | 0.11% | 12.1% | 474,712.68 | 0.08 | 1 | 0.3% | 1 | 0.95% |
| 13 | Nunavut | 36,858 | 0.10% | 2.5% | 1,877,778.53 | 0.02 | 1 | 0.3% | 1 | 0.95% |
| Total | Totals | 36,991,981 | 100% | 5.2% | 8,965,588.85 | 4.2 | 338 | 100% | 105 | 100% |
Population distribution
The vast majority of Canadians are positioned in a discontinuous band within approximately 300 km of the southern border with the United States; the most populated province is Ontario, followed by Quebec and British Columbia.
Cities
| Rank | Name | Province | Pop. | Rank | Name | Province | Pop. | ||
|---|---|---|---|---|---|---|---|---|---|
| 1 | Toronto | Ontario | 2,794,356 | 11 | Quebec City | Quebec | 549,459 | ||
| 2 | Montreal | Quebec | 1,762,949 | 12 | Surrey | British Columbia | 568,322 | ||
| 3 | Calgary | Alberta | 1,306,784 | 13 | Laval | Quebec | 438,366 | ||
| 4 | Ottawa | Ontario | 1,017,449 | 14 | Halifax | Nova Scotia | 439,819 | ||
| 5 | Edmonton | Alberta | 1,010,899 | 15 | London | Ontario | 422,324 | ||
| 6 | Winnipeg | Manitoba | 749,607 | 16 | Markham | Ontario | 338,503 | ||
| 7 | Mississauga | Ontario | 717,961 | 17 | Vaughan | Ontario | 323,103 | ||
| 8 | Vancouver | British Columbia | 662,248 | 18 | Gatineau | Quebec | 291,041 | ||
| 9 | Brampton | Ontario | 656,480 | 19 | Saskatoon | Saskatchewan | 266,141 | ||
| 10 | Hamilton | Ontario | 569,353 | 20 | Kitchener | Ontario | 256,885 | ||
Census metropolitan areas
Largest metropolitan areas in Canada 2021 Canadian census | |||||||||
|---|---|---|---|---|---|---|---|---|---|
| Rank | Name | Province | Pop. | Rank | Name | Province | Pop. | ||
| 1 | Toronto | Ontario | 6,202,225 | 11 | London | Ontario | 543,551 | ||
| 2 | Montreal | Quebec | 4,291,732 | 12 | Halifax | Nova Scotia | 465,703 | ||
| 3 | Vancouver | British Columbia | 2,642,825 | 13 | St. Catharines–Niagara | Ontario | 433,604 | ||
| 4 | Ottawa–Gatineau | Ontario–Quebec | 1,488,307 | 14 | Windsor | Ontario | 422,630 | ||
| 5 | Calgary | Alberta | 1,481,806 | 15 | Oshawa | Ontario | 415,311 | ||
| 6 | Edmonton | Alberta | 1,418,118 | 16 | Victoria | British Columbia | 397,237 | ||
| 7 | Quebec City | Quebec | 839,311 | 17 | Saskatoon | Saskatchewan | 317,480 | ||
| 8 | Winnipeg | Manitoba | 834,678 | 18 | Regina | Saskatchewan | 249,217 | ||
| 9 | Hamilton | Ontario | 785,184 | 19 | Sherbrooke | Quebec | 227,398 | ||
| 10 | Kitchener–Cambridge–Waterloo | Ontario | 575,847 | 20 | Kelowna | British Columbia | 222,162 | ||
Fertility rate
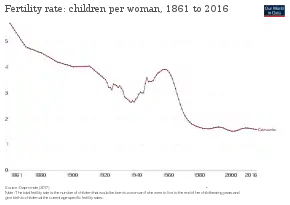
The total fertility rate is the number of children born in a specific year cohort to the total number of women who can give birth in the country.
In 1971, the birth rate for the first time tipped below replacement[21][22] and since then has not rebounded.[21]
The current fertility rate of Canada is 1.57 children per woman.[14] The total birth rate is 10.17 births/1,000 population in 2022.[14]
| Total fertility rate | Years[23] | |||||||||
|---|---|---|---|---|---|---|---|---|---|---|
| 1861 | 1862 | 1863 | 1864 | 1865 | 1866 | 1867 | 1868 | 1869 | 1870 | |
| 5.72 | 5.63 | 5.54 | 5.44 | 5.35 | 5.26 | 5.17 | 5.07 | 4.98 | 4.89 | |
| 1871 | 1872 | 1873 | 1874 | 1875 | 1876 | 1877 | 1878 | 1879 | 1880 | |
| 4.83 | 4.77 | 4.75 | 4.72 | 4.7 | 4.68 | 4.65 | 4.63 | 4.6 | 4.53 | |
| 1881 | 1882 | 1883 | 1884 | 1885 | 1886 | 1887 | 1888 | 1899 | 1890 | |
| 4.56 | 4.52 | 4.49 | 4.45 | 4.42 | 4.38 | 4.35 | 4.31 | 4.27 | 4.24 | |
| 1891 | 1892 | 1893 | 1894 | 1895 | 1896 | 1897 | 1898 | 1899 | 1900 | |
| 4.2 | 4.19 | 4.17 | 4.15 | 4.13 | 4.11 | 4.1 | 4.08 | 4.06 | 4.04 | |
| 1901 | 1902 | 1903 | 1904 | 1905 | 1906 | 1907 | 1908 | 1909 | 1910 | |
| 4.02 | 4.03 | 4.03 | 4.03 | 4.03 | 4.04 | 4.04 | 4.04 | 4.04 | 4.05 | |
| 1911 | 1912 | 1913 | 1914 | 1915 | 1916 | 1917 | 1918 | 1919 | 1920 | |
| 4.05 | 4 | 3.95 | 3.89 | 3.84 | 3.79 | 3.74 | 3.68 | 3.63 | 3.58 | |
| 1921 | 1922 | 1923 | 1924 | 1925 | 1926 | 1927 | 1928 | 1929 | 1930 | |
| 3.53 | 3.4 | 3.23 | 3.22 | 3.13 | 3.35 | 3.32 | 3.29 | 3.22 | 3.28 | |
| 1931 | 1932 | 1933 | 1934 | 1935 | 1936 | 1937 | 1938 | 1939 | 1940 | |
| 3.19 | 3.08 | 2.86 | 2.8 | 2.75 | 2.69 | 2.64 | 2.7 | 2.65 | 2.76 | |
| 1941 | 1942 | 1943 | 1944 | 1945 | 1946 | 1947 | 1948 | 1949 | 1950 | |
| 2.82 | 2.96 | 3.04 | 3 | 3.01 | 3.37 | 3.59 | 3.44 | 3.45 | 3.45 | |
| 1961 | 1971 | 1981 | 1991 | 2001 | 2006 | 2011 | 2016 | - | - | |
| 3.81 | 2.11 | 1.65 | 1.67 | 1.52 | 1.6 | 1.63 | 1.58 | - | - | |
Mother's mean age at first birth
In 2019, the average age of which a woman in Canada gives birth is 29.4 years.
| Average age of childbirth at first birth[22] | Year | ||||||||||
|---|---|---|---|---|---|---|---|---|---|---|---|
| 1945 | 1946 | 1947 | 1948 | 1949 | 1950 | 1951 | 1952 | 1953 | 1954 | 1955 | |
| 25.2 | 25.1 | 24.9 | 24.7 | 24.6 | 24.5 | 24.3 | 24.2 | 24.2 | 24.1 | 24.1 | |
| 1956 | 1957 | 1958 | 1959 | 1960 | 1961 | 1962 | 1963 | 1964 | 1965 | 1966 | |
| 24 | 23.9 | 23.8 | 23.7 | 23.7 | 23.6 | 23.6 | 23.6 | 23.6 | 23.5 | 23.5 | |
| 1967 | 1968 | 1969 | 1970 | 1971 | 1972 | 1973 | 1974 | 1975 | 1976 | 1977 | |
| 23.6 | 23.6 | 23.7 | 23.7 | 23.9 | 24 | 24.1 | 24.3 | 24.3 | 24.4 | 24.5 | |
| 1978 | 1979 | 1980 | 1981 | 1982 | 1983 | 1984 | 1985 | 1986 | 1987 | 1988 | |
| 24.7 | 24.8 | 24.9 | 25 | 25.1 | 25.3 | 25.4 | 25.5 | 25.6 | 25.7 | 25.8 | |
| 1989 | 1990 | 1991 | 1992 | 1993 | 1994 | 1995 | 1996 | 1997 | 1998 | 1999 | |
| 25.8 | 25.9 | 25.9 | 26.1 | 26.3 | 26.2 | 26.3 | 26.5 | 26.7 | 26.8 | 27 | |
| 2000 | 2001 | 2002 | 2003 | 2004 | 2005 | 2006 | 2007 | 2008 | 2009 | 2010 | |
| 27.1 | 27.3 | 27.5 | 27.8 | 27.9 | 28 | 28 | 28.1 | 28.1 | 28.2 | 28.4 | |
| 2011 | |||||||||||
| 28.5 | |||||||||||
Family size
The average family size in Canada has shifted more towards either childless couples or couples who have either 1 to 2 children at a maximum.
Population projection
According to Organisation for Economic Co-operation and Development (OECD)/World Bank, the population in Canada increased from 1990 to 2008 with 5.6 million and 20.4% growth in population, compared to 21.7% growth in the United States and 31.2% growth in Mexico. According to the OECD/World Bank population statistics, for the same period the world population growth was 27%, a total of 1,423 million people.[24] However, over the same period, the population of France grew by 8.0%. And from 1991 to 2011, the population of the UK increased by 10.0%.
The current population growth rate for Canada in 2022 was 0.75%.[14]
| |||||||||||||||||||||
|
| ||||||||||||||||||
Life expectancy

Life expectancy in Canada has consistently risen since the country's formation.
| Life expectancy | Year[29] | |||||||||
|---|---|---|---|---|---|---|---|---|---|---|
| 1831 | 1841 | 1851 | 1861 | 1871 | 1881 | 1891 | 1901 | 1911 | ||
| 39.0 | 40.3 | 41.0 | 41.6 | 42.6 | 44.7 | 45.2 | 48.6 | 52.5 | ||
| 1921 | 1922 | 1923 | 1924 | 1925 | 1926 | 1927 | 1928 | 1929 | ||
| 57.0 | 57.0 | 56.9 | 58.8 | 59.2 | 57.2 | 58.6 | 58.4 | 57.9 | ||
| 1930 | 1931 | 1932 | 1933 | 1934 | 1935 | 1936 | 1937 | 1938 | 1939 | |
| 58.9 | 60.3 | 61.4 | 62.3 | 62.7 | 62.4 | 62.7 | 61.3 | 63.3 | 63.7 | |
| 1940 | 1941 | 1942 | 1943 | 1944 | 1945 | 1946 | 1947 | 1948 | 1949 | |
| 64.0 | 63.7 | 64.6 | 64.6 | 65.3 | 66.3 | 66.5 | 66.7 | 67.3 | 67.6 | |
| 1950 | 1950 - 55 | 1955 - 60 | 1960 - 65 | 1965 - 70 | 1970 - 75 | 1975 - 80 | 1980 - 85 | 1985 - 90 | ||
| 68.2 | 69.1 | 70.3 | 71.3 | 72.2 | 73.0 | 74.3 | 75.9 | 76.8 | ||
| 1990 - 95 | 1995 - 2000 | 2000 - 2005 | 2005 - 2010 | 2010 - 2015 | 2015 - 2020 | |||||
| 77.8 | 78.6 | 79.7 | 80.8 | 81.8 | 83.7 | |||||
School life expectancy (primary to tertiary education)
- total: 16 years
- male: 16 years
- female: 17 years (2016)
Infant mortality rate
- total: 4.5 deaths/1,000 live births. Country comparison to the world: 180th
- male: 4.8 deaths/1,000 live births
- female: 4.2 deaths/1,000 live births (2017 est.)

Age characteristics
| Age group | Male | Female | Total | Percent |
|---|---|---|---|---|
| 0 to 4 years | 973,030 | 925,760 | 1,898,790 | 5.4% |
| 5 to 9 years | 1,034,685 | 983,445 | 2,018,130 | 5.7% |
| 10 to 14 years | 985,200 | 937,445 | 1,922,645 | 5.5% |
| 15 to 19 years | 1,039,215 | 986,940 | 2,026,160 | 5.8% |
| 20 to 24 years | 1,144,495 | 1,098,200 | 2,242,690 | 6.4% |
| 25 to 29 years | 1,144,470 | 1,141,515 | 2,285,990 | 6.5% |
| 30 to 34 years | 1,148,290 | 1,181,110 | 2,329,395 | 6.6% |
| 35 to 39 years | 1,118,635 | 1,169,730 | 2,288,365 | 6.5% |
| 40 to 44 years | 1,104,440 | 1,150,695 | 2,255,135 | 6.4% |
| 45 to 49 years | 1,157,760 | 1,202,210 | 2,359,965 | 6.7% |
| 50 to 54 years | 1,318,755 | 1,359,320 | 2,678,075 | 7.6% |
| 55 to 59 years | 1,285,190 | 1,335,055 | 2,620,240 | 7.5% |
| 60 to 64 years | 1,114,885 | 1,175,630 | 2,290,510 | 6.5% |
| 65 to 69 years | 953,075 | 1,019,405 | 1,972,480 | 5.6% |
| 70 to 74 years | 677,975 | 742,900 | 1,420,875 | 4% |
| 75 to 79 years | 469,550 | 552,300 | 1,021,850 | 2.9% |
| 80 to 84 years | 325,765 | 423,880 | 749,650 | 2.1% |
| 85 years and over | 268,790 | 501,990 | 770,780 | 2.2% |
| Total | 16,414,225 | 17,062,460 | 33,476,685 | 100% |
| 0 to 14 years | 2,992,920 | 2,846,645 | 5,839,565 | 16.6% |
| 15 to 64 years | 11,576,130 | 11,800,400 | 23,376,530 | 66.5% |
| 65 years and over | 2,695,150 | 3,240,485 | 5,935,630 | 16.9% |
Age structure[14]
- 0-14 years: 15.99% (male 3,094,008/female 2,931,953)
- 15-24 years: 11.14% (male 2,167,013/female 2,032,064)
- 25-54 years: 39.81% (male 7,527,554/female 7,478,737)
- 55-64 years: 14.08% (male 2,624,474/female 2,682,858)
- 65 years and over: 18.98% (male 3,274,298/female 3,881,126) (2020 est.)
Median age
- total: 41.8 years. Country comparison to the world: 40th
- male: 40.6 years
- female: 42.9 years (2020 est.)
- total: 40.6 years
- male: 39.6 years
- female: 41.5 years (2011)
- Median age by province and territory in 2011[31]
- Newfoundland and Labrador: 44.0
- Nova Scotia: 43.7
- New Brunswick:43.7
- Prince Edward Island: 42.8
- Quebec: 41.9
- British Columbia: 41.9
- Ontario: 40.4
- Yukon: 39.1
- Manitoba: 38.4
- Saskatchewan: 38.2
- Alberta: 36.5
- Northwest Territories: 32.3
- Nunavut: 24.1
Sex ratio
at birth: 1.05 male(s)/female
0-14 years: 1.06 male(s)/female
15-24 years: 1.06 male(s)/female
25-54 years: 1.01 male(s)/female
55-64 years: 0.98 male(s)/female
65 years and over: 0.75 male(s)/female
total population: 0.98 male(s)/female (2022 est.
Dependency ratios
- total dependency ratio: 47.3
- youth dependency ratio: 23.5
- elderly dependency ratio: 23.8
- potential support ratio: 4.2 (2015 est.)
Vital statistics
| [32][33][34] | Average population | Live births | Deaths | Natural change | Birth rate (per 1,000) | Death rate (per 1,000) | Natural change (per 1,000) | Total Fertility Rate[lower-alpha 1][21][14] |
|---|---|---|---|---|---|---|---|---|
| 1900 | 5,500,000 | 150,000 | 89,000 | 61,000 | 27.2 | 16.2 | 11.0 | |
| 1901 | 5,600,000 | 175,000 | 79,000 | 96,000 | 31.2 | 14.1 | 17.1 | |
| 1902 | 5,760,000 | 180,000 | 77,000 | 103,000 | 31.3 | 13.4 | 17.9 | 4.8 |
| 1903 | 5,930,000 | 186,000 | 78,000 | 108,000 | 31.3 | 13.2 | 18.1 | |
| 1904 | 6,100,000 | 192,000 | 82,000 | 110,000 | 31.4 | 13.5 | 17.9 | |
| 1905 | 6,280,000 | 195,000 | 82,000 | 113,000 | 31.0 | 13.0 | 18.0 | |
| 1906 | 6,460,000 | 193,000 | 85,000 | 108,000 | 29.9 | 13.2 | 16.7 | |
| 1907 | 6,650,000 | 196,000 | 85,000 | 111,000 | 29.5 | 12.8 | 16.7 | 4.74 |
| 1908 | 6,850,000 | 208,000 | 86,000 | 122,000 | 30.3 | 12.6 | 17.7 | |
| 1909 | 7,040,000 | 213,000 | 90,000 | 123,000 | 30.2 | 12.8 | 17.4 | |
| 1910 | 7,250,000 | 220,000 | 95,000 | 125,000 | 30.4 | 13.1 | 17.3 | |
| 1911 | 7,460,000 | 225,000 | 100,000 | 125,000 | 30.1 | 13.4 | 16.7 | 4.7 |
| 1912 | 7,610,000 | 238,000 | 99,000 | 139,000 | 31.3 | 13.0 | 19.3 | 4.62 |
| 1913 | 7,760,000 | 246,000 | 102,000 | 144,000 | 31.7 | 13.1 | 19.6 | |
| 1914 | 7,910,000 | 252,000 | 100,000 | 152,000 | 31.9 | 12.6 | 19.3 | |
| 1915 | 8,060,000 | 257,000 | 101,000 | 156,000 | 31.9 | 12.5 | 19.4 | |
| 1916 | 8,220,000 | 252,000 | 107,000 | 145,000 | 30.7 | 13.0 | 17.7 | |
| 1917 | 8,380,000 | 244,000 | 106,000 | 138,000 | 29.1 | 12.7 | 16.4 | 4.26 |
| 1918 | 8,450,000 | 243,000 | 134,000 | 109,000 | 28.8 | 15.9 | 12.9 | |
| 1919 | 8,710,000 | 241,000 | 119,000 | 122,000 | 27.7 | 13.7 | 14.0 | |
| 1920 | 8,880,000 | 259,000 | 118,000 | 141,000 | 29.2 | 13.3 | 15.9 | |
| 1921 | 9,060,000 | 265,000 | 105,000 | 160,000 | 29.3 | 11.6 | 17.7 | 3.98 |
| 1922 | 9,230,000 | 261,000 | 107,000 | 154,000 | 28.3 | 11.6 | 16.7 | 3.86 |
| 1923 | 9,400,000 | 251,000 | 111,000 | 140,000 | 26.7 | 11.8 | 14.9 | |
| 1924 | 9,560,000 | 255,000 | 104,000 | 151,000 | 26.7 | 10.9 | 15.8 | |
| 1925 | 9,730,000 | 254,000 | 104,000 | 150,000 | 26.1 | 10.7 | 15.4 | |
| 1926 | 9,890,000 | 244,000 | 113,000 | 131,000 | 24.7 | 11.4 | 13.3 | |
| 1927 | 10,040,000 | 244,000 | 110,000 | 134,000 | 24.3 | 11.0 | 13.3 | 3.32 |
| 1928 | 10,190,000 | 246,000 | 114,000 | 132,000 | 24.1 | 11.2 | 12.9 | |
| 1929 | 10,350,000 | 243,000 | 118,000 | 125,000 | 23.5 | 11.4 | 12.1 | 3.22 |
| 1930 | 10,498,000 | 251,000 | 113,000 | 138,000 | 23.9 | 10.8 | 13.1 | 3.28 |
| 1931 | 10,630,000 | 247,000 | 108,000 | 139,000 | 23.2 | 10.2 | 13.0 | 3.2 |
| 1932 | 10,794,000 | 243,000 | 108,000 | 135,000 | 22.5 | 10.0 | 12.5 | 3.08 |
| 1933 | 10,919,000 | 229,000 | 106,000 | 123,000 | 21.0 | 9.7 | 11.3 | 2.86 |
| 1934 | 11,029,000 | 228,296 | 105,277 | 123,019 | 20.7 | 9.5 | 11.2 | 2.8 |
| 1935 | 11,135,000 | 228,396 | 109,724 | 118,672 | 20.5 | 9.9 | 10.6 | 2.76 |
| 1936 | 11,242,000 | 227,980 | 111,111 | 116,869 | 20.3 | 9.9 | 10.4 | 2.70 |
| 1937 | 11,339,000 | 227,878 | 118,019 | 109,859 | 20.1 | 10.4 | 9.7 | 2.65 |
| 1938 | 11,448,000 | 237,091 | 110,647 | 126,444 | 20.7 | 9.7 | 11.0 | 2.70 |
| 1939 | 11,565,000 | 237,991 | 112,729 | 125,262 | 20.6 | 9.7 | 10.9 | 2.65 |
| 1940 | 11,682,000 | 252,577 | 114,717 | 137,860 | 21.6 | 9.8 | 11.8 | 2.77 |
| 1941 | 11,810,000 | 263,993 | 118,797 | 145,196 | 22.4 | 10.1 | 12.3 | 2.83 |
| 1942 | 11,962,000 | 281,569 | 117,110 | 164,459 | 23.5 | 9.8 | 13.7 | 2.96 |
| 1943 | 12,125,000 | 292,943 | 122,640 | 170,303 | 24.2 | 10.1 | 14.1 | 3.04 |
| 1944 | 12,291,000 | 283,967 | 120,393 | 163,574 | 24.0 | 9.8 | 14.2 | 3.01 |
| 1945 | 12,441,000 | 300,570 | 117,319 | 183,251 | 24.3 | 9.5 | 14.8 | 3.02 |
| 1946 | 12,316,000 | 331,471 | 115,358 | 216,113 | 26.9 | 9.4 | 17.5 | 3.37 |
| 1947 | 12,576,000 | 359,943 | 118,157 | 241,786 | 28.6 | 9.4 | 19.2 | 3.60 |
| 1948 | 12,852,000 | 348,226 | 119,866 | 228,360 | 27.1 | 9.3 | 17.8 | 3.44 |
| 1949 | 13,475,000 | 367,092 | 124,567 | 242,525 | 27.2 | 9.2 | 18.0 | 3.46 |
| 1950 | 13,737,000 | 372,009 | 124,220 | 247,789 | 27.1 | 9.0 | 18.0 | 3.46 |
| 1951 | 14,050,000 | 381,092 | 125,823 | 255,269 | 27.1 | 9.0 | 18.2 | 3.50 |
| 1952 | 14,496,000 | 403,559 | 126,385 | 277,174 | 27.8 | 8.7 | 19.1 | 3.64 |
| 1953 | 14,886,000 | 417,884 | 127,791 | 290,093 | 28.1 | 8.6 | 19.5 | 3.72 |
| 1954 | 15,330,000 | 436,198 | 124,855 | 311,343 | 28.5 | 8.1 | 20.3 | 3.83 |
| 1955 | 15,736,000 | 442,937 | 128,476 | 314,461 | 28.1 | 8.2 | 20.0 | 3.83 |
| 1956 | 16,123,000 | 450,739 | 131,961 | 318,778 | 28.0 | 8.2 | 19.8 | 3.86 |
| 1957 | 16,677,000 | 469,093 | 136,579 | 332,514 | 28.1 | 8.2 | 19.9 | 3.93 |
| 1958 | 17,120,000 | 470,118 | 135,201 | 334,917 | 27.5 | 7.9 | 19.6 | 3.88 |
| 1959 | 17,522,000 | 479,275 | 139,913 | 339,362 | 27.4 | 8.0 | 19.4 | 3.94 |
| 1960 | 17,909,000 | 478,551 | 139,693 | 338,858 | 26.7 | 7.8 | 18.9 | 3.895 |
| 1961 | 18,271,000 | 475,700 | 140,985 | 334,715 | 26.0 | 7.7 | 18.3 | 3.840 |
| 1962 | 18,614,000 | 469,693 | 143,699 | 325,994 | 25.2 | 7.7 | 17.5 | 3.767 |
| 1963 | 18,964,000 | 465,767 | 147,367 | 318,400 | 24.6 | 7.8 | 16.8 | 3.694 |
| 1964 | 19,325,000 | 452,915 | 145,850 | 307,065 | 23.4 | 7.5 | 15.9 | 3.449 |
| 1965 | 19,678,000 | 418,595 | 148,939 | 269,656 | 21.3 | 7.6 | 13.7 | 3.192 |
| 1966 | 20,048,000 | 387,710 | 149,863 | 237,847 | 19.3 | 7.5 | 11.9 | 2.749 |
| 1967 | 20,412,000 | 370,894 | 150,283 | 220,611 | 18.2 | 7.4 | 10.8 | 2.528 |
| 1968 | 20,729,000 | 364,310 | 153,196 | 211,114 | 17.6 | 7.4 | 10.2 | 2.386 |
| 1969 | 21,028,000 | 369,647 | 154,477 | 215,170 | 17.6 | 7.3 | 10.2 | 2.334 |
| 1970 | 21,324,000 | 371,988 | 155,961 | 216,027 | 17.4 | 7.3 | 10.1 | 2.258 |
| 1971 | 21,962,032 | 362,187 | 157,272 | 204,915 | 16.5 | 7.2 | 9.3 | 2.141 |
| 1972 | 22,218,463 | 347,319 | 162,413 | 184,906 | 15.6 | 7.3 | 8.3 | 1.98 |
| 1973 | 22,491,777 | 343,373 | 164,039 | 179,334 | 15.3 | 7.3 | 8.0 | 1.89 |
| 1974 | 22,807,969 | 350,650 | 166,794 | 183,856 | 15.4 | 7.3 | 8.1 | 1.837 |
| 1975 | 23,143,275 | 359,323 | 167,176 | 192,147 | 15.5 | 7.2 | 8.3 | 1.824 |
| 1976 | 23,449,808 | 359,987 | 167,009 | 192,978 | 15.4 | 7.1 | 8.2 | 1.796 |
| 1977 | 23,725,843 | 361,400 | 167,498 | 193,902 | 15.2 | 7.1 | 8.2 | 1.782 |
| 1978 | 23,963,203 | 358,852 | 168,179 | 190,673 | 15.0 | 7.0 | 8.0 | 1.768 |
| 1979 | 24,201,544 | 366,064 | 168,183 | 197,881 | 15.1 | 6.9 | 8.2 | 1.754 |
| 1980 | 24,515,667 | 370,709 | 171,473 | 199,236 | 15.1 | 7.0 | 8.1 | 1.74 |
| 1981 | 24,819,915 | 371,346 | 171,029 | 200,317 | 15.0 | 6.9 | 8.1 | 1.7 |
| 1982 | 25,116,942 | 373,082 | 174,413 | 198,669 | 14.9 | 6.9 | 7.9 | 1.69 |
| 1983 | 25,366,451 | 373,689 | 174,484 | 199,205 | 14.7 | 6.9 | 7.9 | 1.68 |
| 1984 | 25,607,053 | 377,031 | 175,727 | 201,304 | 14.7 | 6.9 | 7.9 | 1.65 |
| 1985 | 25,842,116 | 375,727 | 181,323 | 194,404 | 14.5 | 7.0 | 7.5 | 1.67 |
| 1986 | 26,100,278 | 372,913 | 184,224 | 188,689 | 14.3 | 7.1 | 7.2 | 1.675 |
| 1987 | 26,446,601 | 369,742 | 184,953 | 184,789 | 14.0 | 7.0 | 7.0 | 1.68 |
| 1988 | 26,791,747 | 376,795 | 190,011 | 186,784 | 14.1 | 7.1 | 7.0 | 1.68 |
| 1989 | 27,276,781 | 392,661 | 190,965 | 201,696 | 14.4 | 7.0 | 7.4 | 1.77 |
| 1990 | 27,691,138 | 405,486 | 191,973 | 213,513 | 14.6 | 6.9 | 7.7 | 1.83 |
| 1991 | 28,037,420 | 403,816 | 195,569 | 208,247 | 14.4 | 7.0 | 7.4 | 1.72 |
| 1992 | 28,371,264 | 399,109 | 196,535 | 202,574 | 14.1 | 6.9 | 7.1 | 1.71 |
| 1993 | 28,684,764 | 389,037 | 204,912 | 184,125 | 13.5 | 7.1 | 6.4 | 1.68 |
| 1994 | 29,000,663 | 386,243 | 207,077 | 179,166 | 13.3 | 7.1 | 6.1 | 1.69 |
| 1995 | 29,302,311 | 378,685 | 210,733 | 167,952 | 12.9 | 7.2 | 5.7 | 1.67 |
| 1996 | 29,610,218 | 366,833 | 212,880 | 153,953 | 12.4 | 7.2 | 5.2 | 1.63 |
| 1997 | 29,905,948 | 349,543 | 215,669 | 133,874 | 11.7 | 7.2 | 4.4 | 1.57 |
| 1998 | 30,155,173 | 342,966 | 218,091 | 124,875 | 11.4 | 7.2 | 4.1 | 1.56 |
| 1999 | 30,401,286 | 337,821 | 219,530 | 118,291 | 11.1 | 7.2 | 3.9 | 1.54 |
| 2000 | 30,685,730 | 328,596 | 218,062 | 110,534 | 10.7 | 7.1 | 3.6 | 1.51 |
| 2001 | 31,020,902 | 334,615 | 219,538 | 115,077 | 10.8 | 7.1 | 3.7 | 1.54 |
| 2002 | 31,360,079 | 329,894 | 223,603 | 106,291 | 10.5 | 7.1 | 3.4 | 1.51 |
| 2003 | 31,644,028 | 336,352 | 226,169 | 110,183 | 10.6 | 7.1 | 3.4 | 1.54 |
| 2004 | 31,940,655 | 339,012 | 226,584 | 112,428 | 10.6 | 7.1 | 3.5 | 1.55 |
| 2005 | 32,243,753 | 345,365 | 230,132 | 115,233 | 10.6 | 7.1 | 3.5 | 1.57 |
| 2006 | 32,571,174 | 357,921 | 228,079 | 129,842 | 10.9 | 7.0 | 3.9 | 1.61 |
| 2007 | 32,889,025 | 370,369 | 235,217 | 135,152 | 11.2 | 7.2 | 4.0 | 1.66 |
| 2008 | 33,247,118 | 381,860 | 238,617 | 143,243 | 11.4 | 7.2 | 4.2 | 1.69 |
| 2009 | 33,628,895 | 384,651 | 238,418 | 146,233 | 11.3 | 7.1 | 4.2 | 1.68 |
| 2010 | 34,004,889 | 379,191 | 240,075 | 139,116 | 11.1 | 7.1 | 4.0 | 1.64 |
| 2011 | 34,339,328 | 379,244 | 243,511 | 135,733 | 11.0 | 7.1 | 3.9 | 1.62 |
| 2012 | 34,714,222 | 383,101 | 246,596 | 136,505 | 11.0 | 7.1 | 3.9 | 1.62 |
| 2013 | 35,082,954 | 381,054 | 252,338 | 128,716 | 10.8 | 7.2 | 3.6 | 1.60 |
| 2014 | 35,437,435 | 384,577 | 258,821 | 125,756 | 10.8 | 7.3 | 3.5 | 1.61 |
| 2015 | 35,702,908 | 382,979 | 264,333 | 118,646 | 10.7 | 7.4 | 3.3 | 1.60 |
| 2016 | 36,109,487 | 384,023 | 267,213 | 116,810 | 10.6 | 7.4 | 3.2 | 1.59 |
| 2017 | 36,545,236 | 377,627 | 278,298 | 99,329 | 10.3 | 7.6 | 2.7 | 1.54 |
| 2018 | 37,065,084 | 374,617 | 285,675 | 88,942 | 10.1 | 7.7 | 2.4 | 1.50 |
| 2019 | 37,601,230 | 372,978 | 285,270 | 87,708 | 9.9 | 7.6 | 2.3 | 1.47 |
| 2020 | 38,037,204 | 360,552 | 307,205 | 53,347 | 9.4 | 8.1 | 1.3 | 1.41 |
| 2021(c) | 38,526,760 | 367,684 | 311,942 | 55,742 | 9.5 | 8.0 | 1.5 | 1.43 |
(c) = Census results
Current vital statistics
| Period | Live births | Deaths | Natural increase |
|---|---|---|---|
| January - June 2021 | 181,235 | 154,524 | +26,711 |
| January - June 2022 | 180,306 | 165,803 | +14,503 |
| Difference |
Employment and income
Unemployment, youth ages 15–24
- total: 20.2%
- male: 20.9%
- female: 19.4% (2020 est.)
Ethnicity and visible minorities
Canadians as ethnic group by province
All citizens of Canada are classified as "Canadians" as defined by Canada's nationality laws. "Canadian" as an ethnic group has since 1996 been added to census questionnaires for possible ancestral origin or descent. "Canadian" was included as an example on the English questionnaire and "Canadien" as an example on the French questionnaire.[36] "The majority of respondents to this selection are from the eastern part of the country that was first settled. Respondents generally are visibly European (Anglophones and Francophones) and no longer self-identify with their ethnic ancestral origins. This response is attributed to a multitude or generational distance from ancestral lineage.[37][38]
| Province / Territory | Percent Canadians | Total Canadians |
|---|---|---|
| Alberta | 22.7% | 902,310 |
| British Columbia | 19.0% | 866,530 |
| Manitoba | 18.2% | 232,660 |
| New Brunswick | 57.8% | 415,810 |
| Newfoundland and Labrador | 43.4% | 271,345 |
| Nova Scotia | 42.6% | 387,360 |
| Ontario | 23.5% | 3,109,770 |
| Prince Edward Island | 45.0% | 60,000 |
| Quebec | 60.1% | 4,474,115 |
| Saskatchewan | 25.0% | 274,580 |
| Canada total | 32.3% | 11,136,134 |
Ethnic origin


As data is completely self-reported, and reporting individuals may have varying definitions of "Ethnic origin" (or may not know their ethnic origin), these figures should not be considered an exact record of the relative prevalence of different ethno-cultural ancestries but rather how Canadians self-identify.
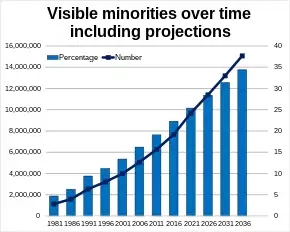
Statistics Canada projects that immigrants will represent between 24.5% and 30.0% of Canada's population in 2036, compared with 20.7% in 2011.[39] Statistics Canada further projects that visible minorities among the working-age population (15 to 64 years) will make up 33.7–34.3% of Canada's total population, compared to 22.3% in 2016.[40]
Counting both single and multiple responses, the most commonly identified ethnic origins were (2016):
| Ethnic origin[41] | % | Population |
|---|---|---|
| Canadian[lower-alpha 2] | 32.32% | 11,136,134 |
| English | 18.34% | 6,320,085 |
| Scottish | 13.93% | 4,799,010 |
| French | 13.55% | 4,670,595 |
| Irish | 13.43% | 4,627,000 |
| German | 9.64% | 3,322,405 |
| Chinese | 5.13% | 1,769,195 |
| Italian | 4.61% | 1,587,970 |
| First Nations[lower-alpha 3] | 4.43% | 1,525,565 |
| Indian | 3.99% | 1,374,710 |
| Ukrainian | 3.95% | 1,359,655 |
| Dutch | 3.23% | 1,111,655 |
| Polish | 3.21% | 1,106,585 |
| Filipino | 2.43% | 837,130 |
| British, not included elsewhere | 1.87% | 644,695 |
| Russian | 1.81% | 622,445 |
| Métis | 1.74% | 600,000 |
| Portuguese | 1.40% | 482,610 |
| Welsh | 1.38% | 474,805 |
| Norwegian | 1.34% | 463,275 |
| Spanish | 1.15% | 396,460 |
| American | 1.10% | 377,410 |
| Swedish | 1.02% | 349,640 |
| Hungarian | 1.01% | 348,085 |
The most common ethnic origins per province are as follows in 2006[42] (total responses; only percentages 10% or higher shown; ordered by percentage of "Canadian"):
- Quebec (7,723,525): Canadian (59.1%), French (29.1%)
- New Brunswick (735,835): Canadian (50.3%), French (27.2%), English (25.9%), Irish (21.6%), Scottish (19.9%)
- Newfoundland and Labrador (507,265): Canadian (49.0%), English (43.4%), Irish (21.8%)
- Nova Scotia (906,170): Canadian (39.1%), Scottish (31.2%), English (30.8%), Irish (22.3%), French (17.0%), German (10.8%)
- Prince Edward Island (137,375): Scottish (39.3%), Canadian (36.8%), English (31.1%), Irish (30.4%), French (21.1%)
- Ontario (12,651,795): Canadian (23.3%), English (23.1%), Scottish (16.4%), Irish (16.4%), French (10.8%)
- Alberta (3,567,980): English (24.9%), Canadian (21.8%), German (19.2%), Scottish (18.8%), Irish (15.8%), French (11.1%)
- Manitoba (1,174,345): English (21.8%), German (18.6%), Canadian (18.5%), Scottish (18.0%), Ukrainian (14.9%), Irish (13.2%), French (12.6%), North American Indian (10.6%)
- Saskatchewan (1,008,760): German (28.6%), English (24.9%), Scottish (18.9%), Canadian (18.8%), Irish (15.5%), Ukrainian (13.5%), French (12.2%), North American Indian (12.1%)
- British Columbia (4,324,455): English (27.7%), Scottish (19.3%), Canadian (19.1%), German (13.1%), Chinese (10.7%)
- Yukon (33,320): English (28.5%), Scottish (25.0%), Irish (22.0%), North American Indian (21.8%), Canadian (21.8%), German (15.6%), French (13.1%)
- Northwest Territories (40,800): North American Indian (37.0%), Scottish (13.9%), English (13.7%), Canadian (12.8%), Irish (11.9%), Inuit (11.7%)
- Nunavut (31,700): Inuit (85.4%)
Italics indicates either that this response is dominant within this province, or that this province has the highest ratio (percentage) of this response among provinces.
Visible minority population
| Group | 1981 census [43][44][45]: 64 |
1986 census [44][45]: 66 [46]: 6 |
1991 census [44][47]: 11 [46]: 6 |
1996 census[48][49] | ||||
|---|---|---|---|---|---|---|---|---|
| Total | % | Total | % | Total | % | Total | % | |
| Visible minority | 1,131,825 | 4.7% | 1,577,710 | 6.3% | 2,525,480 | 9.4% | 3,197,480 | 11.2% |
| South Asian | 223,235 | 0.9% | 300,545 | 1.2% | 505,515 | 1.9% | 670,590 | 2.4% |
| Chinese (East Asian) | 299,915 | 1.2% | 390,590 | 1.6% | 626,435 | 0% | 860,150 | 3% |
| Black | 239,455 | 1% | 355,385 | 1.4% | 504,290 | 1.9% | 573,860 | 2% |
| Filipino | 75,485 | 0.3% | 102,360 | 0.4% | 169,150 | 0.6% | 234,195 | 0.8% |
| Latin American | 50,230 | 0.2% | 60,975 | 0.2% | 134,535 | 0.5% | 176,970 | 0.6% |
| Arab/West Asian | 112,435 | 0.5% | 149,665 | 0.6% | 289,755 | 1.1% | 244,665 | 0.9% |
| Southeast Asian (except Filipino) | 53,910 | 0.2% | 86,945 | 0.3% | 132,415 | 0.5% | 172,765 | 0.6% |
| Korean (East Asian) | 22,570 | 0.1% | 29,205 | 0.1% | 45,535 | 0.2% | 64,835 | 0.2% |
| Japanese (East Asian) | 46,060 | 0.2% | 52,880 | 0.2% | 63,860 | 0.2% | 68,135 | 0.2% |
| Multiple visible minorities | 40,500 | 0.2% | 48,545 | 0.2% | 61,575 | 0.2% | ||
| Visible minority, n.i.e. | 5,440 | 0% | 69,745 | 0.2% | ||||
| Other | 8,530 | 0% | 8,660 | 0% | ||||
| Not a visible minority | 22,951,670 | 95.3% | 23,444,300 | 93.7% | 24,468,560 | 90.6% | 25,330,645 | 88.8% |
| Indigenous (see breakdown below) | 491,465 | 2% | 711,725 | 2.8% | 1,016,340 | 3.8% | 799,005 | 2.8% |
| European[nb 1] | 22,460,205 | 93.3% | 22,732,575 | 90.9% | 23,452,220 | 86.9% | 24,531,640 | 86% |
| Total population in private households | 24,083,495 | 100% | 25,022,010 | 100% | 26,994,040 | 100% | 28,528,125 | 100% |
Note: Indigenous population decline between 1991 and 1996 censuses attributed to change in criteria in census count; "the 1996 Royal Commission on Aboriginal Peoples used a more restrictive definition of Aboriginal".[50]
| Group | 2001 census[51] | 2006 census[52] | 2011 survey[53] | 2016 census[54] | ||||
|---|---|---|---|---|---|---|---|---|
| Total | % | Total | % | Total | % | Total | % | |
| Visible minority | 3,983,845 | 13.4% | 5,068,095 | 16.2% | 6,264,750 | 19.1% | 7,674,580 | 22.3% |
| South Asian | 917,075 | 3.1% | 1,262,865 | 4% | 1,567,400 | 4.8% | 1,924,635 | 5.6% |
| Chinese (East Asian) | 1,029,395 | 3.5% | 1,216,565 | 3.9% | 1,324,750 | 4% | 1,577,060 | 4.6% |
| Black | 662,215 | 2.2% | 783,795 | 2.5% | 945,665 | 2.9% | 1,198,540 | 3.5% |
| Filipino | 308,575 | 1% | 410,695 | 1.3% | 619,310 | 1.9% | 780,125 | 2.3% |
| Arab | 194,685 | 0.7% | 265,550 | 0.9% | 380,620 | 1.2% | 523,235 | 1.5% |
| Latin American | 216,980 | 0.7% | 304,245 | 1% | 381,280 | 1.2% | 447,325 | 1.3% |
| Southeast Asian (except Filipino) | 198,880 | 0.7% | 239,935 | 0.8% | 312,075 | 0.9% | 313,260 | 0.9% |
| West Asian | 109,285 | 0.4% | 156,700 | 0.5% | 206,840 | 0.6% | 264,305 | 0.8% |
| Korean (East Asian) | 100,660 | 0.3% | 141,890 | 0.5% | 161,130 | 0.5% | 188,710 | 0.5% |
| Japanese (East Asian) | 73,315 | 0.2% | 81,300 | 0.3% | 87,270 | 0.3% | 92,920 | 0.3% |
| Multiple visible minorities | 73,875 | 0.2% | 133,120 | 0.4% | 171,935 | 0.5% | 232,375 | 0.7% |
| Visible minority, n.i.e. | 98,915 | 0.3% | 71,420 | 0.2% | 106,475 | 0.3% | 132,090 | 0.4% |
| Not a visible minority | 25,655,185 | 86.6% | 26,172,935 | 83.8% | 26,587,575 | 80.9% | 26,785,480 | 77.7% |
| Indigenous (see breakdown below) | 976,305 | 3.3% | 1,172,785 | 3.8% | 1,400,685 | 4.3% | 1,673,785 | 4.9% |
| European[nb 1] | 24,678,880 | 83.3% | 25,000,150 | 80% | 25,186,890 | 76.7% | 25,111,695 | 72.9% |
| Total population in private households | 29,639,030 | 100% | 31,241,030 | 100% | 32,852,320 | 100% | 34,460,065 | 100% |
Indigenous population
| Group | 1996[48] | 2001[51] | 2006[52] | 2011[53] | 2016[55] | 2021[56] | ||||||
|---|---|---|---|---|---|---|---|---|---|---|---|---|
| % | Total | % | Total | % | Total | % | Total | % | Total | % | Total | |
| Total Indigenous | 2.8% | 799,005 | 3.3% | 976,305 | 3.8% | 1,172,785 | 4.3% | 1,400,685 | 4.9% | 1,673,780 | 5% | 1,807,250 |
| First Nations | 1.8% | 529,040 | 2.1% | 608,850 | 2.2% | 698,025 | 2.6% | 851,560 | 2.8% | 977,230 | 2.9% | 1,048,405 |
| Métis | 0.7% | 204,115 | 1.0% | 292,305 | 1.2% | 389,780 | 1.4% | 451,795 | 1.7% | 587,545 | 1.7% | 624,220 |
| Inuit | 0.14% | 40,220 | 0.16% | 50,485 | 0.2% | 59,445 | 0.2% | 65,025 | 0.2% | 70,540 | ||
Note: Other Indigenous and mixed Indigenous groups are not listed as their own, but they are all accounted for in total Indigenous
Future projections

| 2031[57][58] | 2036[57][58] | 2041[57][58] | ||||
|---|---|---|---|---|---|---|
| Population | % | Population | % | Population | % | |
|
26,085,000 | 59.79% | 25,749,000 | 56.25% | 25,296,000 | 53.07% |
|
4,283,000 | 9.82% | 5,010,000 | 10.94% | 5,658,000 | 11.87% |
|
3,120,000 | 7.15% | 3,445,000 | 7.53% | 3,740,000 | 7.85% |
|
2,591,000 | 5.94% | 2,850,000 | 6.23% | 3,082,000 | 6.47% |
|
381,000 | 0.87% | 433,000 | 0.95% | 484,000 | 1.02% |
|
148,000 | 0.34% | 162,000 | 0.35% | 174,000 | 0.37% |
|
2,381,000 | 5.46% | 2,762,000 | 6.03% | 3,134,000 | 6.57% |
| 2,484,000 | 5.69% | 2,673,000 | 5.84% | 2,848,000 | 5.97% | |
|
1,430,000 | 3.28% | 1,535,000 | 3.35% | 1,633,000 | 3.43% |
| 911,000 | 2.09% | 986,000 | 2.15% | 1,054,000 | 2.21% | |
|
84,000 | 0.19% | 90,000 | 0.2% | 96,000 | 0.2% |
|
59,000 | 0.14% | 62,000 | 0.14% | 65,000 | 0.14% |
| 2,009,000 | 4.6% | 2,324,000 | 5.08% | 2,640,000 | 5.54% | |
|
1,524,000 | 3.49% | 1,789,000 | 3.91% | 2,059,000 | 4.32% |
|
485,000 | 1.11% | 535,000 | 1.17% | 581,000 | 1.22% |
|
1,801,000 | 4.13% | 2,141,000 | 4.68% | 2,475,000 | 5.19% |
|
1,182,000 | 2.71% | 1,403,000 | 3.06% | 1,625,000 | 3.41% |
|
619,000 | 1.42% | 738,000 | 1.61% | 850,000 | 1.78% |
|
821,000 | 1.88% | 931,000 | 2.03% | 1,036,000 | 2.17% |
|
644,000 | 1.48% | 742,000 | 1.62% | 841,000 | 1.76% |
|
43,629,000 | 100% | 45,776,000 | 100% | 47,668,000 | 100% |
Languages
Mother tongue
| First language | 2016 | 2011 | 2006 | ||||
|---|---|---|---|---|---|---|---|
| Population | % of total population | Population | % of total population | Population | % of total population | Notes | |
| Single language responses | 33,947,610 | 97.64% | 32,481,635 | 98.07% | 30,848,270 | 98.74% | |
| Official languages | 26,627,545 | 76.59% | 25,913,955 | 78.24% | 24,700,425 | 79.06% | |
| English | 19,460,855 | 55.97% | 18,858,980 | 56.94% | 17,882,775 | 57.24% | |
| French | 7,166,700 | 20.61% | 7,054,975 | 21.3% | 6,817,650 | 21.82% | |
| Non-official languages | 7,321,070 | 21.06% | 6,567,680 | 19.83% | 6,147,840 | 19.68% | |
| Combined Chinese Responses | 1,227,680 | 3.53% | n/a | n/a | n/a | n/a | Combined responses of Mandarin, Cantonese, Chinese n.o.s. and Min Nan |
| Mandarin (Standard Chinese) | 592,035 | 1.7% | 248,705 | 0.75% | 170,950 | 0.55% | |
| Cantonese | 565,275 | 1.63% | 372,460 | 1.12% | 361,450 | 1.16% | |
| Punjabi | 501,680 | 1.44% | 430,705 | 1.3% | 367,505 | 1.18% | |
| Spanish | 458,850 | 1.32% | 410,670 | 1.24% | 345,345 | 1.11% | |
| Tagalog (Filipino) | 431,385 | 1.24% | 327,445 | 0.99% | 235,615 | 0.75% | |
| Arabic | 419,895 | 1.21% | 327,870 | 0.99% | 261,640 | 0.84% | |
| German | 384,040 | 1.1% | 409,200 | 1.24% | 450,570 | 1.44% | |
| Italian | 375,645 | 1.08% | 407,485 | 1.23% | 455,040 | 1.46% | |
| Hindustani | 321,465 | 0.92% | 263,345 | 0.8% | 224,045 | 0.72% | Combined responses of Hindi and Urdu |
| Portuguese | 221,535 | 0.64% | 211,335 | 0.64% | 219,275 | 0.7% | |
| Persian (Farsi) | 214,200 | 0.62% | 170,045 | 0.51% | 134,080 | 0.43% | |
| Urdu | 210,820 | 0.61% | 172,800 | 0.52% | 145,805 | 0.47% | |
| Dravidian languages | 189,405 | 0.54% | n/a | n/a | n/a | n/a | Combined responses of Tamil, Malayalam, Telugu and Kannada. |
| Russian | 188,255 | 0.54% | 164,330 | 0.5% | 133,580 | 0.43% | |
| Polish | 181,705 | 0.52% | 191,645 | 0.58% | 211,175 | 0.68% | |
| Vietnamese | 156,430 | 0.45% | 144,880 | 0.44% | 141,625 | 0.45% | |
| Korean | 153,425 | 0.44% | 137,925 | 0.42% | 125,570 | 0.4% | |
| Tamil | 140,720 | 0.4% | 131,265 | 0.4% | 115,880 | 0.37% | Most of the Canadian Tamils live in Toronto. |
| Hindi | 110,645 | 0.32% | 90,545 | 0.27% | 78,240 | 0.25% | |
| Gujarati | 108,775 | 0.31% | 91,450 | 0.28% | 81,465 | 0.26% | |
| Greek | 106,520 | 0.31% | 108,925 | 0.33% | 117,285 | 0.38% | |
| Ukrainian | 102,485 | 0.29% | 111,540 | 0.34% | 134,500 | 0.43% | |
| Dutch | 99,015 | 0.28% | 110,490 | 0.33% | 128,900 | 0.41% | |
| Romanian | 96,660 | 0.28% | 90,300 | 0.27% | 78,495 | 0.25% | |
| Bengali | 73,125 | 0.21% | 59,370 | 0.18% | 45,685 | 0.15% | |
| Creoles | 72,130 | 0.21% | 61,725 | 0.19% | 53,515 | 0.17% | |
| Cree, n.o.s.[nb 2] | 64,045 | 0.18% | 77,900 | 0.24% | 78,855 | 0.25% | In the 2006 Census, this language was referred to simply as 'Cree'. |
| Hungarian | 61,235 | 0.18% | 67,920 | 0.21% | 73,335 | 0.23% | The majority of Hungarian speakers in Canada live in Ontario. A community of Hungarian speakers is found within a part of Windsor, Ontario. |
| Berber languages (Kabyle) | n/a | n/a | 57,855 | 0.17% | 25,578 | 0.08% | |
| Serbian | 57,345 | 0.16% | 56,420 | 0.17% | 51,665 | 0.17% | |
| Croatian | 48,200 | 0.14% | 49,730 | 0.15% | 55,330 | 0.18% | |
| Japanese | 43,640 | 0.13% | 39,985 | 0.12% | 40,200 | 0.13% | |
| Chinese, n.o.s.[nb 2] | 38,575 | 0.11% | 425,210 | 1.28% | 456,705 | 1.46% | |
| Somali | 36,760 | 0.11% | 31,380 | 0.09% | 27,320 | 0.09% | |
| Inuktitut | 35,215 | 0.1% | 33,500 | 0.1% | 32,015 | 0.1% | In the 2006 Census, this language was referred to as 'Inuktitut, n.i.e.'.[nb 3] |
| Armenian | 33,455 | 0.1% | 29,795 | 0.09% | 30,130 | 0.1% | |
| Turkish | 32,815 | 0.09% | 29,640 | 0.09% | 24,745 | 0.08% | |
| Min Nan (Chaochow, Teochow, Fukien, Taiwanese) | 31,795 | 0.09% | n/a | n/a | n/a | n/a | |
| Malayalam | 28,570 | 0.08% | 16,080 | 0.05% | 11,925 | 0.04% | |
| Albanian | 26,895 | 0.08% | 23,820 | 0.07% | n/a | n/a | |
| Ilocano | 26,345 | 0.08% | 17,915 | 0.05% | 13,450 | 0.04% | |
| Amharic | 22,465 | 0.06% | 18,020 | 0.05% | 14,555 | 0.05% | |
| Czech | 22,295 | 0.06% | 23,585 | 0.07% | 24,450 | 0.08% | |
| Khmer (Cambodian) | 20,130 | 0.06% | 19,440 | 0.06% | 19,105 | 0.06% | |
| Bulgarian | 20,020 | 0.06% | 19,050 | 0.06% | 16,790 | 0.05% | |
| Hebrew | 19,530 | 0.06% | 18,450 | 0.06% | 17,635 | 0.06% | |
| Niger–Congo languages, n.i.e.[nb 2] | 19,140 | 0.06% | 14,075 | 0.04% | n/a | n/a | |
| Nepali | 18,275 | 0.05% | 8,480 | 0.03% | n/a | n/a | |
| Ojibway | 17,885 | 0.05% | 17,625 | 0.05% | 24,190 | 0.08% | |
| Slovak | 17,585 | 0.05% | 17,580 | 0.05% | 18,820 | 0.06% | |
| Pashto | 16,910 | 0.05% | 12,465 | 0.04% | 9,025 | 0.03% | |
| Macedonian | 16,770 | 0.05% | 17,245 | 0.05% | 18,435 | 0.06% | |
| Tigrigna | 16,650 | 0.05% | 10,220 | 0.03% | 7,105 | 0.02% | |
| Sinhala | 16,335 | 0.05% | 14,185 | 0.04% | 10,180 | 0.03% | |
| Bisayan languages | n/a | n/a | 16,240 | 0.05% | 11,240 | 0.04% | |
| Telugu | 15,655 | 0.05% | 9,315 | 0.03% | 6,625 | 0.02% | |
| Finnish | 15,295 | 0.04% | 17,415 | 0.05% | 21,030 | 0.07% | |
| Yiddish | 13,555 | 0.04% | 15,205 | 0.05% | 16,295 | 0.05% | |
| Akan (Twi) | 13,460 | 0.04% | 12,680 | 0.04% | 12,780 | 0.04% | |
| Swahili | 13,375 | 0.04% | 10,090 | 0.03% | 7,935 | 0.03% | |
| Wu (Shanghainese) | 12,920 | 0.04% | n/a | n/a | n/a | n/a | |
| Oji-Cree | 12,855 | 0.04% | 9,835 | 0.03% | 11,690 | 0.04% | |
| Lao | 12,670 | 0.04% | 12,970 | 0.04% | 13,940 | 0.04% | |
| Danish | 12,630 | 0.04% | 14,145 | 0.04% | 18,735 | 0.06% | |
| Malay | 12,275 | 0.04% | 10,910 | 0.03% | 9,490 | 0.03% | |
| Bosnian | 12,210 | 0.04% | 11,685 | 0.04% | 12,790 | 0.04% | |
| Sindhi | 11,860 | 0.03% | 11,330 | 0.03% | 10,355 | 0.03% | |
| Kurdish | 11,705 | 0.03% | 9,805 | 0.03% | 7,660 | 0.02% | |
| Hakka | 10,910 | 0.03% | 5,115 | 0.02% | n/a | n/a | |
| Dene | 10,700 | 0.03% | 11,215 | 0.03% | 9,745 | 0.03% | |
| Afrikaans | 10,260 | 0.03% | 8,770 | 0.03% | n/a | n/a | |
| Montagnais (Innu) | 10,230 | 0.03% | 10,785 | 0.03% | 10,975 | 0.04% | In the 2006 Census, this language was referred to as 'Montagnais-Naskapi'. |
| Slovenian | 9,785 | 0.03% | 10,775 | 0.03% | 13,135 | 0.04% | |
| Taiwanese | n/a | n/a | 9,635 | 0.03% | 9,620 | 0.03% | |
| Serbo-Croatian | 9,555 | 0.03% | 10,155 | 0.03% | 12,510 | 0.04% | |
| African languages, n.i.e.[nb 3] | n/a | n/a | 9,125 | 0.03% | n/a | n/a | |
| Thai | 9,255 | 0.03% | 7,935 | 0.02% | n/a | n/a | |
| Marathi | 8,295 | 0.02% | 5,830 | 0.02% | n/a | n/a | |
| Bantu languages, n.i.e.[nb 3] | n/a | n/a | 7,150 | 0.02% | n/a | n/a | |
| Lithuanian | 7,075 | 0.02% | 7,245 | 0.02% | 8,335 | 0.03% | |
| Swedish | 6,840 | 0.02% | 7,350 | 0.02% | 8,220 | 0.03% | |
| Mi'kmaq | 6,690 | 0.02% | 7,635 | 0.02% | 7,365 | 0.02% | |
| Tibetan | 6,165 | 0.02% | n/a | n/a | n/a | n/a | |
| Atikamekw | 6,150 | 0.02% | 5,820 | 0.02% | 5,250 | 0.02% | |
| Canadian Gaelic | n/a | n/a | 6,015 | 0.02% | 6,015 | 0.02% | |
| Fukien (Fuzhou dialect) | n/a | n/a | 5,925 | 0.02% | n/a | n/a | |
| Rundi (Kirundi) | 5,845 | 0.02% | 3,975 | 0.01% | n/a | n/a | |
| Maltese | 5,565 | 0.02% | 6,220 | 0.02% | 6,405 | 0.02% | |
| Estonian | 5,445 | 0.02% | 6,385 | 0.02% | 8,240 | 0.03% | |
| Latvian | 5,455 | 0.02% | 6,200 | 0.02% | 7,000 | 0.02% | |
| Kinyarwanda (Rwanda) | 5,250 | 0.02% | 3,895 | 0.01% | n/a | n/a | |
| Indo-Iranian languages, n.i.e.[nb 3] | 5,180 | 0.01% | 5,255 | 0.02% | n/a | n/a | |
| Oromo | 4,960 | 0.01% | 11,140 | 0.03% | n/a | n/a | |
| Norwegian | 4,615 | 0.01% | 5,800 | 0.02% | 7,225 | 0.02% | |
| Tibetan languages | n/a | n/a | 4,640 | 0.01% | n/a | n/a | |
| Sino-Tibetan languages, n.i.e.[nb 3] | n/a | n/a | 4,360 | 0.01% | n/a | n/a | |
| Sign languages, n.i.e.[nb 3] | 4,125 | 0.01% | 3,815 | 0.01% | n/a | n/a | |
| Vlaams (Flemish) | 3,895 | 0.01% | 4,690 | 0.01% | 5,660 | 0.02% | |
| Lingala | 3,810 | 0.01% | 3,085 | 0.01% | n/a | n/a | |
| Burmese | 3,585 | 0.01% | 2,985 | 0.01% | n/a | n/a | |
| Stoney | 3,025 | 0.01% | 3,050 | 0.01% | n/a | n/a | |
| Shanghainese | n/a | n/a | 2,920 | 0.01% | n/a | n/a | |
| Blackfoot | 2,815 | <0.01% | n/a | n/a | 3,085 | 0.01% | |
| Slavic languages, n.i.e.[nb 3] | 2,420 | 0.01% | 3,630 | 0.01% | n/a | n/a | |
| Semitic languages, n.i.e.[nb 3] | 2,155 | 0.01% | 16,970 | 0.05% | n/a | n/a | |
| Frisian | 2,095 | <0.01% | n/a | n/a | 2,890 | 0.01% | |
| Dogrib (Tlicho) | 1,645 | <0.01% | n/a | n/a | 2,020 | 0.01% | |
| Tibeto-Burman languages, n.i.e.[nb 3] | 1,405 | <0.01% | n/a | n/a | n/a | n/a | |
| Siouan languages (Dakota/Sioux) | 1,265 | <0.01% | n/a | n/a | 5,585 | 0.02% | |
| Algonquin | 1,260 | <0.01% | n/a | n/a | 1,920 | 0.01% | |
| Scottish Gaelic | 1,095 | <0.01% | n/a | n/a | n/a | n/a | |
| Welsh | 1,075 | <0.01% | n/a | n/a | n/a | n/a | |
| Carrier | 1,030 | <0.01% | n/a | n/a | 1,560 | <0.01% | |
| Inuinnaqtun (Inuvialuktun) | 1,020 | <0.01% | n/a | n/a | 365 | <0.01% | |
| Mohawk | 985 | <0.01% | n/a | n/a | 290 | <0.01% | |
| South Slavey | 950 | <0.01% | n/a | n/a | 1,605 | 0.01% | |
| Gitxsan (Gitksan) | 880 | <0.01% | n/a | n/a | 1,180 | <0.01% | |
| North Slave (Hare) | 765 | <0.01% | n/a | n/a | 1,065 | <0.01% | |
| Chilcotin | 655 | <0.01% | n/a | n/a | 1,070 | <0.01% | |
| Celtic languages, n.i.e.[nb 3] | 530 | <0.01% | n/a | n/a | n/a | n/a | |
| Chipewyan | n/a | n/a | n/a | n/a | 525 | <0.01% | |
| Michif | 465 | <0.01% | n/a | n/a | n/a | n/a | |
| Shuswap (Secwepemctsin) | 445 | <0.01% | n/a | n/a | 935 | <0.01% | |
| Nisga'a | 400 | <0.01% | n/a | n/a | 680 | <0.01% | |
| Malecite | 300 | <0.01% | n/a | n/a | 535 | <0.01% | |
| Kutchin-Gwich’in (Loucheux) | 260 | <0.01% | n/a | n/a | 360 | <0.01% | |
| Tlingit | 95 | <0.01% | n/a | n/a | 80 | <0.01% | |
| Other languages | n/a | n/a | 77,890 | 0.2% | 172,650 | 0.55% | |
| Multiple language responses | 818,640 | 2.35% | 639,540 | 1.9% | 392,760 | 1.26% | |
| English and French | 165,335 | 0.48% | 144,685 | 0.4% | 98,630 | 0.32% | |
| English and a non-official language | 533,260 | 1.53% | 396,330 | 1.2% | 240,005 | 0.77% | |
| French and a non-official language | 86,145 | 0.25% | 74,430 | 0.2% | 43,335 | 0.14% | |
| English, French, and a non-official language | 33,900 | 0.1% | 24,095 | 0.07% | 10,790 | 0.03% | |
| Total[59][60][61] | 34,767,250 | 100% | 33,121,175 | 100% | 31,241,030 | 100% | |
- Statistic includes all persons that did not make up part of a visible minority or an aboriginal identity.
- n.o.s. – not otherwise specified
- n.i.e. – not included elsewhere
Knowledge of language
The question on knowledge of languages allows for multiple responses, and first appeared on the 1991 Canadian census.[lower-alpha 7] The following figures are from the 1991 Canadian census, 2001 Canadian census, 2011 Canadian census, and the 2021 Canadian census.
| Language | Population (2021)[63] |
% (2021) |
Population (2011)[64] |
% (2011) |
Population (2001)[62][65] |
% (2001) |
Population (1991)[66] |
% (1991) |
|---|---|---|---|---|---|---|---|---|
| English | 31,628,570 | 87.06% | 28,360,235[67] | 85.63% | 25,246,220[68] | 85.18% | 22,505,415 | 83.37% |
| French | 10,563,235 | 29.08% | 9,960,585[67] | 30.07% | 9,178,100[68] | 30.97% | 8,508,960 | 31.52% |
| Chinese[lower-alpha 5] | 1,528,860 | 4.21% | 1,297,505 | 3.92% | 1,028,445 | 3.47% | 557,305 | 2.06% |
| Hindustani[lower-alpha 6] | 1,176,295 | 3.24% | 576,165 | 1.74% | 366,740 | 1.24% | 163,930 | 0.61% |
| Spanish | 1,171,450 | 3.22% | 873,395 | 2.64% | 610,580 | 2.06% | 402,430 | 1.49% |
| Punjabi | 942,170 | 2.59% | 545,730 | 1.65% | 338,720 | 1.14% | 167,925 | 0.62% |
| Arabic | 838,045 | 2.31% | 470,965 | 1.42% | 290,280 | 0.98% | 164,380 | 0.61% |
| Tagalog | 737,565 | 2.03% | 491,075 | 1.48% | 244,690 | 0.83% | 136,975 | 0.51% |
| Italian | 547,655 | 1.51% | 595,600 | 1.8% | 680,970 | 2.3% | 701,910 | 2.6% |
| German | 419,195 | 1.15% | 525,480 | 1.59% | 635,520 | 2.14% | 684,955 | 2.54% |
| Portuguese | 336,865 | 0.93% | 266,950 | 0.81% | 264,990 | 0.89% | 254,465 | 0.94% |
| Persian[lower-alpha 8] | 330,725 | 0.91% | 196,110 | 0.59% | 111,700 | 0.38% | 49,380 | 0.18% |
| Russian | 309,235 | 0.85% | 230,755 | 0.7% | 157,455 | 0.53% | 84,050 | 0.31% |
| Tamil | 237,890 | 0.65% | 179,465 | 0.54% | 111,580 | 0.38% | 37,330 | 0.14% |
| Vietnamese | 232,800 | 0.64% | 192,070 | 0.58% | 165,645 | 0.56% | 113,115 | 0.42% |
| Gujarati | 209,410 | 0.58% | 118,950 | 0.36% | 80,835 | 0.27% | 54,210 | 0.2% |
| Polish | 204,460 | 0.56% | 217,735 | 0.66% | 249,695 | 0.84% | 239,575 | 0.89% |
| Korean | 203,885 | 0.56% | 149,035 | 0.45% | 91,610 | 0.31% | 40,230 | 0.15% |
| Serbo-Croatian[lower-alpha 9] | 155,775 | 0.43% | 154,700 | 0.47% | 153,085 | 0.52% | 100,541 | 0.37% |
| Greek | 145,060 | 0.4% | 150,620 | 0.45% | 158,800 | 0.54% | 161,320 | 0.6% |
| Haitian Creole | 134,895 | 0.37% | 128,555 | 0.39% | 76,140 | 0.26% | 49,970 | 0.19% |
| Ukrainian | 131,655 | 0.36% | 144,260 | 0.44% | 200,520 | 0.68% | 249,535 | 0.92% |
| Bengali | 120,605 | 0.33% | 69,490 | 0.21% | 34,650 | 0.12% | N/A | <0.1% |
| Romanian | 116,520 | 0.32% | 97,180 | 0.29% | 60,520 | 0.2% | 30,520 | 0.11% |
| Dutch | 107,985 | 0.3% | 135,085 | 0.41% | 157,875 | 0.53% | 173,290 | 0.64% |
| Cree[lower-alpha 10] | 105,850 | 0.29% | 96,690 | 0.29% | 97,200 | 0.33% | 93,825 | 0.35% |
| Japanese | 98,070 | 0.27% | 74,690 | 0.23% | 65,030 | 0.22% | 45,370 | 0.17% |
| Hebrew | 83,205 | 0.23% | 70,695 | 0.21% | 63,675 | 0.21% | 52,450 | 0.19% |
| Turkish | 78,500 | 0.22% | 44,080 | 0.13% | 32,520 | 0.11% | N/A | <0.1% |
| Malayalam | 77,910 | 0.21% | 22,125 | 0.07% | 9,185 | 0.03% | N/A | <0.1% |
| Hungarian | 64,625 | 0.18% | 73,695 | 0.22% | 89,230 | 0.3% | 97,410 | 0.36% |
| Ilocano | 61,680 | 0.17% | 21,880 | 0.07% | N/A | <0.03% | N/A | <0.1% |
| Somali | 59,005 | 0.16% | 37,115 | 0.11% | N/A | <0.03% | N/A | <0.1% |
| Swahili | 57,295 | 0.16% | 31,690 | 0.1% | 25,300 | 0.09% | N/A | <0.1% |
| Telugu | 54,685 | 0.15% | 12,645 | 0.04% | N/A | <0.03% | N/A | <0.1% |
- n.o.s. – not otherwise specified
- n.i.e. – not included elsewhere
Work
| Language | % of total population (2016)[69] | % of total population (2006)[70] |
|---|---|---|
| English | 76.49% | 76.36% |
| French | 19.17% | 20.22% |
| Non-official | 1.38% | 1.49% |
| English and French | 2.07% | 1.37% |
| English and non-official | 0.77% | 0.47% |
| Other[lower-alpha 11] | 0.12% | 0.09% |
Home
| Language | % of total population (2016)[71] | % of total population (2006)[72] |
|---|---|---|
| English | 63.75% | 65.89% |
| French | 19.97% | 21.15% |
| Non-official | 11.5% | 11.11% |
| English and non-official | 3.7% | 1.3% |
| English and French | 0.46% | 0.3% |
| Other[lower-alpha 12] | 0.63% | 0.24% |
Religion
Statistics Canada (StatCan) grouped responses to the 2011 National Household Survey (NHS) question on religion into nine core religious categories – Buddhist, Christian, Hindu, Jewish, Muslim, Sikh, Traditional (Aboriginal) Spirituality, other religions and no religious affiliation.[73] Among these, 67% of Canadians were self-identified as Christians in 2011.[74] The second, third, and fourth-largest categories were of Canadians with no religious affiliation at 24%, Canadian Muslims at 3%, and Canadian Hindus at 2%.[74]
Within the 2011 NHS results, StatCan further subcategorized Christianity in nine groups of its own – Anglican, Baptist, Catholic, Christian Orthodox, Lutheran, Pentecostal, Presbyterian, United Church and Other Christian.[73] Among these, 39% of Canadians were self-identified as Catholic in 2011.[74] The second and third-largest ungrouped subcategories of Christian Canadians were United at 6% and Anglican at 5%, while 9% of Christians were grouped into the Other Christian subcategory comprising numerous denominations.[74]
Of the 3,036,785 or 5% of Canadians identified as Other Christians:[74]
- 105,365 (0.3% of Canadians) were identified as Church of Jesus Christ of Latter-day Saints (LDS Church);
- 137,775 (0.4% of Canadians) were identified as Jehovah's Witness;
- 175,880 (0.5% of Canadians) were identified as Mennonite;
- 550,965 (1.7% of Canadians) were identified as Protestant; and
- 102,830 (0.3% of Canadians) were identified as Reformed.
| Religion status of the Canadian Population in 2011[74] | ||
|---|---|---|
| Religion | Total | Percent |
| Buddhist | 366,830 | 1% |
| Christian | 22,102,745 | 67% |
| Baptist | 635,840 | 2% |
| Roman Catholic | 12,810,705 | 39% |
| Christian Orthodox | 550,690 | 2% |
| Anglican | 1,631,845 | 5% |
| United Church | 2,007,610 | 6% |
| Pentecostal | 478,705 | 1% |
| Presbyterian | 472,385 | 1% |
| Lutheran | 478,185 | 1% |
| Other Christian | 3,036,785 | 9% |
| Hindu | 497,960 | 2% |
| Jewish | 329,500 | 1% |
| Muslim | 1,053,945 | 3% |
| Sikh | 454,965 | 1% |
| Traditional (Aboriginal) Spirituality | 64,940 | 0.2% |
| Other religions | 130,835 | 0.4% |
| No religious affiliation | 7,850,605 | 24% |
See also
- Demographics of North America
- 1666 census of New France
- Canada 2016 Census
- List of Canadian census areas demographic extremes
- Interprovincial migration in Canada
- Cahiers québécois de démographie academic journal
- Canadian Studies in Population academic journal
Notes
- In fertility rates, 2.1 and above is a stable population and has been marked blue, 2 and below leads to an aging population and the result is that the population decreases.
- All citizens of Canada are classified as "Canadians" as defined by Canada's nationality laws. However, "Canadian" as an ethnic group has since 1996 been added to census questionnaires for possible ancestry. "Canadian" was included as an example on the English
questionnaire and "Canadien" as an example on the French questionnaire. "The majority of respondents to this selection are from the eastern part of the country that was first settled. Respondents generally are visibly European (Anglophones and Francophones), but no-longer self identify with their ethnic ancestral origins. This response is attributed to a multitude or generational distance from ancestral lineage.
Source 1: Jack Jedwab (April 2008). "Our 'Cense' of Self: the 2006 Census saw 1.6 million 'Canadian'" (PDF). Association for Canadian Studies. Archived from the original (PDF) on October 2, 2011. Retrieved March 7, 2011.
Source 2: Don Kerr (2007). The Changing Face of Canada: Essential Readings in Population. Canadian Scholars' Press. pp. 313–317. ISBN 978-1-55130-322-2. - The category "North American Indian" includes respondents who indicated that their ethnic origins were from a Canadian First Nation, or another non-Canadian North American aboriginal group (excluding Inuit and Métis).
Source: "How Statistics Canada Identifies Aboriginal Peoples". Statistics Canada. Retrieved January 16, 2011. - The question on knowledge of languages allows for multiple responses. The following figures are from the 2021 Canadian Census.
- 2021 census: Combined responses of the Chinese languages, including Mandarin (987,300), Cantonese (724,925), Min Nan, Hakka, Wu (Shanghainese), Min Dong, Chinese, n.o.s.,[nb 1] and Chinese languages, n.i.e.[nb 2]
- 2021 census: Combined responses of Hindi (761,425) and Urdu (414,870) as they form mutually intelligible registers of the Hindustani language.
- The 1991 Census was the first to ask Canadians whether they could conduct a conversation in a language other than English or French[62]: 50
- 2021 census: Combined responses of Iranian Persian (222,160), Dari, and Persian (Farsi), n.o.s.,[nb 1] as they form mutually intelligible registers of the Persian language, and as they were all categorized under "Persian" in previous censuses.
- Including Bosnian, Croatian, Serbian, and Serbo-Croatian, n.i.e.[nb 2]
- 2021 census: Total number of speakers of the Cree-Innu languages, previously categorized under "Cree" in past censuses.
- French and non-official language OR
English, French and non-official language - French and non-official language OR
English, French and non-official language
References
- "Census Profile, 2021 Census of Population". February 9, 2022. Archived from the original on 2022-02-09. Retrieved February 9, 2022.
- Campion-Smith, Bruce (February 8, 2017). "Canada's population grew 1.7M in 5 years, latest census shows". Toronto Star. Archived from the original on February 8, 2017. Retrieved February 8, 2017.
- "Energy Efficiency Trends in Canada, 1990 to 2008". Natural Resources Canada. 2011. Archived from the original on December 22, 2015. Retrieved December 13, 2015.
- Edmonston, Barry; Fong, Eric (2011). The Changing Canadian Population. McGill-Queen's Press. p. 181. ISBN 978-0-7735-3793-4. Archived from the original on April 12, 2016.
- Zimmerman, Karla (2008). Canada (10th ed.). Lonely Planet. p. 51. ISBN 978-1-74104-571-0. Archived from the original on April 12, 2016.
- Hollifield, James; Martin, Philip; Orrenius, Pia (2014). Controlling Immigration: A Global Perspective, Third Edition. Stanford University Press. p. 11. ISBN 978-0-8047-8627-0. Archived from the original on January 6, 2017.
- Beaujot, Roderic P.; Kerr, Donald W. (2007). The Changing Face of Canada: Essential Readings in Population. Canadian Scholars' Press. p. 178. ISBN 978-1-55130-322-2. Archived from the original on April 12, 2016.
- Anderson, Stuart (2020). "Immigrants Flock To Canada, While U.S. Declines". Forbes. Retrieved April 16, 2020.
- Grubel, Herbert G. (2009). The Effects of Mass Immigration on Canadian Living Standards and Society. Fraser Institute. p. 5. ISBN 978-0-88975-246-7. Archived from the original on April 12, 2016.
- "Government of Canada Tables 2011 Immigration Plan". Canada News Centre. Archived from the original on December 3, 2010. Retrieved December 12, 2010.
- Simmons, Alan (2010). Immigration and Canada: Global and Transnational Perspectives. Canadian Scholars' Press. p. 92. ISBN 978-1-55130-362-8. Archived from the original on April 12, 2016.
- Jason, Markusoff (January 23, 2019). "Canada now brings in more refugees than the U.S." macleans.ca. Rogers Media.
- "Environment — Greenhouse Gases (Greenhouse Gas Emissions per Person)". Human Resources and Skills Development Canada. 2010. Archived from the original on 27 February 2014. Retrieved 23 June 2010.
- "The World FactBook – Canada", The World Factbook, 2022
- "Canada Population 2022", World Population Review
- Note: Crude migration change (per 1000) is a trend analysis, an extrapolation based average population change (current year minus previous) minus natural change of the current year (see table vital statistics). As average population is an estimate of the population in the middle of the year and not end of the year.
- "Population and dwelling counts: Canada, provinces and territories". Statistics Canada. February 9, 2022. Archived from the original on 2022-02-09. Retrieved February 9, 2022.
- Statistics Canada (2011). "Population data 2011 Census". Retrieved 2012-05-16.
- Statistics Canada (2005). "Land and freshwater area, by province and territory (2005)". Archived from the original on 2007-07-08. Retrieved 2007-07-22.
- "Population and dwelling counts, for Canada and census subdivisions (municipalities), 2021 and 2016 censuses". Statistics Canada. 9 February 2022. Retrieved 2022-02-09.
- Jacques Henripin (1972), Trends and Factors of Fertility in Canada (PDF), Ottawa: Statistics Canada, pp. 30, 33, archived (PDF) from the original on 2022-10-09
- "Fertility: Fewer children, older moms", Statistics Canada, July 17, 2018
- Roser, Max (2014-02-19). "Fertility Rate". Our World in Data.
- CO2 Emissions from Fuel Combustion Archived 2009-10-12 at the Wayback Machine Population 1971–2008 (pdf Archived 2012-01-06 at the Wayback Machine pages 83–85) IEA (OECD/ World Bank) original population ref e.g. in IEA Key World Energy Statistics 2010 page 57 "Archived copy". Archived from the original on September 25, 2015. Retrieved 2011-06-18.
{{cite web}}: CS1 maint: archived copy as title (link) CS1 maint: bot: original URL status unknown (link) - "Population Projections for Canada – Components of population growth, high-growth scenario – 2009/2010 to 2060/2061" (PDF). Statistics Canada. Catalogue no. 91-520. 2006. Archived (PDF) from the original on 2022-10-09. Retrieved September 8, 2013.
- "Canada to target over 400,000 immigrants per year | Canada Immigration News". 30 October 2020.
- "Canada To Dramatically Increase Immigration to More Than 400,000 Per Year - Canada Immigration and Visa Information. Canadian Immigration Services and Free Online Evaluation". 30 October 2020.
- "International Programs – U.S. Census Bureau". Census.gov. Retrieved 2012-01-22.
- "Life expectancy". Our World in Data. Retrieved 2018-08-28.
- "Census Profile: Canada (Country)". Statistics Canada. February 9, 2015. Retrieved August 30, 2015.
- Statistics Canada (2011). "Population by broad age groups and sex, including median age, 1921 to 2011 for both sex (2011 Census)". Retrieved 2012-05-29.
- B.R. Mitchell. International historical statistics: the Americas, 1750–2000.
- United nations. Demographic Yearbooks
- Government of Canada, Statistics Canada (February 1, 1995). "Statistics Canada: Canada's national statistical agency". www.statcan.gc.ca.
- "Estimates of births, deaths and marriages, Canada, provinces and territories quarterly (number)". Statistics Canada. Retrieved 22 June 2022.
- Simon, Patrick; Piché, Victor (2013). Accounting for Ethnic and Racial Diversity: The Challenge of Enumeration. Routledge. pp. 48–49. ISBN 978-1-317-98108-4.
- Bezanson, Kate; Webber, Michelle (2016). Rethinking Society in the 21st Century (4th ed.). Canadian Scholars' Press. pp. 455–456. ISBN 978-1-55130-936-1.
- Edmonston, Barry; Fong, Eric (2011). The Changing Canadian Population. McGill-Queen's University Press. pp. 294–296. ISBN 978-0-7735-3793-4.
- Government of Canada, Statistics Canada (January 25, 2017). "Population Projections for Canada and its Regions, 2011 to 2036". www150.statcan.gc.ca.
- Government of Canada, Statistics Canada (January 25, 2017). "Table 5: Population (in thousands) by visible minority group, Canada, 2011 (estimated) and 2036 (projected according to six scenarios)". www150.statcan.gc.ca.
- "Immigration and Ethnocultural Diversity Highlight Tables". statcan.gc.ca. 25 October 2017.
- Government of Canada, Statistics Canada (April 2, 2008). "Statistics Canada: Ethnocultural Portrait of Canada Highlight Tables, 2006 Census". www12.statcan.gc.ca.
- Government of Canada, Statistics Canada (2013-04-03). "1981 Census of Canada : volume 1 - national series : population = Recensement du Canada de 1981 : volume 1 - série nationale : population". www12.statcan.gc.ca. Retrieved 2022-08-24.
- Government of Canada, Statistics Canada (2017-10-25). "Number and proportion of visible minority population in Canada, 1981 to 2036". www12.statcan.gc.ca. Retrieved 2022-08-24.
- Government of Canada, Statistics Canada (2013-04-03). "Working paper : comparison of 1981 and 1986 census counts on visible minorities in Canada / Wendy Wright". www12.statcan.gc.ca. Retrieved 2022-09-04.
- Government of Canada, Statistics Canada (2013-04-03). "The aboriginal population and the Census : 120 years of information, 1871-1991 / Gustave Goldmann". www12.statcan.gc.ca. Retrieved 2022-09-04.
- Government of Canada, Statistics Canada (2013-04-03). "1991 employment equity data highlights". www12.statcan.gc.ca. Retrieved 2022-09-22.
- Statistics Canada, Population by Aboriginal Groups and Sex, Showing Age Groups, for Canada, 1996 Census (20% Sample Data)
- Statistics Canada, Total Population by Visible Minority Population, for Canada, 1996 Census (20% Sample Data)
- Belshaw, John Douglas (17 May 2016). "11.3 Natives by the Numbers". www.opentextbc.ca. Retrieved 2022-09-22.
- Statistics Canada, Community Highlights for Canada
- Statistics Canada Archived 2009-04-20 at the Wayback Machine, 2006 Community Profiles: Canada (Country)
- Statistics Canada, NHS Profile, Canada, 2011
- "Census Profile, 2016 Census". Statistics Canada. February 8, 2017. Retrieved February 16, 2018.
- Government of Canada, Statistics Canada (October 25, 2017). "Aboriginal Identity (9), Age (20), Registered or Treaty Indian Status (3) and Sex (3) for the Population in Private Households of Canada, Provinces and Territories, Census Metropolitan Areas and Census Agglomerations, 2016 Census - 25% Sample Data". www12.statcan.gc.ca.
- Government of Canada, Statistics Canada (2022-09-21). "Indigenous identity by Registered or Treaty Indian status: Canada, provinces and territories, census metropolitan areas and census agglomerations with parts". www12.statcan.gc.ca. Retrieved 2022-09-21.
- Government of Canada, Statistics Canada (2022-09-08). "Projected population by racialized group, generation status and other selected characteristics (x 1,000)". www12.statcan.gc.ca. Retrieved 2022-10-01.
- Government of Canada, Statistics Canada (2021-10-06). "Projected population by Indigenous identity, age group, sex, area of residence, provinces and territories, and projection scenario, Canada (x 1,000)". www12.statcan.gc.ca. Retrieved 2022-10-01.
- "Census Profile, 2016 Census – Canada". Statistics Canada. August 2, 2017.
- Census Profile – Province/Territory, Note 20
- Topic-based tabulations|Detailed Mother Tongue (103), Knowledge of Official Languages, 2006 Census of Canada Archived July 1, 2013, at the Wayback Machine
- Government of Canada, Statistics Canada (2001). "Languages in Canada: 2001 Census" (PDF). www12.statcan.gc.ca. Archived (PDF) from the original on 2022-10-09. Retrieved 2022-08-19.
- Government of Canada, Statistics Canada (2022-08-17). "Knowledge of languages by age and gender: Canada, provinces and territories, census metropolitan areas and census agglomerations with parts". www12.statcan.gc.ca. Retrieved 2022-10-12.
- Government of Canada, Statistics Canada (2022-08-17). "NHS Profile, Canada, 2011 Non-official language". www12.statcan.gc.ca. Retrieved 2022-08-24.
- "Topic-based tabulation:Various Non-official Languages Spoken (76), Age Groups (13) and Sex (3) for Population, for Canada, Provinces, Territories, Census Divisions and Census Subdivisions, 2001 Census - 20% Sample Data". Retrieved 24 August 2022.
- "Profile of Urban Forward Sortation Areas". Retrieved 24 August 2022.
- Government of Canada, Statistics Canada (2022-08-17). "Census Profile Language". www12.statcan.gc.ca. Retrieved 2022-08-24.
- "Knowledge of Official Languages (5), Age Groups (13) and Sex (3) for Population, for Canada, Provinces, Territories, Census Divisions, Census Subdivisions and Dissemination Areas, 2001 Census - 20% Sample Data". Retrieved 23 August 2022.
- "Census Profile, 2016 Census Canada [Country] and Canada [Country] Language used most often at work".
- Statistics Canada – Language used at work1 by frequency of language used at work and mother tongue, 2006 counts
- "Census Profile, 2016 Census Canada [Country] and Canada [Country] Language spoken most often at home". 8 February 2017.
- The percentage figures cited are the top languages spoken as a home language in Canada, shown as a percentage of total single responses. Source: Statistics Canada, 2006 Census Profile of Federal Electoral Districts (2003 Representation Order): Language, Mobility and Migration and Immigration and Citizenship. Ottawa, 2007, pp. 6–10. Data available online at: "Detailed Language Spoken Most Often at Home". 2006 Census of Canada: Topic-based tabulations. Statistics Canada. April 8, 2008. Retrieved January 15, 2010.
- "NHS Profile, Canada, 2011". Statistics Canada. November 27, 2015. Retrieved November 15, 2016.
- "Tabulation: Religion (108), Immigrant Status and Period of Immigration (11), Age Groups (10) and Sex (3) for the Population in Private Households of Canada, Provinces, Territories, Census Metropolitan Areas and Census Agglomerations, 2011 National Household Survey". Statistics Canada. January 7, 2016. Retrieved November 15, 2016.
Further reading
- Bumsted, J. M (2003). Canada's diverse peoples: a reference sourcebook. Library of Congress ( ABC-CLIO). ISBN 978-1-57607-672-9.
The people of Canada.
- Magocsi, Paul R (1999). Encyclopedia of Canada's peoples. Society of Ontario, University of Toronto Press. ISBN 978-0-8020-2938-6.
- Richard, Madeline (1992). Ethnic history and marital assimilation in Canada, 1871 and 1971. University of British Columbia Press. ISBN 978-0-7748-0431-8.
- Thornton, Russell (2000). Michael R. Haines, Richard Hall Steckel (ed.). A population history of North America. Cambridge: Cambridge University Press. ISBN 0-521-49666-7.
- Wilson, Donna M; Northcott, Herbert C (2008). Dying and Death in Canada. Toronto: University of Toronto Press. ISBN 978-1-55111-873-4.
- Roderic Beaujot and Don Kerr, (2007) The Changing Face of Canada: Essential Readings in Population, Canadian Scholars' Press, ISBN 978-1-55130-322-2.
External links
- Canada Year Book (2010) – Statistics Canada
- Population estimates and projections, 2010 – 2036 – Statistics Canada
- Canada's population clock
| |||||||||||||||||||||||||||||||||||||||||||||||||||||||||||||||||||||||||||||||||||||||||||||||||||||||||||||||||||||||||