Asthma and Obesity

Obesity is a risk factor for the development of asthma
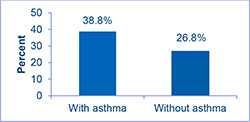
Obesity is associated significantly with the development of asthma, worsening asthma symptoms, and poor asthma control. This leads to increase medication use and hospitalizations. In 2010, the obesity rate among adults with current asthma (38.8%) was significantly higher than the rate among adults without current asthma (26.8%).
Percentage of adults who are obese

Obesity rates differ from state to state. The rate among adults with current asthma was significantly higher than the rate among adults without current asthma in almost all states (except AL, AR, DE, KS, MN, ND, NE, and NY), Puerto Rico, and the two territories. The highest obesity rates are clustered in the Midwest and South.
CDC’s National Asthma Control Program (NACP) was created in 1999 to help the millions of people with asthma in the United States gain control over their disease. The NACP conducts national asthma surveillance and funds states to help them improve their asthma surveillance and to focus efforts and resources where they are needed.
*Includes persons who answered “yes” to the questions: “Have you ever been told by a doctor, nurse, or other health professional that you had asthma?” and “Do you still have asthma?”
†Obesity status is determined by Body Mass Index (BMI in kilograms per meter squared) which is calculated by dividing respondent’s weight by their height.
Source: Behavioral Risk Factor Surveillance System (BRFSS), 2010
Download this AsthmaStats Factsheet [PDF - 211 KB] containing additional information.
| People with Asthma who are Obese | People without Asthma who are Obese | |
|---|---|---|
| STATE | % | % |
| U.S. Total¶ | 38.8 | 26.8 |
| AL | 46.3 | 31.9 |
| AK | 35.3 | 24.0 |
| AZ | 35.7 | 23.8 |
| AR | 48.7 | 29.3 |
| CA | 38.4 | 23.5 |
| CO | 30.2 | 20.5 |
| CT | 34.2 | 22.0 |
| DE | 44.7 | 26.9 |
| DC | 33.4 | 21.1 |
| FL | 36.2 | 26.4 |
| GA | 46.3 | 29.0 |
| HI | 37.5 | 21.5 |
| ID | 37.7 | 25.7 |
| IL | 42.8 | 27.3 |
| IN | 38.9 | 29.3 |
| IA | 39.5 | 28.3 |
| KS | 33.0 | 29.8 |
| KY | 38.9 | 31.1 |
| LA | 43.6 | 30.9 |
| ME | 37.3 | 26.1 |
| MD | 35.1 | 27.2 |
| MA | 31.5 | 22.7 |
| MI | 42.6 | 30.5 |
| MN | 32.9 | 24.7 |
| MS | 47.3 | 33.3 |
| MO | 45.0 | 29.9 |
| MT | 33.7 | 22.5 |
| NE | 37.2 | 26.7 |
| NV | 34.0 | 21.9 |
| NH | 30.9 | 24.6 |
| NJ | 34.5 | 23.9 |
| NM | 34.8 | 24.6 |
| NY | 34.0 | 23.3 |
| NC | 38.9 | 27.7 |
| ND | 29.7 | 27.5 |
| OH | 40.2 | 28.6 |
| OK | 41.3 | 30.2 |
| OR | 36.9 | 26.5 |
| PA | 38.2 | 28.2 |
| RI | 36.6 | 24.8 |
| SC | 43.4 | 30.9 |
| SD | 35.8 | 27.0 |
| TN | 40.8 | 31.1 |
| TX | 42.3 | 30.8 |
| UT | 34.0 | 22.0 |
| VT | 34.5 | 22.7 |
| VA | 47.4 | 24.6 |
| WA | 36.5 | 25.1 |
| WV | 40.8 | 32.3 |
| WI | 43.6 | 25.4 |
| WY | 36.4 | 24.6 |
| Territories and Commonwealth | ||
| GU | 57.6 | 26.2 |
| PR | 39.6 | 26.4 |
| VI | 45.6 | 28.9 |
¶ U.S. Total includes 50 states plus DC and excludes Puerto Rico and the two territories
- Page last reviewed: August 9, 2013
- Page last updated: August 9, 2013
- Content source:


 ShareCompartir