This article was co-authored by wikiHow Staff. Our trained team of editors and researchers validate articles for accuracy and comprehensiveness. wikiHow's Content Management Team carefully monitors the work from our editorial staff to ensure that each article is backed by trusted research and meets our high quality standards.
This article has been viewed 42,639 times.
Learn more...
FEMA flood maps are a useful tool you can access to gain awareness of the chances of flooding in your area. These maps divide areas into risk zones indicating the frequency and severity of flooding. Each map includes an index page and a legend explaining any numbers and symbols that appear on it. Flood maps are easy to understand, so take advantage of them to prepare for the chance of flooding in your area.
Steps
Assembling the Map
-
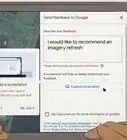
1Get a flood map from FEMA’s map service center. You can go online to FEMA’s website and find highly-detailed digital maps. Type an area into the website’s search bar to bring up the map. The maps are available at https://msc.fema.gov/portal.[1]
- You can also find maps in community map repositories. These are usually at your local government’s planning or zoning office.
-
2Read the index page to find out what areas are shown on the map. The index is a separate sheet of paper listing what areas are shown on the map. Since the maps are large, they may be broken down into separate panels. The index lists each community, followed by a corresponding panel number.[2]
- The index will also have a range indicating how many panels are included in the map. For example, 001-005 means the map has 5 panels.
Advertisement -
3Arrange the panels if the map is paper. FEMA makes a few different paper flood maps, so you may need to do some assembling before you can read yours. Take out all the numbered panels included within the map. Set them on a flat surface. Make sure the small arrow, positioned above the informational box on the right side, points upwards.
- A flat flood map includes multiple pages. Each page is a panel displaying a different part of the map.
- Z-fold flood maps are similar to road maps. They fold out into 1 large map.
-
4Locate the panel number on the panel’s title box. Each panel will have a title box, typically in the lower right corner. The title box contains all the clerical information about the panel, including the panel number. To view a particular area, select the panel with the same number listed in the index.
- The title box also lists the community name, the date the map was made, and other identification information.


Finding Key Locations
-
1Use the grid coordinates to locate flood-prone streets. Some maps include a list of flood-prone streets on the index page. Each street will be listed with a pair of coordinates, such as “A-2.” The coordinate system is listed along the edges of the map. Find the coordinates on the map to locate the street.[3]
- The letter coordinate is listed on the left side of the map and the number coordinate is on the top.
- For coordinates A-2, for example, find the A row on the left. Then count 2 squares to the right.
-
2Use landmarks to find specific locations on a map. You may notice that the maps don’t have a lot of details. Flood maps only list major roads, some secondary roads, and landmarks like bridges. These landmarks are what you use to estimate where specific properties are located on the map.
- For example, you might see Acadia and Birch roads labeled next to a pond. Use these landmarks to estimate the relative location of your home.
-
3Use the scale marker to measure distance. Look for a small black and white bar, usually on the upper right side of the page. It will have a number over it, like 500 or 1000. This scale helps you get a sense of the actual distance between locations as opposed to what is shrunken down to fit on a map. This is often used to figure out where locations are on the map.
- For example, your scale may have the number 500 over it. This means that every 1 in (2.5 cm) you move along the map is the same as traveling 500 ft (150 m) for real.
- To find a specific location, figure out how far it is from a listed landmark. Then use the scale to measure the location on the map.
-
4Note elevation reference markers listed on the map. Your map may list a few elevations in the mapping area. These can appear anywhere on the map. The elevation is listed on the map, followed by a quick note explaining what landmark it references. You can use this to help you navigate the map and understand how the elevation affects floodwater.
- For example, you may see a hill with an elevation of 50 ft (1,500 cm). This may be a high, safe point in the community in case of a flood.
-
5Read the map’s inset notes to find panels for special areas. Inset notes are printed directly on the map panels. In certain spots, you may see words like “See Panel 6” or “Panel not printed.” These notes are not on every map, but when they are, they explain how you can view specific map areas.
- Some areas, such as small areas with complicated flood zones, are printed in their own panels. Both the map and index will indicate which panel you should view.
- If a panel isn’t printed, this is because the entire area falls within one flood insurance risk zone. Read the index page for more information.
-
6Check the map’s footnotes for non-flood prone communities. Footnotes are printed at the bottom of some maps and index pages. If a community doesn’t have a flood map, it will still be listed in the index. The footnote will inform you that the community is not considered prone to flooding.
- Non-floodprone communities are far less likely to flood. However, it can still happen, especially in severe weather.


Using the Legend
-
1View the legend to understand what map symbols mean. The legend box is typically listed above the title box on the right side of the map. Every symbol that appears on the map will be listed in the legend along with an explanation of what the symbol means.
- For example, a dark line can be a high-risk flood zone boundary. A lighter line can be a lesser-risk flood zone boundary. A slash can represent a water barrier.
- The legend is like a key that helps you unlock the map’s meaning. Since the symbols differ between maps, always take a look at the legend.
-
2Use the zone designation letters to gauge the flooding risk. The legend explains the letter combinations representing zones on the map. The lettering starts at A in most areas and V for coastal areas. Later letters in the alphabet indicate a lower flooding risk.
- For example, any area labeled A has a high risk of flooding. An area labeled D has a minimal flooding risk.
- Combination letters like AE show that the legend and map provide extra information about the flooding severity and protective barriers in the area.
- High-risk areas in coastal regions are labeled as V. By contrast, zones labeled X are less at risk.
-
3Look for double lines or dots that represent water barriers. A pair of thick, black lines represent levees. These lines appear along some coastal areas. If you see a dotted line, that means the area has a seawall installed.[4]
- These installations are designed to resist flooding. You can follow the map line to see where they are installed.
-
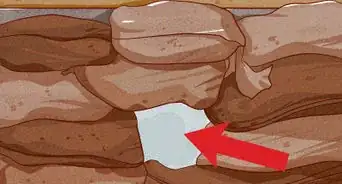
4Find black lines that mark waterways. Black lines are used to mark off bodies of water like rivers. A single black line is used to mark the centerline of a smaller waterways. Larger waterways may have a pair of black lines used to indicate the banks.
- The bank markers are much farther apart than the levee lines.
- Slash marks between these lines represent areas that have to be kept clear in order for the water to drain safely.
-
5Watch for wavy lines indicating different flood elevation levels. These wavy lines occur in bodies of water like rivers. They are only used if the base flood elevation measurement differs from place to place along the water. Each spot will be marked off by bold, black lines and have a number nearby. The number informs you how high the water is expected to rise during a flood.
- A higher base flood elevation number means more water during a flood. This is used to determine what kind of insurance property owners need.
- If the base flood elevation is the same across the water, it will be noted on the map.
-
6Note dark-colored areas at a high-risk of flooding. Read the legend to note the coloring scheme the map uses. On printed maps, the most vulnerable areas are colored dark gray. These areas have what is known as a 100-year flood risk, which means that they are more likely than other areas to flood.
- 100-year flood risk means that the area has a 1% or greater chance of a serious flood every year. It does not mean it floods once every 100 years.
- Remember that newer, digital maps may use different color schemes. Flooding areas tend to be marked blue.
-
7Find light-colored areas with less of a risk of flooding. Areas colored light gray are less at risk of flooding than the darker areas. These areas have are considered 500-year flood risks. They tend to flood less frequently, although the flooding can still cause a lot of damage.
- 500-year flood risk means that this area has a 0.2% likelihood to flood in a year.
-
8Note slashes marking off coastal barriers. Some colored regions are also covered by slash marks. These are special spots that have some natural flood-resistant structures like barrier islands and bodies of water. These are very delicate spots with special protections and requirements.
- These areas tend to be considered sensitive and protected by law. That means limiting building and landscaping in order to reduce the flooding risk.


Community Q&A
-
QuestionWhat does jurisdiction boundary mean on the flood map?
 AnimersCommunity AnswerJurisdictional boundaries are a collection of legislative, regulatory, political and general administrative boundaries sourced from Federal, State and Territory authorities.


References
About This Article