1985 Dublin County Council election in Dublin–Belgard
An election to the electoral county of Dublin–Belgard within Dublin County to Dublin County Council took place on 20 June 1985 as part of that year's Irish local elections. Councillors were elected from local electoral areas on the system of proportional representation by means of the single transferable vote voting for a five-year term of office.This term was extended for a further year, to 1991.[1][2]
| ||
26 seats to the electoral county of Dublin–Belgard within Dublin County Council | ||
|---|---|---|
|
| ||
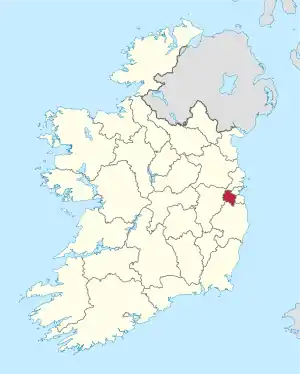 Map showing the area of Dublin–Belgard | ||
Dublin–Belgard was one of three electoral counties established by the Local Government (Reorganisation) Act 1985.[3][4]
Results by local electoral area
Clondalkin
| Party | Candidate | FPv% | Count | |||||||||
|---|---|---|---|---|---|---|---|---|---|---|---|---|
| 1 | 2 | 3 | 4 | 5 | 6 | 7 | 8 | 9 | ||||
| Fianna Fáil | Mary Harney TD* | 2,098 | ||||||||||
| Fianna Fáil | Colm McGrath | 1,111 | 1,210 | 1,227 | 1,232 | 1,304 | 1,332 | 1,375 | 1,420 | 1,560 | ||
| Fine Gael | Therese Ridge | 631 | 646 | 660 | 695 | 751 | 846 | 901 | 1,541 | 1,660 | ||
| Fianna Fáil | Noel Hayes | 618 | 768 | 780 | 789 | 823 | 882 | 974 | 994 | 1,204 | ||
| Fine Gael | Leon Hennessy | 597 | 613 | 626 | 635 | 667 | 730 | 773 | ||||
| Sinn Féin | Hugh Boyle | 573 | 582 | 593 | 604 | 640 | 687 | 932 | 946 | |||
| Workers' Party | Anne Finnegan | 481 | 487 | 499 | 532 | 579 | 681 | |||||
| Independent | Paul Price | 296 | 305 | 322 | 334 | |||||||
| Labour | Eugene Fitzsimons | 289 | 294 | 360 | 501 | 522 | ||||||
| Labour | Robert Dowds | 219 | 223 | 263 | ||||||||
| Labour | Declan O Broin | 197 | 204 | |||||||||
| Electorate: 15,983 Valid: 7,110 (44.97%) Spoilt: 78 Quota: 1,778 Turnout: 7,188 | ||||||||||||
Greenhills
| Party | Candidate | FPv% | Count | |||||||
|---|---|---|---|---|---|---|---|---|---|---|
| 1 | 2 | 3 | 4 | 5 | 6 | 7 | ||||
| Fianna Fáil | Chris Flood | 2,183 | ||||||||
| Fine Gael | Senator Larry McMahon* | 768 | 822 | 862 | 880 | 993 | 1,030 | 1,465 | ||
| Workers' Party | Terry Delaney | 742 | 782 | 852 | 864 | 994 | 1,190 | 1,262 | ||
| Independent | Gerry Jago | 588 | 726 | 781 | 793 | 851 | 917 | 952 | ||
| Fine Gael | Therese McGarry | 516 | 543 | 558 | 564 | 654 | 659 | |||
| Sinn Féin | Cliona Nic Mhurchu | 489 | 501 | 527 | 532 | 555 | ||||
| Fianna Fáil | Padraig Lynch | 443 | 841 | 877 | 1,179 | 1,225 | 1,314 | 1,370 | ||
| Labour | Kevin Forsyth | 429 | 450 | 494 | 512 | |||||
| Fianna Fáil | Richard Raymond | 227 | 362 | 386 | ||||||
| Independent | Sammy Macken | 220 | 233 | |||||||
| Green Alliance | Patricia Greene | 100 | 103 | |||||||
| Electorate: 14,967 Valid: 6,705 (45.41%) Spoilt: 94 Quota: 1,342 Turnout: 6,797 | ||||||||||
Lucan
| Party | Candidate | FPv% | Count | |||||||
|---|---|---|---|---|---|---|---|---|---|---|
| 1 | 2 | 3 | 4 | 5 | 6 | 7 | ||||
| Fianna Fáil | Liam Lawlor TD* | 1,827 | ||||||||
| Fianna Fáil | Finbarr Hanrahan | 1,091 | 1,126 | 1,145 | 1,182 | 1,643 | 1,715 | 1,937 | ||
| Fine Gael | Brian Fleming* | 1,067 | 1,071 | 1,087 | 1,243 | 1,322 | 1,593 | 1,714 | ||
| Fine Gael | Peter Brady | 991 | 996 | 1,008 | 1,029 | 1,034 | 1,169 | 1,294 | ||
| Workers' Party | Michael Finnegan | 992 | 905 | 981 | 1,038 | 1,058 | 1,129 | |||
| Labour | Michael Gannon* | 887 | 894 | 929 | 1,129 | 1,155 | 1,223 | 1,578 | ||
| Fine Gael | Tommy Morris | 601 | 603 | 609 | 653 | 673 | ||||
| Fianna Fáil | Dave McSweeney | 562 | 589 | 602 | 644 | |||||
| Labour | Michael Brennan | 556 | 557 | 579 | ||||||
| Green Alliance | Joseph Harden | 147 | 148 | |||||||
| Communist | Jean Roche | 77 | 77 | |||||||
| Electorate: 17,496 Valid: 8,708 (50.29%) Spoilt: 90 Quota: 1,742 Turnout: 8,798 | ||||||||||
Rathfarnam
| Party | Candidate | FPv% | Count | ||||||||
|---|---|---|---|---|---|---|---|---|---|---|---|
| 1 | 2 | 3 | 4 | 5 | 6 | 7 | 8 | ||||
| Fianna Fáil | Seamus Brennan TD | 1,957 | |||||||||
| Fine Gael | Alan Shatter TD* | 1,611 | |||||||||
| Fine Gael | Mary Muldoon | 867 | 899 | 920 | 1,038 | 1,133 | 1,759 | ||||
| Fianna Fáil | Ann Ormonde | 741 | 964 | 965 | 1,002 | 1,041 | 1,060 | 1,108 | 1,756 | ||
| Fianna Fáil | Stephen Riney | 668 | 756 | 757 | 780 | 819 | 833 | 858 | |||
| Independent | Tom Sharkey | 541 | 557 | 559 | 641 | 873 | 915 | 1,037 | 1,150 | ||
| Fine Gael | Anne D'Alton | 506 | 519 | 536 | 619 | 725 | |||||
| Green Alliance | Fiona Garland | 465 | 475 | 476 | 582 | ||||||
| Labour | Marie Woods | 460 | 471 | 475 | |||||||
| Electorate: 16,535 Valid: 7,816 (47.55%) Spoilt: 46 Quota: 1,564 Turnout: 7,862 | |||||||||||
Tallaght–Oldbawn
| Party | Candidate | FPv% | Count | ||||||||||||
|---|---|---|---|---|---|---|---|---|---|---|---|---|---|---|---|
| 1 | 2 | 3 | 4 | 5 | 6 | 7 | 8 | 9 | 10 | 11 | 12 | ||||
| Fianna Fáil | John Hannon | 1,146 | 1,150 | 1,160 | 1,179 | 1,199 | 1,231 | 1,278 | 1,308 | 1,383 | 1,781 | ||||
| Fianna Fáil | Jim Barry | 848 | 851 | 863 | 890 | 899 | 913 | 951 | 1,016 | 1,263 | 1,633 | ||||
| Fianna Fáil | Sean Basquille | 782 | 785 | 791 | 803 | 824 | 881 | 893 | 923 | 978 | |||||
| Sinn Féin | Stan Clarke | 608 | 615 | 620 | 650 | 656 | 668 | 698 | 870 | ||||||
| Fine Gael | Breda Cass | 582 | 593 | 608 | 624 | 741 | 837 | 904 | 947 | 990 | 1,082 | 1,162 | 1,184 | ||
| Fine Gael | Jim Higgins | 504 | 511 | 525 | 556 | 714 | 783 | 895 | 980 | 1,070 | 1,112 | 1,144 | 1,157 | ||
| Workers' Party | Brian McCabe | 381 | 401 | 414 | 494 | 501 | 560 | 632 | |||||||
| Fine Gael | Seamus Murphy | 348 | 361 | 370 | 382 | ||||||||||
| Democratic Socialist | Eamonn Maloney | 308 | 323 | 331 | |||||||||||
| Independent | Mary Kearney | 306 | 329 | 337 | 395 | 411 | 437 | ||||||||
| Labour | Tony Deegan | 255 | 262 | 362 | 390 | 404 | |||||||||
| Labour | Anne Kinsella | 189 | 202 | ||||||||||||
| Green Alliance | Freda O'Neill | 131 | |||||||||||||
| Electorate: 14,687 Valid: 6,388 (44.1%) Spoilt: 89 Quota: 1,598 Turnout: 6,477 | |||||||||||||||
Tallaght–Rathcoole
| Party | Candidate | FPv% | Count | |||||||||
|---|---|---|---|---|---|---|---|---|---|---|---|---|
| 1 | 2 | 3 | 4 | 5 | 6 | 7 | 8 | 9 | ||||
| Fianna Fáil | Seán Walsh TD* | 1,139 | 1,141 | 1,156 | 1,163 | 1,256 | 1,293 | 1,374 | 1,434 | 1,533 | ||
| Labour | Mervyn Taylor TD* | 944 | 960 | 996 | 1,030 | 1,054 | 1,348 | 1,726 | ||||
| Workers' Party | Pat Rabbitte | 917 | 925 | 991 | 1,003 | 1,039 | 1,065 | 1,087 | 1,135 | 1,547 | ||
| Sinn Féin | John Noonan | 794 | 796 | 837 | 852 | 882 | 922 | 948 | 961 | |||
| Fianna Fáil | Charlie O'Connor | 722 | 727 | 738 | 746 | 937 | 954 | 990 | 1,017 | 1,141 | ||
| Labour | Austin Nolan | 473 | 480 | 489 | 492 | 501 | ||||||
| Fine Gael | Brid Hayes | 439 | 445 | 448 | 605 | 610 | 674 | |||||
| Fianna Fáil | Mary Morton | 361 | 364 | 396 | 399 | |||||||
| Fine Gael | Frank Farrell | 238 | 240 | 242 | ||||||||
| Independent | Stephen Mahon | 225 | 229 | |||||||||
| Green Alliance | Kate O'Brien | 57 | ||||||||||
| Electorate: 12,980 Valid: 6,309 (49.18%) Spoilt: 74 Quota: 1,578 Turnout: 6,383 | ||||||||||||
Terenure
| Party | Candidate | FPv% | Count | |||||||||||
|---|---|---|---|---|---|---|---|---|---|---|---|---|---|---|
| 1 | 2 | 3 | 4 | 5 | 6 | 7 | 8 | 9 | 10 | 11 | ||||
| Fine Gael | Stanley Laing* | 2,017 | ||||||||||||
| Fianna Fáil | Sean Ardagh | 1,356 | 1,362 | 1,371 | 1,417 | 1,440 | 1,466 | 1,495 | 1,513 | 1,789 | ||||
| Fianna Fáil | Seamus McGowan | 1,120 | 1,128 | 1,133 | 1,195 | 1,230 | 1,253 | 1,305 | 1,325 | 1,639 | 2,372 | |||
| Fianna Fáil | Gerry Mullally | 858 | 866 | 871 | 906 | 916 | 925 | 937 | 965 | 1,074 | ||||
| Independent | Seamus Ashe | 760 | 765 | 809 | 871 | 885 | 1,048 | 1,127 | 1,149 | 1,202 | 1,256 | 1,395 | ||
| Fianna Fáil | Sonny Knowles | 724 | 728 | 735 | 766 | 772 | 789 | 854 | 872 | |||||
| Fine Gael | Martin Lynch | 708 | 824 | 853 | 865 | 909 | 929 | 978 | 1,627 | 1,662 | 1,770 | |||
| Fine Gael | Declan Ryan* | 612 | 676 | 694 | 704 | 771 | 787 | 851 | ||||||
| Labour | Éamonn Walsh | 583 | 589 | 600 | 614 | 720 | 802 | 1,172 | 1,220 | 1,252 | 1,281 | 1,335 | ||
| Labour | Tom Murtagh | 549 | 554 | 562 | 576 | 679 | 760 | |||||||
| Workers' Party | Shay Kelly | 388 | 390 | 437 | 453 | 475 | ||||||||
| Labour | Katherine Maguire | 385 | 402 | 425 | 442 | |||||||||
| Independent | Michael J. Stokes | 310 | 315 | 335 | ||||||||||
| Green Alliance | Denis Deasy | 228 | 232 | |||||||||||
| Electorate: 23,022 Valid: 10,598 (46.46%) Spoilt: 93 Quota: 1,767 Turnout: 10,695 | ||||||||||||||
External links
References
- Local Elections (Specification of Local Election Year) Order 1990 (S.I. No. 104 of 1990). Signed on 30 April 1990. Statutory Instrument of the Government of Ireland. Retrieved from Irish Statute Book.
- "Local Elections, 1985: Election Results and Transfer of Votes" (PDF). Department of the Environment. pp. 36–47. Retrieved 13 December 2021.
- Local Government (Reorganisation) Act 1985, s. 13: Establishment, membership and election of councils of established electoral counties (No. 7 of 1985, s. 13). Enacted on 3 April 1985. Act of the Oireachtas. Retrieved from Irish Statute Book on 13 December 2021.
- Dublin Electoral Counties Order 1985 (S.I. No. 133 of 1985). Signed on 10 May 1985. Statutory Instrument of the Government of Ireland. Retrieved from Irish Statute Book on 13 December 2021.
This article is issued from Wikipedia. The text is licensed under Creative Commons - Attribution - Sharealike. Additional terms may apply for the media files.