1991 Dublin County Council election in Dún Laoghaire–Rathdown
An election to Dublin County Council in the electoral county of Dún Laoghaire–Rathdown within Dublin County took place on 27 June 1991 as part of that year's Irish local elections. 28 councillors were elected from 7 local electoral areas on the system of proportional representation by means of the single transferable vote for a five-year term of office.[1] It was one of three electoral counties within Dublin County at this election, the others being Fingal and South Dublin.
| |||||||||||||||||||||||||||||||||||||
28 seats on the council of the electoral county of Dún Laoghaire–Rathdown within Dublin County Council | |||||||||||||||||||||||||||||||||||||
|---|---|---|---|---|---|---|---|---|---|---|---|---|---|---|---|---|---|---|---|---|---|---|---|---|---|---|---|---|---|---|---|---|---|---|---|---|---|
| |||||||||||||||||||||||||||||||||||||
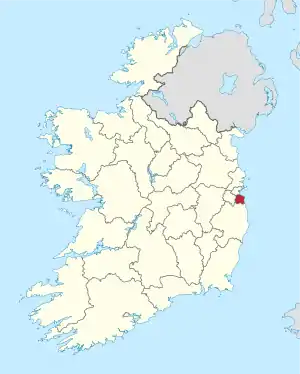 Map showing the area of Dún Laoghaire–Rathdown | |||||||||||||||||||||||||||||||||||||
| |||||||||||||||||||||||||||||||||||||
The councillors elected for the electoral areas of Ballybrack, Blackrock and Dún Laoghaire also served as the members of the Corporation of Dún Laoghaire, the council of the Borough of Dún Laoghaire.
From 1 January 1994, on the coming into effect of the Local Government (Dublin) Act 1993, County Dublin was disestablished as an administrative county, and in its place the electoral counties became three new counties. The Borough of Dún Laoghaire was also disestablished as of that date. The councillors listed below became the councillors for Dún Laoghaire–Rathdown County Council from that date.[2]
The term of office was extended twice, first to 1998, then to 1999.[3][4]
Results by party
| Party | Seats | ± | First Pref. votes | FPv% | ±% | |
|---|---|---|---|---|---|---|
| Fianna Fáil | 8 | −5 | 17,833 | 30.3 | ||
| Fine Gael | 7 | −4 | 14,007 | 23.8 | ||
| Labour | 5 | +2 | 7,437 | 12.6 | ||
| Green | 3 | +3 | 6,737 | 11.5 | ||
| Workers' Party | 3 | +2 | 6,390 | 10.9 | ||
| Progressive Democrats | 2 | +2 | 4,823 | 8.2 | ||
| Totals | 28 | 0 | 58,862 | 100.0 | — | |
Results by local electoral area
Ballybrack
| Party | Candidate | FPv% | Count | ||||||||||
|---|---|---|---|---|---|---|---|---|---|---|---|---|---|
| 1 | 2 | 3 | 4 | 5 | 6 | 7 | 8 | 9 | 10 | ||||
| Workers' Party | Eamon Gilmore TD* | 21.15% | 2,104 | ||||||||||
| Progressive Democrats | Larry Lohan | 10.4% | 1,035 | 1,050 | 1,065 | 1,096 | 1,140 | 1,173 | 1,240 | 1,298 | 1,428 | 1,531 | |
| Labour | Frank Smyth | 10.7% | 1,063 | 1,068 | 1,106 | 1,148 | 1,197 | 1,395 | 1,428 | 1,464 | 1,531 | 1,613 | |
| Fine Gael | Donal Marren* | 9.8% | 972 | 999 | 1,020 | 1,053 | 1,076 | 1,118 | 1,376 | 1,422 | 1,931 | ||
| Fianna Fáil | Senator Richard Conroy* | 7.9% | 784 | 796 | 865 | 1,056 | 1,077 | 1,097 | 1,119 | 1,600 | 1,670 | ||
| Fine Gael | Colm Brophy | 6.9% | 684 | 698 | 711 | 721 | 740 | 762 | 926 | 947 | |||
| Green | Maggie Blake | 6.4% | 640 | 656 | 674 | 693 | 1,003 | 1,169 | 1,226 | 1,290 | 1,390 | 1,477 | |
| Fine Gael | Barbara Culleton* | 5.8% | 579 | 589 | 597 | 613 | 635 | 647 | |||||
| Fianna Fáil | Noirin Butler | 5.4% | 534 | 540 | 611 | 717 | 738 | 756 | 776 | ||||
| Green | Vincent Treanor | 5% | 500 | 516 | 530 | 551 | |||||||
| Fianna Fáil | Owen Hammond* | 4.3% | 428 | 444 | 526 | ||||||||
| Fianna Fáil | Noel Long | 3.64% | 362 | 379 | |||||||||
| Workers' Party | Sylvie Batt | 3.35% | 333 | 556 | 568 | 587 | 609 | ||||||
| Electorate: 24,024 Valid: 9,959 (41.5%) Spoilt: 81 Quota: 1,659 Turnout: 10,040 (41.8%) | |||||||||||||
Blackrock
| Party | Candidate | FPv% | Count | |||||||||
|---|---|---|---|---|---|---|---|---|---|---|---|---|
| 1 | 2 | 3 | 4 | 5 | 6 | 7 | 8 | 9 | ||||
| Labour | Niamh Bhreathnach | 16.1% | 1,303 | 1,317 | 1,354 | 1,390 | 1,538 | 1,939 | ||||
| Fianna Fáil | Paddy Madigan* | 13.4% | 1,089 | 1,101 | 1,139 | 1,336 | 1,393 | 1,496 | 1,524 | 1,580 | 1,605 | |
| Fine Gael | John H. Dockrell* | 10.3% | 839 | 846 | 869 | 888 | 1,024 | 1,065 | 1,098 | 1,789 | ||
| Workers' Party | Marian White | 10.3% | 833 | 850 | 884 | 909 | 941 | |||||
| Fine Gael | Aine Elliot* | 9.8% | 798 | 806 | 835 | 849 | 969 | 1,052 | 1,096 | |||
| Fianna Fáil | Anne Brady* | 9.7% | 784 | 791 | 827 | 1,132 | 1,187 | 1,221 | 1,246 | 1,370 | 1,399 | |
| Progressive Democrats | Evelynne Davis | 8.6% | 697 | 708 | 736 | 761 | ||||||
| Fianna Fáil | Michael Cotter | 7.9% | 641 | 647 | 661 | |||||||
| Green | Betty Reeves | 6.1% | 492 | 711 | 786 | 808 | 982 | 1,191 | 1,370 | 1,514 | 1,627 | |
| Independent | Marie Walker | 4% | 324 | 327 | ||||||||
| Green | Michael Dunphy | 3.8% | 309 | |||||||||
| Electorate: 19,450 Valid: 8,109 (41.7%) Spoilt: 51 Quota: 1,623 Turnout: 8,160 (42%) | ||||||||||||
Clonskeagh
| Party | Candidate | FPv% | Count | |||||
|---|---|---|---|---|---|---|---|---|
| 1 | 2 | 3 | 4 | 5 | ||||
| Fine Gael | Tom Hand* | 24.5% | 1,443 | 1,482 | ||||
| Fianna Fáil | Seamus Brock* | 16.2% | 956 | 970 | 979 | 1,058 | 1,580 | |
| Green | Richard Greene | 14.9% | 876 | 939 | 1,045 | 1,405 | 1,517 | |
| Fine Gael | Nuala Fennell TD | 13.7% | 809 | 823 | 937 | 1,094 | 1,163 | |
| Fianna Fáil | Tim Gilbert | 11.8% | 694 | 701 | 721 | 755 | ||
| Labour | Peter Nolan | 9.3% | 547 | 675 | 705 | |||
| Independent | Maurice Dockrell | 4.9% | 288 | 298 | ||||
| Workers' Party | Chris Woods | 4.8% | 280 | |||||
| Electorate: 14,294 Valid: 5,893 (41.2%) Spoilt: 42 Quota: 1,474 Turnout: 5,935 (41.5%) | ||||||||
Dundrum
| Party | Candidate | FPv% | Count | ||||||
|---|---|---|---|---|---|---|---|---|---|
| 1 | 2 | 3 | 4 | 5 | 6 | ||||
| Fianna Fáil | Tom Kitt TD* | 27.9% | 2,203 | ||||||
| Fianna Fáil | Tony Fox* | 16.1% | 1,273 | 1,537 | 1,571 | 1,916 | |||
| Fine Gael | Mary Elliott* | 15.6% | 1,231 | 1,306 | 1,340 | 1,399 | 1,818 | ||
| Labour | Frank Buckley* | 13.4% | 1,055 | 1,100 | 1,371 | 1,402 | 1,488 | 1,543 | |
| Green | Jim Ryan | 9.7% | 768 | 806 | 910 | 969 | 1,029 | 1,108 | |
| Fine Gael | Austin Corcoran | 6.7% | 528 | 561 | 579 | 600 | |||
| Workers' Party | Pat Brady | 5.9% | 464 | 475 | |||||
| Fianna Fáil | Siobhan Lawlor | 4.7% | 367 | 526 | 534 | ||||
| Electorate: 17,467 Valid: 7,889 (45.2%) Spoilt: 55 Quota: 1,578 Turnout: 7,944 (45.5%) | |||||||||
Dún Laoghaire
| Party | Candidate | FPv% | Count | |||||||||
|---|---|---|---|---|---|---|---|---|---|---|---|---|
| 1 | 2 | 3 | 4 | 5 | 6 | 7 | 8 | 9 | ||||
| Fine Gael | Senator Liam T. Cosgrave* | 15.5% | 1,759 | 1,859 | 1,887 | 1,903 | ||||||
| Fianna Fáil | Betty Coffey* | 13.6% | 1,547 | 1,550 | 1,568 | 1,762 | 1,819 | 1,958 | ||||
| Progressive Democrats | Senator Helen Keogh | 11.9% | 1,346 | 1,380 | 1,420 | 1,431 | 1,580 | 1,599 | 1,602 | 1,690 | 1,847 | |
| Workers' Party | Colm Breathnach | 10.8% | 1,227 | 1,232 | 1,244 | 1,253 | 1,271 | 1,495 | 1,512 | 1,576 | 1,669 | |
| Labour | Jane Dillon-Byrne* | 10.1% | 1,149 | 1,170 | 1,210 | 1,224 | 1,302 | 1,361 | 1,372 | 1,453 | 1,595 | |
| Fianna Fáil | Bill Harvey* | 7.6% | 861 | 861 | 870 | 976 | 1,019 | 1,070 | 1,097 | 1,120 | ||
| Green | Vincent MacDowell | 6.2% | 700 | 708 | 791 | 801 | 856 | 922 | 926 | 1,440 | 1,566 | |
| Sinn Féin | Kevin Fitzpatrick | 6.1% | 688 | 695 | 700 | 712 | 716 | |||||
| Green | Jane Sexton | 5.4% | 611 | 637 | 690 | 703 | 778 | 838 | 841 | |||
| Fine Gael | Brendan Henderson* | 4.2% | 474 | 637 | 690 | 703 | 778 | 838 | 841 | |||
| Fianna Fáil | Labhras O Murchú | 3.4% | 384 | 385 | 393 | |||||||
| Independent | Thomas O'Rafferty | 2.8% | 320 | 330 | ||||||||
| Fine Gael | Donna Pierce | 2.4% | 275 | |||||||||
| Independent | Jim Merriman | 0.13 | 15 | 395 | ||||||||
| Electorate: 27,220 Valid: 11,356 (41.7%) Spoilt: 118 Quota: 1,893 Turnout: 11,474 (42.2%) | ||||||||||||
Glencullen
| Party | Candidate | FPv% | Count | ||||||||
|---|---|---|---|---|---|---|---|---|---|---|---|
| 1 | 2 | 3 | 4 | 5 | 6 | 7 | 8 | ||||
| Fine Gael | Seán Barrett TD | 16.8% | 1,272 | 1,295 | 1,602 | 1,718 | 1,987 | ||||
| Fianna Fáil | Larry Butler | 16.4% | 1,239 | 1,379 | 1,437 | 1,477 | 1,600 | 1,626 | 2,415 | ||
| Workers' Party | Denis O'Callaghan | 15.2% | 1,149 | 1,159 | 1,174 | 1,389 | 1,442 | 1,459 | 1,560 | 1,622 | |
| Fianna Fáil | Jimmy Murphy* | 14.5% | 1,094 | 1,160 | 1,178 | 1,194 | 1,237 | 1,244 | |||
| Green | Alastair McKinstry | 10.7% | 809 | 818 | 853 | 1,004 | 1,216 | 1,263 | 1,412 | 1,594 | |
| Progressive Democrats | Sean O Siocháin | 8.3% | 630 | 633 | 688 | 752 | |||||
| Labour | Deirdre Cox | 7.8% | 588 | 591 | 615 | ||||||
| Fine Gael | Sam Carroll* | 6.7% | 509 | 521 | |||||||
| Fianna Fáil | John Brennan | 3.5% | 267 | ||||||||
| Electorate: 18,775 Valid: 7,557 (40.3%) Spoilt: 44 Quota: 1,890 Turnout: 7,601 (40.5%) | |||||||||||
Stillorgan
| Party | Candidate | FPv% | Count | ||||||||
|---|---|---|---|---|---|---|---|---|---|---|---|
| 1 | 2 | 3 | 4 | 5 | 6 | 7 | 8 | ||||
| Labour | Eithne Fitzgerald* | 22.2% | 1,800 | ||||||||
| Fine Gael | Olivia Mitchell* | 17.1% | 1,387 | 1,441 | 1,773 | ||||||
| Green | Larry Gordon | 12.7% | 1,032 | 1,093 | 1,117 | 1,154 | 1,181 | 1,289 | 1,781 | ||
| Fianna Fáil | Paddy Hickey* | 11.6% | 940 | 951 | 961 | 967 | 1,130 | 1,164 | 1,280 | 1,363 | |
| Fianna Fáil | Senator Don Lydon* | 11.4% | 924 | 934 | 958 | 965 | 1,170 | 1,204 | 1,399 | 1,475 | |
| Progressive Democrats | Anna Murphy | 7.2% | 582 | 596 | 622 | 671 | 709 | 1,134 | |||
| Progressive Democrats | Victor Boyhan | 6.6% | 533 | 545 | 574 | 622 | 646 | ||||
| Fianna Fáil | Carmel Ryan | 5.7% | 462 | 470 | 473 | 477 | |||||
| Fine Gael | Eugene Cranley | 5.5% | 448 | 456 | |||||||
| Electorate: 19,000 Valid: 8,108 (42.7%) Spoilt: 44 Quota: 1,622 Turnout: 8,152 (42.9%) | |||||||||||
References
- Dublin Electoral Counties Order 1985 (S.I. No. 133 of 1985). Signed on 10 May 1985. Statutory Instrument of the Government of Ireland. Retrieved from Irish Statute Book on 13 December 2021.
- Local Government (Dublin) Act 1993, s. 12: Membership and cathaoirleach of county councils (No. 31 of 1993, s. 12). Enacted on 21 December 1993. Act of the Oireachtas. Retrieved from Irish Statute Book on 13 December 2021.
- Local Government Act 1994, s. 20: Year of elections to all local authorities (No. 8 of 1994, s. 20). Enacted on 29 April 1994. Act of the Oireachtas. Retrieved from Irish Statute Book.
- Local Government Act 1998, s. 10: Amendment of section 20 of Act of 1994 (No. 16 of 1998, s. 10). Enacted on 29 May 1998. Act of the Oireachtas. Retrieved from Irish Statute Book.
External links
| Dublin Corporation/City Council | |
|---|---|
| Dún Laoghaire–Rathdown County Council | |
| Fingal County Council | |
| South Dublin County Council | |
| Dublin County Council | |