2004 Dublin City Council election
An election to Dublin City Council took place on 11 June 2004 as part of that year's Irish local elections. 52 councillors were elected from thirteen local electoral areas (LEAs) for a five-year term of office on the electoral system of proportional representation by means of the single transferable vote (PR-STV).
| |||||||||||||||||||||||||||||||||||||||||||||||||||||
All 52 seats on Dublin City Council | |||||||||||||||||||||||||||||||||||||||||||||||||||||
|---|---|---|---|---|---|---|---|---|---|---|---|---|---|---|---|---|---|---|---|---|---|---|---|---|---|---|---|---|---|---|---|---|---|---|---|---|---|---|---|---|---|---|---|---|---|---|---|---|---|---|---|---|---|
| |||||||||||||||||||||||||||||||||||||||||||||||||||||
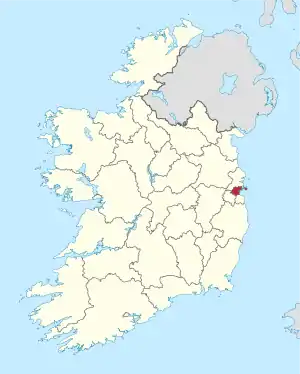 Map showing the area of Dublin City Council | |||||||||||||||||||||||||||||||||||||||||||||||||||||
| |||||||||||||||||||||||||||||||||||||||||||||||||||||
Results by party
| Party | Seats | ± | First Pref. votes | FPv% | ±% | |
|---|---|---|---|---|---|---|
| Labour | 16 | 36,057 | 20.57 | |||
| Fianna Fáil | 12 | 39,865 | 22.74 | |||
| Sinn Féin | 10 | 32,639 | 18.62 | |||
| Fine Gael | 9 | 29,873 | 17.04 | |||
| Green | 1 | 11,314 | 6.46 | |||
| Progressive Democrats | 1 | 6,404 | 3.65 | |||
| Socialist Workers | 0 | 2,904 | 1.66 | |||
| Workers' Party | 0 | 1,564 | 0.89 | |||
| Socialist Party | 0 | 579 | 0.33 | |||
| Christian Solidarity | 0 | 214 | 0.12 | |||
| Independent | 3 | 13,861 | 7.90 | |||
| Totals | 52 | 175,274 | 100.00 | — | ||
Results by local electoral area
Artane
| Party | Candidate | FPv% | Count | |||||||
|---|---|---|---|---|---|---|---|---|---|---|
| 1 | 2 | 3 | 4 | 5 | 6 | 7 | ||||
| Sinn Féin | Larry O'Toole* | 32.11 | 4,497 | |||||||
| Fine Gael | Terence Flanagan | 18.52 | 2,594 | 2,776 | 2,944 | |||||
| Fianna Fáil | Seán Paul Mahon* | 12.30 | 1,723 | 1,883 | 1,895 | 1,963 | 2,789 | 2,800 | 2,945 | |
| Labour | Paddy Bourke | 9.31 | 1,304 | 1,501 | 1,519 | 1,687 | 1,771 | 1,815 | 2,217 | |
| Fianna Fáil | Brian Taylor | 8.11 | 1,136 | 1,219 | 1,239 | 1,301 | ||||
| Labour | Sinead Seery | 7.08 | 991 | 1,262 | 1,304 | 1,486 | 1,607 | 1,657 | 2,027 | |
| Socialist Workers | Ritchie Browne | 5.65 | 792 | 1,328 | 1,341 | 1,568 | 1,629 | 1,634 | ||
| Green | Simon Herbert | 4.93 | 691 | 915 | 937 | |||||
| Fine Gael | Dan Sullivan | 1.98 | 278 | 320 | ||||||
| Electorate: 26,316 Valid: 14,006 (53.22%) Spoilt: 424 Quota: 2,802 Turnout: 14,430 (54.83%) | ||||||||||
Ballyfermot
| Party | Candidate | FPv% | Count | ||||
|---|---|---|---|---|---|---|---|
| 1 | 2 | 3 | 4 | ||||
| Sinn Féin | Tony Smithers | 21.17 | 1,970 | 2,037 | 2,112 | 2,256 | |
| Labour | Michael Conaghan* | 20.70 | 1,926 | 2,049 | 2,205 | 2,668 | |
| Independent | Vincent Jackson* | 20.63 | 1,920 | 2,043 | 2,265 | 2,453 | |
| Socialist Workers | Bríd Smith | 11.76 | 1,094 | 1,166 | 1,199 | 1,256 | |
| Fine Gael | Peter O'Neill | 10.56 | 983 | 1,043 | 1,187 | ||
| Fianna Fáil | Marian McGennis* | 8.61 | 801 | 866 | |||
| Green | Sinead Ni Bhroin | 2.35 | 219 | ||||
| Progressive Democrats | Ben Doyle | 2.20 | 205 | ||||
| Workers' Party | Andrew McGuinness | 2.02 | 188 | ||||
| Electorate: 19,463 Valid: 9,306 (47.81%) Spoilt: 264 Quota: 2,327 Turnout: 9,570 (49.17%) | |||||||
Ballymun-Whitehall
| Party | Candidate | FPv% | Count | |||||||
|---|---|---|---|---|---|---|---|---|---|---|
| 1 | 2 | 3 | 4 | 5 | 6 | 7 | ||||
| Sinn Féin | Ray Corcoran | 24.20 | 2,270 | 2,324 | 2,355 | |||||
| Labour | Andrew Montague | 17.89 | 1,678 | 1,721 | 1,807 | 1,987 | 2,057 | 2,486 | ||
| Fianna Fáil | Julia Carmichael | 16.17 | 1,517 | 1,534 | 1,562 | 1,585 | 1,867 | 1,934 | 2,463 | |
| Fine Gael | Brendan Brady | 12.25 | 1,149 | 1,155 | 1,200 | 1,240 | 1,286 | 1,365 | 1,457 | |
| Fianna Fáil | Sheila Gallogly* | 6.54 | 613 | 616 | 629 | 651 | 809 | 812 | ||
| Labour | Eamonn O'Brien* | 6.44 | 604 | 626 | 645 | 710 | 725 | |||
| Fianna Fáil | Padraig Johnston | 6.32 | 593 | 597 | 611 | 624 | ||||
| Workers' Party | John Dunne | 4.04 | 379 | 442 | 474 | |||||
| Green | Dermot Hamilton | 3.42 | 321 | 346 | ||||||
| Socialist Workers | Kevin Wingfield | 2.73 | 256 | |||||||
| Electorate: 19,188 Valid: 9,380 (48.88%) Spoilt: 279 Quota: 2,346 Turnout: 9,659 (50.34%) | ||||||||||
Cabra-Glasnevin
| Party | Candidate | FPv% | Count | ||||||||||
|---|---|---|---|---|---|---|---|---|---|---|---|---|---|
| 1 | 2 | 3 | 4 | 5 | 6 | 7 | 8 | 9 | 10 | ||||
| Sinn Féin | Nicky Kehoe* | 19.88 | 3,609 | ||||||||||
| Labour | Brendan Carr* | 11.12 | 2,019 | 2,042 | 2,053 | 2,435 | 2,525 | 3,021 | 3,208 | ||||
| Fianna Fáil | Mary Fitzpatrick* | 10.18 | 1,848 | 1,872 | 1,902 | 1,917 | 1,952 | 2,005 | 2,108 | 2,114 | 2,753 | 2,815 | |
| Independent | Ciaran Perry | 9.65 | 1,753 | 1,843 | 1,931 | 1,955 | 2,142 | 2,346 | 2,421 | 2,434 | 2,579 | 2,612 | |
| Fianna Fáil | Maurice Ahern* | 9.59 | 1,742 | 1,761 | 1,785 | 1,806 | 1,846 | 1,917 | 2,035 | 2,052 | 2,668 | 2,705 | |
| Fine Gael | Paschal Donohoe | 9.38 | 1,703 | 1,712 | 1,722 | 1,766 | 1,796 | 1,928 | 2,795 | 2,886 | 3,159 | ||
| Fianna Fáil | John Stephens | 8.89 | 1,615 | 1,632 | 1,661 | 1,676 | 1,705 | 1,757 | 1,876 | 1,884 | |||
| Fine Gael | Chris Giblin* | 7.66 | 1,391 | 1,397 | 1,417 | 1,487 | 1,518 | 1,620 | |||||
| Green | Thomas Simpson | 6.18 | 1,122 | 1,135 | 1,168 | 1,229 | 1,342 | ||||||
| Labour | Fintan Gibney | 3.62 | 658 | 667 | 675 | ||||||||
| Sinn Féin | Aine Ni Gabhann | 2.19 | 397 | 766 | 778 | 798 | |||||||
| Independent | Pat Talbot | 1.65 | 300 | 303 | |||||||||
| Electorate: 32,485 Valid: 18,157 (55.89%) Spoilt: 480 Quota: 3,027 Turnout: 18,637 (57.37%) | |||||||||||||
Clontarf
| Party | Candidate | FPv% | Count | |||||||||
|---|---|---|---|---|---|---|---|---|---|---|---|---|
| 1 | 2 | 3 | 4 | 5 | 6 | 7 | 8 | 9 | ||||
| Fianna Fáil | Deirdre Heney* | 21.79 | 4,487 | |||||||||
| Fine Gael | Gerry Breen* | 15.51 | 3,193 | 3,270 | 3,289 | 3,536 | ||||||
| Fine Gael | Naoise O Muiri | 9.86 | 2,029 | 2,112 | 2,156 | 2,322 | 2,379 | 2,416 | 2,606 | 2,789 | 2,937 | |
| Green | Bronwen Maher | 7.65 | 1,576 | 1,645 | 1,716 | 1,815 | 1,914 | 1,924 | 2,335 | 2,445 | 2,976 | |
| Sinn Féin | Peter Lawlor | 7.18 | 1,478 | 1,516 | 1,549 | 1,578 | 1,649 | 1,651 | 1,865 | 1,940 | ||
| Fianna Fáil | Eibhlin Byrne* | 6.90 | 1,421 | 1,776 | 1,789 | 1,903 | 1,960 | 1,974 | 2,090 | 3,107 | 3,346 | |
| Labour | Orla Farrell* | 6.75 | 1,389 | 1,419 | 1,444 | 1,523 | 2,198 | 2,217 | 2,491 | 2,584 | 2,935 | |
| Independent | Fintan Cassidy* | 6.52 | 1,343 | 1,383 | 1,474 | 1,526 | 1,586 | 1,594 | ||||
| Fianna Fáil | John Stafford* | 6.06 | 1,248 | 1,531 | 1,549 | 1,651 | 1,706 | 1,720 | 1,819 | |||
| Labour | Willie Hamilton | 5.32 | 1,092 | 1,114 | 1,137 | 1,157 | ||||||
| Progressive Democrats | Dennis McIntyre | 4.58 | 942 | 984 | 992 | |||||||
| Independent | Kevin O'Hare | 1.89 | 390 | 406 | ||||||||
| Electorate: 35,703 Valid: 20,588 (57.66%) Spoilt: 460 Quota: 3,432 Turnout: 21,048 (58.95%) | ||||||||||||
Crumlin-Kimmage
| Party | Candidate | FPv% | Count | |||||||||
|---|---|---|---|---|---|---|---|---|---|---|---|---|
| 1 | 2 | 3 | 4 | 5 | 6 | 7 | 8 | 9 | ||||
| Labour | Eric Byrne* | 20.08 | 4,045 | |||||||||
| Sinn Féin | Robbie Sargent | 16.01 | 3,225 | 3,280 | 3,465 | |||||||
| Independent | Joan Collins | 13.78 | 2,777 | 2,863 | 3,046 | 3,079 | 3,251 | 3,389 | ||||
| Fianna Fáil | Charlie Ardagh* | 12.20 | 2,459 | 2,511 | 2,662 | 2,668 | 2,758 | 3,664 | ||||
| Fine Gael | Anne Marie Martin* | 8.03 | 1,617 | 1,691 | 1,809 | 1,819 | 2,024 | 2,135 | 2,257 | 2,270 | 2,854 | |
| Fianna Fáil | David Gaynor* | 7.10 | 1,430 | 1,456 | 1,553 | 1,559 | 1,614 | |||||
| Fine Gael | Ruairi McGinley* | 7.01 | 1,413 | 1,457 | 1,525 | 1,531 | 1,680 | 1,761 | 1,861 | 1,865 | 2,182 | |
| Green | Kristina McElroy | 5.77 | 1,162 | 1,222 | 1,343 | 1,366 | 1,672 | 1,759 | 1,842 | 1,855 | ||
| Labour | Gearoid O Maoilmhichill | 4.51 | 909 | 1,161 | 1,258 | 1,280 | ||||||
| Progressive Democrats | Brian McElroy | 3.83 | 771 | 796 | ||||||||
| Workers' Party | Brendan Phelan | 1.69 | 341 | 353 | ||||||||
| Electorate: 38,646 Valid: 20,149 (52.14%) Spoilt: 563 Quota: 3,359 Turnout: 20,712 (53.59%) | ||||||||||||
Donaghmede
| Party | Candidate | FPv% | Count | |||||||||
|---|---|---|---|---|---|---|---|---|---|---|---|---|
| 1 | 2 | 3 | 4 | 5 | 6 | 7 | 8 | 9 | ||||
| Sinn Féin | Killian Forde | 17.15 | 3,509 | |||||||||
| Labour | Seán Kenny* | 16.84 | 3,445 | |||||||||
| Fianna Fáil | Tom Brabazon* | 12.79 | 2,616 | 2,746 | 2,754 | 2,756 | 3,142 | 3,220 | 4,032 | |||
| Labour | Anne Carter* | 9.21 | 1,884 | 1,975 | 1,998 | 2,015 | 2,080 | 2,463 | 2,541 | 2,615 | 2,901 | |
| Independent | Tom Brennan | 8.73 | 1,786 | 1,834 | 1,856 | 1,858 | 1,901 | 2,153 | 2,290 | 2,412 | 2,563 | |
| Fine Gael | Patrick Crimmins | 8.04 | 1,645 | 1,728 | 1,733 | 1,737 | 1,790 | 1,863 | 1,920 | 1,988 | ||
| Fine Gael | Niamh Cosgrave* | 7.88 | 1,612 | 1,721 | 1,728 | 1,732 | 1,781 | 1,934 | 2,014 | 2,108 | 3,162 | |
| Green | Donna Cooney | 5.51 | 1,127 | 1,192 | 1,217 | 1,220 | 1,275 | |||||
| Fianna Fáil | John Clare* | 4.73 | 967 | 1,090 | 1,094 | 1,096 | ||||||
| Progressive Democrats | Aidan Kennedy | 2.59 | 529 | |||||||||
| Fianna Fáil | Michael McPherson | 1.47 | 301 | |||||||||
| Electorate: 36,800 Valid: 20,459 (55.60%) Spoilt: 610 Quota: 3,410 Turnout: 21,069 (57.25%) | ||||||||||||
Finglas
| Party | Candidate | FPv% | Count | |||||||
|---|---|---|---|---|---|---|---|---|---|---|
| 1 | 2 | 3 | 4 | 5 | 6 | 7 | ||||
| Sinn Féin | Dessie Ellis* | 29.84 | 4,300 | |||||||
| Labour | Mary Murphy* | 13.78 | 1,985 | 2,082 | 2,196 | 2,309 | 2,617 | 2,899 | ||
| Fine Gael | Dr. Bill Tormey | 12.10 | 1,743 | 1,812 | 1,866 | 1,924 | 2,126 | 2,296 | 2,569 | |
| Fianna Fáil | Liam Kelly* | 11.60 | 1,672 | 1,729 | 1,760 | 1,779 | 1,952 | 2,025 | 2,962 | |
| Fianna Fáil | Conor Sludds* | 10.03 | 1,445 | 1,513 | 1,532 | 1,555 | 1,705 | 1,785 | ||
| Progressive Democrats | Paul McAuliffe | 7.16 | 1,031 | 1,090 | 1,143 | 1,185 | ||||
| Independent | John O'Neill | 5.86 | 845 | 978 | 1,066 | 1,209 | 1,314 | |||
| Green | Aiden Meagher | 3.35 | 483 | 515 | ||||||
| Workers' Party | Owen Martin | 3.18 | 458 | 560 | 596 | |||||
| Sinn Féin | Sandra Sludds | 3.10 | 446 | 1,247 | 1,295 | 1,388 | 1,479 | 1,812 | 2,008 | |
| Electorate: 27,146 Valid: 14,408 (53.08%) Spoilt: 367 Quota: 2,882 Turnout: 14,775 (54.43%) | ||||||||||
North Inner City
| Party | Candidate | FPv% | Count | ||||||||||||
|---|---|---|---|---|---|---|---|---|---|---|---|---|---|---|---|
| 1 | 2 | 3 | 4 | 5 | 6 | 7 | 8 | 9 | 10 | 11 | 12 | ||||
| Sinn Féin | Christy Burke* | 14.78 | 1,869 | 1,878 | 1,881 | 1,998 | 2,443 | ||||||||
| Labour | Emer Costello* | 14.49 | 1,832 | 1,838 | 1,848 | 1,910 | 1,945 | 2,002 | 2,211 | ||||||
| Labour | Aodhán Ó Ríordáin | 11.17 | 1,412 | 1,417 | 1,428 | 1,454 | 1,474 | 1,503 | 1,660 | 1,726 | 2,086 | 2,329 | |||
| Independent | Mick Rafferty | 8.68 | 1,097 | 1,105 | 1,137 | 1,211 | 1,233 | 1,300 | 1,332 | 1,339 | 1,461 | 1,787 | 1,888 | 2,050 | |
| Fianna Fáil | Margeurite Fitzpatrick | 8.13 | 1,028 | 1,029 | 1,046 | 1,085 | 1,101 | 1,120 | 1,175 | 1,181 | 1,218 | 1,265 | 1,275 | 1,468 | |
| Fianna Fáil | Tom Stafford* | 8.01 | 1,013 | 1,013 | 1,037 | 1,066 | 1,076 | 1,091 | 1,116 | 1,118 | 1,134 | 1,200 | 1,219 | 1,712 | |
| Fianna Fáil | Nial Ring | 7.86 | 994 | 996 | 1,010 | 1,037 | 1,038 | 1,046 | 1,092 | 1,093 | 1,117 | 1,163 | 1,189 | ||
| Independent | Joe Mooney | 5.60 | 708 | 721 | 730 | 792 | 801 | 830 | 850 | 854 | 943 | ||||
| Green | Phil Kearney | 5.23 | 661 | 662 | 677 | 712 | 722 | 751 | 810 | 827 | |||||
| Fine Gael | Valerie Ni Fhaolain | 4.84 | 612 | 612 | 630 | 648 | 653 | 661 | |||||||
| Sinn Féin | Ciaran MacAnnraoi | 4.63 | 585 | 586 | 592 | 623 | |||||||||
| Independent | Paul Kangley | 2.18 | 276 | 282 | 291 | ||||||||||
| Independent | Ernie Beggs | 2.17 | 274 | 281 | 296 | ||||||||||
| Christian Solidarity | Paul O'Loughlin | 1.69 | 214 | 217 | |||||||||||
| Independent | Michael Gallagher | 0.53 | 67 | ||||||||||||
| Electorate: 31,067 Valid: 12,642 (40.69%) Spoilt: 489 Quota: 2,108 Turnout: 13,131 (42.27%) | |||||||||||||||
Pembroke
| Party | Candidate | FPv% | Count | ||||||
|---|---|---|---|---|---|---|---|---|---|
| 1 | 2 | 3 | 4 | 5 | 6 | ||||
| Labour | Dermot Lacey* | 18.87 | 1,796 | 1,878 | 2,370 | 2,561 | |||
| Progressive Democrats | Wendy Hederman | 16.62 | 1,582 | 1,640 | 1,843 | 1,991 | 2,189 | 2,252 | |
| Fine Gael | Lucinda Creighton | 16.46 | 1,567 | 1,617 | 1,800 | 2,644 | |||
| Fianna Fáil | Chris Andrews* | 16.16 | 1,538 | 1,767 | 1,865 | 1,973 | 2,039 | 2,079 | |
| Fine Gael | Paddy McCartan | 13.21 | 1,257 | 1,285 | 1,379 | ||||
| Green | Claire Wheeler* | 11.82 | 1,125 | 1,260 | |||||
| Sinn Féin | Sinead Pembroke | 3.47 | 330 | ||||||
| Fianna Fáil | Michael Turley | 3.39 | 323 | ||||||
| Electorate: 18,914 Valid: 9,518 (50.32%) Spoilt: 177 Quota: 2,380 Turnout: 9,695 (36.31%) | |||||||||
Rathmines
| Party | Candidate | FPv% | Count | ||||||
|---|---|---|---|---|---|---|---|---|---|
| 1 | 2 | 3 | 4 | 5 | 6 | ||||
| Labour | Mary Freehill* | 15.94 | 1,757 | 1,835 | 1,930 | 1,984 | 2,141 | 2,284 | |
| Labour | Oisin Quinn | 13.38 | 1,475 | 1,497 | 1,575 | 1,700 | 1,784 | 2,003 | |
| Fianna Fáil | Michael Donnelly* | 12.60 | 1,389 | 1,405 | 1,468 | 1,896 | 1,971 | 2,280 | |
| Fine Gael | Brian Gillen | 12.28 | 1,354 | 1,361 | 1,383 | 1,438 | 2,027 | 2,342 | |
| Green | Ryan Meade* | 10.98 | 1,210 | 1,310 | 1,475 | 1,519 | 1,571 | 1,699 | |
| Progressive Democrats | Tony Williams | 9.25 | 1,020 | 1,028 | 1,050 | 1,171 | 1,267 | ||
| Fine Gael | Edie Wynne | 9.18 | 1,012 | 1,023 | 1,041 | 1,094 | |||
| Fianna Fáil | Jim O'Callaghan | 8.18 | 902 | 908 | 941 | ||||
| Sinn Féin | Eoin O Sé | 5.29 | 583 | 632 | |||||
| Socialist Workers | Terry Connolly | 1.95 | 215 | 183 | 189 | ||||
| Independent | Eoin Tierney | 0.97 | 107 | 73 | |||||
| Electorate: 24,594 Valid: 11,024 (44.82%) Spoilt: 228 Quota: 2,205 Turnout: 11,252 (45.75%) | |||||||||
South-East Inner City
| Party | Candidate | FPv% | Count | ||||||||||
|---|---|---|---|---|---|---|---|---|---|---|---|---|---|
| 1 | 2 | 3 | 4 | 5 | 6 | 7 | 8 | 9 | 10 | ||||
| Labour | Kevin Humphreys* | 24.86 | 1,980 | 1,987 | 2,001 | ||||||||
| Sinn Féin | Daithí Doolan | 24.11 | 1,921 | 1,928 | 1,972 | 2,032 | |||||||
| Fianna Fáil | Garry Keegan* | 14.35 | 1,143 | 1,145 | 1,161 | 1,172 | 1,175 | 1,193 | 1,275 | 1,327 | 1,704 | 1,878 | |
| Green | Pauline O'Shea | 8.35 | 665 | 675 | 692 | 728 | 737 | 876 | 931 | 979 | 1,025 | 1,294 | |
| Fianna Fáil | Pat Bunce | 6.63 | 528 | 531 | 536 | 557 | 564 | 583 | 634 | 663 | |||
| Fine Gael | John Barry | 5.10 | 406 | 408 | 410 | 411 | 414 | 423 | 456 | 686 | 749 | ||
| Fine Gael | Conor Delaney | 4.32 | 344 | 347 | 351 | 356 | 356 | 365 | 417 | ||||
| Progressive Democrats | John Kenny | 4.07 | 324 | 324 | 326 | 334 | 336 | 353 | |||||
| Socialist Workers | Shay Ryan | 3.00 | 239 | 249 | 265 | 305 | 318 | ||||||
| Workers' Party | Angie Murphy | 2.49 | 198 | 205 | 213 | ||||||||
| Independent | Linda Poole | 1.83 | 146 | 155 | |||||||||
| Independent | Noel Ivory | 0.90 | 72 | ||||||||||
| Electorate: 18,360 Valid: 7,966 (43.39%) Spoilt: 256 Quota: 1,992 Turnout: 8,222 (44.78%) | |||||||||||||
South-West Inner City
| Party | Candidate | FPv% | Count | ||||||
|---|---|---|---|---|---|---|---|---|---|
| 1 | 2 | 3 | 4 | 5 | 6 | ||||
| Fine Gael | Catherine Byrne* | 22.64 | 1,971 | 1,990 | 2,111 | 2,165 | 2,178 | ||
| Labour | John Gallagher* | 21.55 | 1,876 | 1,940 | 1,986 | 2,230 | |||
| Sinn Féin | Andrew O'Connell | 18.96 | 1,650 | 1,703 | 1,734 | 1,894 | 1,909 | 2,108 | |
| Green | Patricia Gardiner | 10.94 | 952 | 993 | 1,025 | 1,118 | 1,139 | 1,485 | |
| Fianna Fáil | Mary Mooney* | 9.12 | 794 | 804 | 1,102 | 1,124 | 1,128 | ||
| Fianna Fáil | Tom Brunkard | 6.65 | 579 | 584 | |||||
| Socialist Party | Diarmuid Naessens | 6.59 | 579 | 658 | 663 | ||||
| Socialist Workers | Brendan Donohoe | 3.54 | 308 | ||||||
| Electorate: 20,603 Valid: 8,704 (42.25%) Spoilt: 287 Quota: 2,177 Turnout: 8,991 (43.64%) | |||||||||
References
External links
This article is issued from Wikipedia. The text is licensed under Creative Commons - Attribution - Sharealike. Additional terms may apply for the media files.