2002 Nevada gubernatorial election
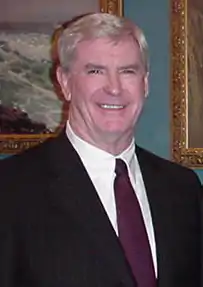
The 2002 Nevada gubernatorial election took place on November 5, 2002. Incumbent Republican Governor Kenny Guinn defeated Democratic nominee and Nevada Senator Joe Neal in a landslide to win a second term.
| Elections in Nevada |
|---|
 |
|
|
| |||||||||||||||||
| |||||||||||||||||
 County results Guinn: 60–70% 70–80% 80–90% | |||||||||||||||||
| |||||||||||||||||
As of 2022, this was the most recent Nevada gubernatorial election in which both major party candidates are now deceased.
Democratic primary
Candidates
- Joe Neal, Nevada Senator and candidate in 1998
- Barbara Scott, public accountant
- Dan Meyer
- Christopher J. Petrella, veteran
Results
| Party | Candidate | Votes | % | |
|---|---|---|---|---|
| Democratic | Joe Neal | 31,805 | 35.75 | |
| Democratic | None of These Candidates | 21,875 | 24.59 | |
| Democratic | Barbara Scott | 18,974 | 21.33 | |
| Democratic | Dan Meyer | 11,403 | 12.82 | |
| Democratic | Christopher J. Petrella | 4,917 | 5.53 | |
| Total votes | 88,974 | 100.00 | ||
Republican primary
Candidates
- Kenny Guinn, incumbent Governor of Nevada
- Shirley Cook, retired court reporter
- Bruce Westcott, businessman
- Bill Hiett, rancher
- Stan Lusak, retired janitor and postal employee
- James K. Prevot
- Carlo Poliak, perennial candidate
Results
| Party | Candidate | Votes | % | |
|---|---|---|---|---|
| Republican | Kenny Guinn (inc.) | 97,367 | 82.88 | |
| Republican | Shirley Cook | 7,717 | 6.57 | |
| Republican | None of These Candidates | 7,195 | 6.12 | |
| Republican | Bruce Westcott | 2,507 | 2.13 | |
| Republican | Bill Hiett | 1,167 | 0.99 | |
| Republican | Stan Lusak | 566 | 0.48 | |
| Republican | James K. Prevot | 560 | 0.48 | |
| Republican | Carlo Poliak | 395 | 0.34 | |
| Total votes | 117,474 | 100.00 | ||
General election
Predictions
| Source | Ranking | As of |
|---|---|---|
| The Cook Political Report[2] | Safe R | October 31, 2002 |
| Sabato's Crystal Ball[3] | Safe R | November 4, 2002 |
Polling
| Poll source | Date(s) administered |
Sample size[lower-alpha 1] |
Margin of error |
Kenny Guinn (R) |
Joe Neal (D) |
Other / Undecided |
|---|---|---|---|---|---|---|
| SurveyUSA | October 27–29, 2002 | 523 (LV) | ± 4.4% | 63% | 28% | 9% |
Results
| Party | Candidate | Votes | % | ±% | |
|---|---|---|---|---|---|
| Republican | Kenny Guinn (inc.) | 344,001 | 68.24% | +16.61% | |
| Democratic | Joe Neal | 110,935 | 22.01% | -20.03% | |
| None of These Candidates | None of These Candidates | 23,674 | 4.70% | +1.78% | |
| Libertarian | Dick Geyer | 8,104 | 1.61% | -0.08% | |
| Independent American | David G. Holmgren | 7,047 | 1.40% | -0.33% | |
| Independent | Jerry L. Norton | 5,543 | 1.10% | ||
| Green | Charles Laws | 4,775 | 0.95% | ||
| Majority | 233,066 | 46.24% | +36.64% | ||
| Turnout | 504,079 | ||||
| Republican hold | Swing | ||||
Notes
- Key:
A – all adults
RV – registered voters
LV – likely voters
V – unclear
References
- "Elections Results: Official 2002 Primary Election Results". Retrieved April 2, 2013.
- "Governor Updated October 31, 2002 | The Cook Political Report". The Cook Political Report. October 31, 2002. Archived from the original on December 8, 2002. Retrieved September 18, 2018.
- "Governors Races". www.centerforpolitics.org. November 4, 2002. Archived from the original on December 12, 2002. Retrieved September 18, 2018.
- "Elections Results: Official 2002 General Election Results". Retrieved April 2, 2013.
This article is issued from Wikipedia. The text is licensed under Creative Commons - Attribution - Sharealike. Additional terms may apply for the media files.

