Genetic history of East Asians
This article explains the genetic makeup and population history of East Asian peoples and their connection to genetically related populations (i.e. Southeast Asians, Siberians, Polynesians, and Native Americans), as well as Oceanians and partly, Central Asians and South Asians, which are collectively referred to as "East Eurasians" in population genomics.
Overview
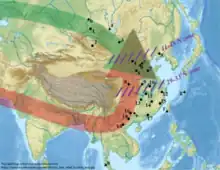


Population genomic studies have studied the origin and formation of modern East Asians. Ancestors of East Asians split from other human populations between 50,000 and 70,000 years ago. Possible routes into East Asia include a northern route model from Central Asia, beginning north of the Himalayas, and a southern route model, beginning south of the Himalayas and moving through Southeast Asia.[5]
The southern route model for East Asians has been corroborated in multiple recent studies, showing that most of the ancestry of Eastern Asians arrived from the southern route in to Southeast Asia at a very early period, perhaps 70,000 years ago.[6][7][8][9] However, the genetic evidence for northwestern East Asians and north Asians also supports more recent migrations along the northern route, taking place 18,000 years ago and since 3000 years ago, as shown by the presence of haplogroups Q and R.[10]
Sato et al. 2021 concluded that "the southern migration wave seems to have diversified into the local populations in East Asia (defined in this paper as a region including China, Japan, Korea, Mongolia, Taiwan and Southeast Asia), and the northern wave, which probably runs through the Siberian and Eurasian steppe regions and mixed with the southern wave, probably in Siberia."[11] The northern route in to East Asia was taken by the Ancient North Eurasians, who mixed with an Ancient Northeast Asian population. Modern day Native Americans carry substantial genetic ancestry from the Ancient North Eurasians, as do many modern West Eurasian populations (specifically Europeans; through Eastern Hunter-Gatherer admixture).[12][13]

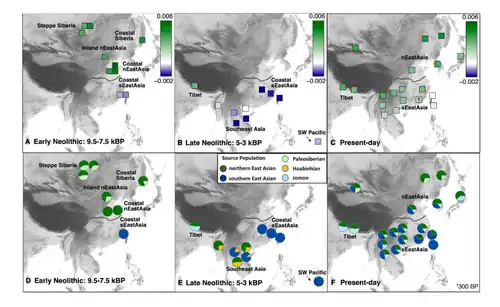
A review paper by Melinda A. Yang (in 2022) summarized and concluded that a distinctive "Basal-East Asian population" referred to as 'East- and Southeast Asian lineage' (ESEA); which is ancestral to modern East Asians, Southeast Asians, Polynesians, and Siberians, originated in Mainland Southeast Asia at ~50,000 BCE, and expanded through multiple migration waves southwards and northwards, respectively. This ESEA lineage is also ancestral to the Hoabinhian hunter-gatherers of Southeast Asia and the ~40,000-year-old Tianyuan lineage found in Northern China, but distinct from European-related and Australasian-related lineages of prehistoric Eurasia.[14] There are currently eight detected, closely related, sub-ancestries in the ESEA lineage:
- Amur ancestry – Associated with populations in the Amur River region, Mongolia, and Siberia, as well as parts of Central Asia.
- Fujian ancestry – Associated with ancient samples in the Fujian region of Southern China, and modern Austronesian-speaking populations.
- Guangxi ancestry – Associated with a 10,500-year-old individual from Longlin, Guangxi.
- Jōmon ancestry – Ancestry associated with 8,000–3,000-year-old individuals in the Japanese archipelago.
- Hòabìnhian ancestry – Ancestry on the ESEA lineage associated with 8,000–4,000-year-old hunter-gatherers in Laos and Malaysia.
- Tianyuan ancestry – Ancestry on the ESEA lineage associated with an Upper Paleolithic individual dating to 40,000 years ago in northern China.
- Ancient Tibetan ancestry – Associated with 3,000-year-old individuals in the Himalayan region of the Tibetan Plateau.
- Yellow River ancestry – Associated with populations in the Yellow River region and common among Sino-Tibetan-speakers.
Modern Northeast Asians consist mostly of the "Amur ancestry" which expanded massively with millet cultivation. Modern Southeast Asians (specifically Austronesians) consist mainly of the "Fujian ancestry" component, which is associated with the spread of rice cultivation. Contemporary East Asians (most notably Sino-Tibetan speakers) consist mostly of Yellow River ancestry, associated with both millet and rice cultivation. "East Asian Highlanders" (Tibetans) consist of both the Ancient Tibetan ancestry and Yellow River ancestry. Japanese people were found to have a tripartite origin; consisting of Jōmon ancestry, Amur ancestry, and Yellow River ancestry. Indigenous peoples of the Americas formed from Ancient North Eurasians and from an early East Asian branch, giving rise to "Ancestral Beringians", which gave rise to both "Paleosiberians" and contemporary Native Americans. Isolated hunter-gatherer in Southeast Asia, specifically Malaysia and Thailand, such as the Semang, derive most of their ancestry from the Hoabinhian lineage.[7][15][16][17][18][19][20][21][22]
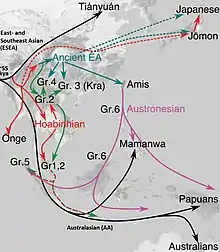
Phylogenetic data suggests that an early initial Eastern Eurasian or "eastern non-African" (ENA) meta-population trifurcated, and gave rise to Australasians (Oceanians), the Ancient Ancestral South Indians (AASI), as well as East/Southeast Asians, although Papuans may have also received some geneflow from an earlier group (xOoA),[23] around 2%,[24] next to additional archaic admixture in the Sahul region.
Xiongnu people (ancient)
The Xiongnu, possibly a Turkic, Mongolic, Yenisseian or multi-ethnic people, were a confederation[25] of nomadic peoples who, according to ancient Chinese sources, inhabited the eastern Eurasian Steppe from the 3rd century BC to the late 1st century AD. Chinese sources report that Modu Chanyu, the supreme leader after 209 BC, founded the Xiongnu Empire.[26]
According to data compiled from several genetic studies, Xiongnu samples were found to have approximately 58% East Eurasian ancestry, represented by a bronze-age population from Khövsgöl, Mongolia. The rest of the Xiongnu's ancestry (~40%) was related to West Eurasians, represented by the Gonur Depe BMAC population of Central Asia, and the Sintashta culture of the Western steppe.[27][28]
Paternal lineages
Over the past decade, Chinese archaeologists have published several reviews regarding the results of excavations in Xinjiang. They imply the genetic composition of Xiongnu's supreme ruling class. Particularly interesting are the tombs in the cemetery at Heigouliang, Xinjiang (the Black Gouliang cemetery, also known as the summer palace of the Xiongnu king), east of the Barkol basin, near the city of Hami.
By typing results of DNA samples during the excavation of one of the tombs, it was determined that of the 12 men: 6 Q1a* (not Q1a1-M120, not Q1a1b-M25, not Q1a2-M3), 4 Q1b-M378, 2 Q* (not Q1a, not Q1b: unable to determine subclades):[29]
In a paper (Lihongjie 2012), the author analyzed the Y-DNAs of the ancient male samples from the 2nd or 1st century BCE cemetery at Heigouliang in Xinjiang—which is also believed to be the site of a summer palace for Xiongnu kings—which is east of the Barkol basin and near the city of Hami. The Y-DNA of 12 men excavated from the site belonged to Q-MEH2 (Q1a) or Q-M378 (Q1b). The Q-M378 men among them were regarded as hosts of the tombs; half of the Q-MEH2 men appeared to be hosts and the other half as sacrificial victims.
Maternal lineages
In a study of Xiongnu remains belonging to the Egiin Gol necropolis in Northern Mongolia, a majority (89%) of their mitochondrial sequences can be classified as belonging to East Asian haplogroups, and nearly 11% belong to European haplogroups.[30]
Five female Xiongnu samples belonged to the maternal haplogroups D4b2b4, N9a2a, G3a3, D4a6 and D4b2b2b.[31]
Xianbei people (ancient)
The origins of the Xianbei are unclear. Chinese anthropologists Zhu Hong and Zhang Quanchao studied Xianbei crania from several sites in Inner Mongolia and noticed that anthropological features of studied Xianbei crania show that the racial type is closely related to the modern East-Asian Mongoloids, and some physical characteristics of those skulls are closer to modern Mongols, Manchu, Korean and Northern Han Chinese.[32]
Paternal lineages
A genetic study published in the American Journal of Physical Anthropology in August 2018 noted that the paternal haplogroup C2b1a1b has been detected among the Xianbei and the Rouran, and was probably an important lineage among the Donghu people.[33]
Maternal lineages
Genetic studies published in 2006 and 2015 revealed that the mitochondrial haplogroups of Xianbei remains were of East Asian origin. According to Zhou (2006) the maternal haplogroup frequencies of the Tuoba Xianbei were 43.75% haplogroup D, 31.25% haplogroup C, 12.5% haplogroup B, 6.25% haplogroup A and 6.25% "other." And the inner Mongolia of Tuoba Xianbei[34] According to Hong Zhu (2007) The maternal haplogroup frequencies of the Tuoba Xianbei in the Inner Mongolia Autonomous Region were 40.10% Haplogroup O (Y-haplo), 30.16% Haplogroup C (Y-haplo) and 27.94% "other".[35]
Zhou (2014) obtained mitochondrial DNA analysis from 17 Tuoba Xianbei, which indicated that these specimens were, similarly, completely East Asian in their maternal origins, belonging to haplogroups D, C, B, A, O and haplogroup G.[35][36]
The research also found a relation between Xianbei individuals with modern Oroqen, Ewenki and Outer Mongolian people. Especially Tungusic Oroqen show close relation to Xianbei.[37]
Genetic history of Manchus and Daurs
Paternal lineages
Haplogroup C3b2b1*-M401(xF5483)[38][39][40] has been identified as a possible marker of the Aisin Gioro and is found in ten different ethnic minorities in northern China, but completely absent from Han Chinese.[41][42][40]
Genetic testing also showed that the haplogroup C3b1a3a2-F8951 of the Aisin Gioro family came to southeastern Manchuria after migrating from their place of origin in the Amur river's middle reaches, originating from ancestors related to Daurs in the Transbaikal area. The Tungusic speaking peoples mostly have C3c-M48 as their subclade of C3 which drastically differs from the C3b1a3a2-F8951 haplogroup of the Aisin Gioro which originates from Mongolic speaking populations like the Daur. Jurchen (Manchus) are a Tungusic people. The Mongol Genghis Khan's haplogroup C3b1a3a1-F3796 (C3*-Star Cluster) is a fraternal "brother" branch of C3b1a3a2-F8951 haplogroup of the Aisin Gioro.[43]
A genetic test was conducted on seven men who claimed Aisin Gioro descent with three of them showing documented genealogical information of all their ancestors up to Nurhaci. Three of them turned out to share the C3b2b1*-M401(xF5483) haplogroup, out of them, two of them were the ones who provided their documented family trees. The other four tested were unrelated.[44] The Daur Ao clan carries the unique haplogroup subclade C2b1a3a2-F8951, the same haplogroup as Aisin Gioro and both Ao and Aisin Gioro only diverged merely a couple of centuries ago from a shared common ancestor. Other members of the Ao clan carry haplogroups like N1c-M178, C2a1b-F845, C2b1a3a1-F3796 and C2b1a2-M48. People from northeast China, the Daur Ao clan and Aisin Gioro clan are the main carriers of haplogroup C2b1a3a2-F8951. The Mongolic C2*-Star Cluster (C2b1a3a1-F3796) haplogroup is a fraternal branch to Aisin Gioro's C2b1a3a2-F8951 haplogroup.[45]
However, the modern Manchu people show relatively high amounts of Haplogroup O2, which is common among the Han Chinese. A study on the Manchu population of Liaoning reported that they have a close genetic relationship and significant admixture signal with northern Han Chinese. The Liaoning Manchu were formed from a major ancestral component related to Yellow River farmers and a minor ancestral component linked to ancient populations from the Amur River Basin, or others. The Manchu were therefore an exception to the coherent genetic structure of Tungusic-speaking populations, likely due to the large-scale population migrations and genetic admixtures in the past few hundred years.[46]
Genetic history of Japanese
Ancient Japanese
Jōmon people is the generic name of people who lived in the Japanese archipelago during the Jōmon period. Today most Japanese historians believe that the Jomon people were not one homogeneous people but were at least two or three distinct groups.[47]
Recent full genome analyses in 2020 by Boer et al. 2020 and Yang et al. 2020, reveal some further information regarding the origin of the Jōmon peoples. They were found to have largely formed from a Paleolithic Siberian population and an East Asian related population.[16][48]
These indigenous people had their own unique lifestyle and culture within Japan for thousands of years. The analyses found that the Jomon maintained a small effective population size of around 1,000 over several millennia, the Jōmon lineage split from modern East Asians between 15,000 BCE and 20,000 BCE, but after the divergence of Ancestral Native Americans about ~25,000 BCE, and became largely isolated from outside populations, but received gene flow from a population related to the Upper-Paleolithic Yana RHS sample from Northern Siberia, a deeply European-related population, also known as Ancient North Eurasians, and widespread in North Eurasia before the Last Glacial Maximum along a North to South cline. Niall Cooke, one of the researchers explained that these results strongly suggest a prolonged period of isolation from the rest of the continent until the introduction of new immigrants associated with wet-rice farming during the Yayoi period of Japanese history.[49]
The Yayoi people were migrants to the Japanese archipelago from Asia (Korea or China) during the Yayoi period (1000 BCE–300 CE) and Kofun period (250–538 CE). They are seen as direct ancestors of the modern Yamato people, the majority of Japanese and of the Ryukyuan people. It is estimated that modern Japanese share in average about 90% of their genome with the Yayoi.[50]
This group is thought to have marked the arrival of paddy field rice cultivation which led to an agricultural revolution in the archipelago until the following period.[49]
A study published in the journal Science Advances conducted by a team of Japanese and Irish researchers at Trinity College Dublin[51] found that the people of Japan bore genetic signatures from three ancient populations rather than just two as previously thought, with ancestry stemming from a third migration that occurred during the Kofun period.[52] The study found that up to 71% of the ancient Kofun people shared a common genetic strand with the Han Chinese while the rest shared with the Yayoi people and the Jōmon people.
In addition, The Nikkei published an article that showed the Kofun strand in modern day Japanese was concentrated in specific regions such as Kinki, Hokuriku and Shikoku.[53]
A recent study conducted in 2022 by the University of Vienna discovered that Ancient Japanese people were also present in the Korean Peninsula, specifically in the Gaya region (present day South Gyeongsang Province).[54] According to the study, genome samples of eight different individuals from the ancient Gaya kingdom were examined where six of them were closest to Modern Koreans, Modern Japanese, Kofun Japanese (the Kofun genomes are contemporaneous with individuals from the study) and Neolithic Koreans.[54] The remaining two bore closer resemblance to the Ancient Jōmon people,[54] suggesting that the Ancient Japanese existed outside of the Japanese islands than previously assumed.
A new study in 2022 conducted by the University of Xiamen shed light on the lack of Jōmon genomes found in present-day Koreans and Japanese.[55] Researchers discovered that despite finding evidence of the Jōmon people on the Korean peninsula and the Japanese archipelago, there were little to no traces left of their genetic impact in their respective people's gene pools.[55] According to the study, Ancient Koreans were composed of "northern East Asian-related ancestry and indigenous Jōmon-related ancestry" where the "northern East Asian ancestry was suggested to be related to the Neolithic West Liao River farmers in northeast China".[55] The finding indicated that the "West Liao River-related farmers might have spread the proto-Korean language as their ancestry was found to be predominant in extant Koreans" and these "Proto-Korean groups, in turn, introduced West Liao River-like ancestry into the gene pool of present-day Japan".[55] These people are thought to have caused the displacement of the indigenous Jōmon people causing a significant diminishment of Jōmon genomes in the regions. It was deduced that this event (and the populations remaining genetically homogeneous since then) was what caused modern Koreans and Japanese to share the majority of their genetic makeup[55] as the latter group "can be represented as a mixture of Koreans (91%) with a limited genetic heritage from a basal East Asian lineage related to Jōmon (9%)".[55][56]
Modern Japanese
Paternal lineages
The main paternal haplogroups of modern Yamato Japanese are Haplogroup D-M55 (today ~33%, with the frequency in various samples ranging from 18/70 = 25.7% in a sample from Tokushima Prefecture[57] to 24/59 = 40.7% in a sample of Japanese male volunteers[58] and 11/27 = 40.7% in a sample from Aomori Prefecture[59]), Haplogroup O-M176 (O1b2) (today ~32%, range 37/142 = 26.1% in a sample of Japanese[60] to 35/97 = 36.1% in a sample from Western Japan[61]), Haplogroup O-M122 (O2, formerly O3) (today ~20%, ranging from 4/59 = 6.8% in a sample of Japanese volunteers[58] and 11/102 = 10.8% in a sample of adults from Fukuoka[62] to 25/104 = 24.0% in a sample from Kyushu[63] and 38/157 = 24.2% in a pooled sample of Japanese from Tokushima, Yamaguchi, and Ibaraki[64]), Haplogroup C-M217 (C2, today ~6%, ranging from 0/26 = 0.0% in a sample from Aomori,[57] 1/61 = 1.6% in a sample from Shizuoka,[57] 1/47 = 2.1% in a sample from Kagawa,[65] and 3/137 = 2.2% in a sample from the Kantō region[61] to 15/206 = 7.3% in a sample from Sapporo,[62] 18/241 = 7.5% in a sample from Osaka,[62] 8/104 = 7.7% in a sample from Kyushu,[63] and 8/102 = 7.8% in a sample from Fukuoka[62]), and Haplogroup C-M8 (C1a1, today ~6%, ranging from 3/129 = 2.3% in a sample of male students of Saga Prefectural Chienkan High School[66] to 7/70 = 10.0% in a sample from Tokushima,[57] 6/49 = 12.2% in a sample of male students of Okinawa Prefectural Yaeyama High School and Okinawa Prefectural Yaeyama Commercial and Technical High School in Ishigaki, Okinawa,[66] and 6/36 = 16.7% in a sample of male students of Okinawa Prefectural Kaihō High School in Haebaru, Shimajiri District, Okinawa[66]).[59][61][62][67] Haplogroups N-M231, O-M119, O-K18, and Q-M242 also have been observed with low frequency among present-day Japanese.
A comprehensive study of worldwide Y-DNA diversity (Underhill et al. 2000) included a sample of 23 males from Japan, of whom eight (35%) belonged to haplogroup D-M174, six (26%) belonged to O-M175, five (22%) belonged to O-M122, three (13%) belonged to C-M8 and C-M130, and one (4.3%) belonged to N-M128.[68]
Among 259 males from Japan (70 from Tokushima, 61 from Shizuoka, 53 from Kyūshū, 45 from Okinawa, 26 from Aomori, and 4 Ainus) whose Y-DNA has been examined in a 2005 study by Michael F. Hammer, ninety (34.7%) belong to haplogroup D-M55, eighty-two (31.7%) belong to haplogroup O-P31 (including 22% O-47z, 7.7% O-M176(x47z), and 1.9% O-M95(xM111)), fifty-two (20.1%) belong to haplogroup O-M122, fourteen (5.4%) belong to haplogroup C-M8, ten (3.9%) belong to haplogroup NO-M214(xO-M175) (including 2.3% NO-M214(xO-M175, N-LLY22g), 1.2% haplogroup N-LLY22g(xM128, P43, M178), and 0.4% haplogroup N-M178), and eight (3.1%) belong to haplogroup C-M217 (including 1.9% haplogroup C-M217(xM86) and 1.2% haplogroup C-M86).[69]
The patrilines belonging to D-P37.1 were found in all the Japanese samples, but were more frequently found in Okinawa (55.6%) samples and less frequently found in the Tokushima (25.7%) and Kyūshū samples (26.4%).[69] Haplogroups O-M175 and C-M8 were not found in the small Ainu sample of four individuals, and C-M217 was not found in the Okinawa sample of 45 individuals.[69] Haplogroup N was detected in samples of Japanese from Aomori (2/26 N-LLY22g(xM128, P43, M178)), Shizuoka (1/61 N-LLY22g(xM128, P43, M178)), and Tokushima (1/70 N-M178), but was not found in the Kyūshū, Okinawa, or Ainu samples.[69] This study, and others, report that Y-chromosome patrilines crossed from the Asian mainland into the Japanese archipelago, and continue to make up a large proportion of the Japanese male lineage.[70] If focusing haplogroup O-P31 in those researches, the patrilines derived from its subclade O-SRY465 are frequently found in both Japanese (mean 32%,[71] with frequency in various samples ranging from 26%[72][73] to 36%[74]) and Koreans (mean 30%,[75] with frequency in various samples ranging from 19%[72][76] to 40%[74]). According to the research, these patrilines have undergone extensive genetic admixture with the Jōmon period populations previously established in Japan.[69]
A 2007 study by Nonaka et al. reported that among a total of 263 healthy unrelated Japanese male individuals born in 40 of the 47 prefectures of Japan, but especially Tokyo (n=51), Chiba (n=45), Kanagawa (n=14), Saitama (n=13), Shizuoka (n=12), and Nagano (n=11), the frequencies of the D2, O2b, and O3 lineages were 38.8%, 33.5%, and 16.7%, respectively, which constituted approximately 90% of the Japanese population. Haplogroup diversity for the binary polymorphisms was calculated to be 86.3%.[61]
Poznik et al. (2016) have reported that the males in the JPT (Japanese in Tokyo, Japan) sample[77] of the 1000 Genomes Project are 20/56 = 36% D2-M179, 18/56 = 32% O2b-M176, 10/56 = 18% O3-M122, 4/56 = 7.1% C1a1-M8, 2/56 = 3.6% O2a-K18, and 2/56 = 3.6% C2-M217.[78]
In a project approved by the Ethics Committee of Tokai University School of Medicine, Ochiai et al. (2016) have reported finding D-M174 (rs2032602 T>C) in 24/59 (40.7%), O-M268 (rs13447443 A>G) in 21/59 (35.6%), C-M130 (rs35284970 C>T) in 8/59 (13.6%), O-P198 (rs17269816 T>C) in 4/59 (6.8%), N-M231 (rs9341278 G>A) in 1/59 (1.7%), and O-P186(xM268, P198) (rs16981290 C>A, rs13447443 A, rs17269816 T) in 1/59 (1.7%) of a sample obtained through buccal swabs from Japanese male volunteers (n = 59) who had given informed consent to participate in the study.[58]
Maternal lineages
According to an analysis of the 1000 Genomes Project's sample of Japanese collected in the Tokyo metropolitan area, the mtDNA haplogroups found among modern Japanese include D (42/118 = 35.6%, including 39/118 = 33.1% D4 and 3/118 = 2.5% D5), B (16/118 = 13.6%, including 11/118 = 9.3% B4 and 5/118 = 4.2% B5), M7 (12/118 = 10.2%), G (12/118 = 10.2%), N9 (10/118 = 8.5%), F (9/118 = 7.6%), A (8/118 = 6.8%), Z (4/118 = 3.4%), M9 (3/118 = 2.5%), and M8 (2/118 = 1.7%).[79]
Single-nucleotide polymorphism
A 2011 SNP consortium study done by the Chinese Academy of Sciences and Max Planck Society consisting of 1719 DNA samples determined that Koreans and Japanese clustered near to each other, confirming the findings of an earlier study that Koreans and Japanese are related.[80]
A 2008 study about genome-wide SNPs of East Asians by Chao Tian et al. reported that Japanese along with other East Asians such as Joseon Koreans and Han Chinese are genetically distinguishable from Southeast Asians[81] Another study (2017) shows a relative strong relation between all East and Southeast Asians.[82]
Immunoglobulin G
.png.webp)
Hideo Matsumoto, professor emeritus at Osaka Medical College tested Gm types, genetic markers of immunoglobulin G, of Japanese populations for a 2009 study.[83] According to this study, the Gm ab3st gene is found at notably high frequencies across eastern Siberia, northern China, Korea, Mongolia, Japan, and Tibet.[83] The mean frequency of Gm ab3st for the mainstream Japanese population was found to be 26.0%, with a peak in the Yaeyama Islands (36.4% Yonaguni, 32.1% Ishigaki) among all populations in Japan and peaks in Akita (29.5%) and Shizunai (28.3%) among mainstream Japanese.[83] On mainland Asia, peak frequencies of Gm ab3st were found among Oroqen (44.0%) and Tungus (30.0%) in northeast China and among the north Baikal Buryats (30.7%); however, this gene is also frequent among Eskimos (25.4% Alaska, 24.7% Greenland, 20.5% Chaplin, Russia), Luoravetlans (Koryak 20.0%, Chukchi 15.3%), and Athabaskans (New Mexico Apache 19.7%, Alaska Athabascan 14.3%), and it is not uncommon even as far west as the south shore of the Caspian Sea (8.8% Gilani, 8.5% Mazanderani).[83] Minimum frequencies of Gm ab3st were found in Yakushima (22.0%) among all populations in Japan and in Tsu (23.3%) and Ōita (23.6%) among mainstream Japanese.[83] The data from small, isolated island populations, such as those of Yonaguni, Ishigaki, and Yakushima, were not used when calculating the mean for the mainstream Japanese population.[83] The study also considered Ainu and Korean populations and found Gm ab3st with a frequency of 25.2% among Ainu in Hidaka, Hokkaido and a mean frequency of 14.5% (range 13.1% Busan, South Korea to 18.6% Yanji, China) among Koreans.[83]
Gm afb1b3, on the other hand, is a southern marker gene possibly originating in southern China on the background of the fb1b3 gene (the modal Gm type among Caucasoids) and found at moderate to very high frequencies across southern China, Southeast Asia, Taiwan, Sri Lanka, Bangladesh, Nepal, Assam, and the Pacific Islands.[83] Professor Matsumoto has remarked that the center of dispersal of the Gm afb1b3 gene may be in the Yunnan and Guangxi area of southern China; extremely high frequencies of this gene have been observed in samples of mostly Daic peoples from this region (95.2% Shui in Sandu, Guizhou, 94.2% Zhuang in Guangxi, 91.4% Bouyei in Duyun,

Guizhou, 87.5% Miao in Guizhou, 84.0% Dai in Luxi, Yunnan) and from neighboring Laos (97.0% Laotian) and Thailand (89.9% Thai).[83] However, Gm afb1b3 is almost equally common among people in Malaysia (97.3% Kadazan on Borneo, 85.0% Malay), Indonesia (76.6% Sulawesi, 75.2% Java), the Philippines (83.6% Luzon Filipinos, 76.4% Luzon Negritos, 67.2% Mindanao Negritos), Karen people in Thailand (82.3%), Kacharis in Assam (80.9%), Cambodians (76.7%), Taiwanese aborigines (76.2%), Micronesians (88.7%), Melanesians (74.6%), and Polynesians (74.7% Cook Islands, 69.4% Hawaii).[83] The study found that the mean frequency of Gm afb1b3 was 10.6% (range 7.8% Shizunai to 13.0% Osaka) for the general Japanese population. Minimum frequencies (4.0% to 4.4%) of Gm afb1b3 were found among the native people in the Yaeyama and Miyako islands in the extreme south of Japan and among the Ainu (4.3%) in the extreme north of Japan. The author suggested that the somewhat elevated frequency of the Gm afb1b3 gene among the mainstream Japanese compared to the Sakishima islanders and the Ainu may have resulted from some admixture of the mainstream Japanese population at rates as low as 7–8% with southern Asian (from southern China or Southeast Asia as far west as India, Bangladesh and Nepal) populations having the Gm afb1b3 gene in high frequency.[83]
The other Gm types observed among Japanese are ag (45.8%) and axg (17.6%), which are not so useful for discerning human migrations and genetic relationships because they appear to be retained from a common ancestor of most modern humans and are found in similar proportions (with the frequency of ag being significantly greater than the frequency of axg) in many populations all over the world (aboriginal Australians and Americans, South Asians, Caucasoids, etc.).[83]
Craniometry

Ashley Montagu (1989) said that the "Mongoloid skull generally, whether Chinese or Japanese, has been rather more neotenized than the Caucasoid or European..."[85]
Ann Kumar (1998) said that Michael Pietrusewsky (1992) said that, in a craniometric study, the cranial bones of Southeast Asians (Borneo, Vietnam, Sulu, Java, and Sulawesi etc.) are closer to Japanese, in that order, than Mongolian and Chinese populations are close to Japanese. In the craniometric study, Michael Pietrusewsky (1992) said that, even though Japanese people cluster with Mongolians, Chinese and Southeast Asians in a larger Asian cluster, the cranial bones of Japanese people are more closely aligned with several mainland and island Southeast Asian samples than with Mongolians and Chinese. However, Pietrusewsky (1992) also said, more research is needed on the similarity of the cranial bones between Japanese and Southeast Asians.[86][87]
In a craniometric study, Pietrusewsky (1994) found that the Japanese series, which was a series that spanned from the Yayoi period to modern times, formed a single branch with Korea.[88] Later, Pietrusewsky (1999) found, however, that Korean and Yayoi people were very highly separated in the East Asian cluster, indicating that the connection that Japanese have with Korea would not have derived from Yayoi people.[88] However, in a follow-up study, Pietrusewsky (2010) corrected that East Asians and Southeast Asians were markedly separated from each other. He found that Koreans had the most similar cranial bones to ancient and modern Japanese including the Yayoi people and Jomon people, followed by Taiwan and Hainan.[84] He stated that a common origin of Northeast Asians could be traced and that they began entering the Japanese archipelago at the beginning of the Yayoi period.[84]
Genetic components compared with other Asian populations

A 2017 study conducted by Fumihiko Takeuchi, Tomohiro Katsuya, Ryosuke Kimura, and Norihiro Kato compared three genetically distinct Japanese groups, Hondu (Honshu), Ryukyu and Ainu to 26 other Asian populations to analyze the shared ancestry and genetic differentiation between the Japanese people and other Asians.[89] The study revealed for the Japanese as a whole, some genetic components from all of the Central, East, Southeast and South Asian populations are prevalent in the Japanese population with the major components of ancestry profile coming from the Korean and Han Chinese clusters.[89] The major components of the Japanese Hondo cluster are similar to the Korean (87–94%), followed by Han Chinese 1 (0–8%) clusters.[89] The genetic components from the Southeast Asian (Thais, Vietnamese and Malays) and South Asian (Sinhalese and Tamils) clusters were larger for the Ryukyu cluster—Southeast Asian (4–6%) and South Asian (4–6%)—in comparison to the results found in the Hondo cluster—Southeast Asian (0–1%) and South Asian (1–2%).[89]
An independent research conducted by director Kenichi Shinoda and his team at National Museum of Nature and Science in 2018 was broadcast on NHK Science ZERO and it also verified that genetically, the modern day Japanese are extremely close to the modern day Koreans.[90]
Genetic distance measurements from a large scale genetic study from 2021 titled 'Genomic insights into the formation of human populations in East Asia', Japanese are genetically closest to Koreans with 91% of their genetic makeup being derived from the group and the remaining from the Jōmon people.[56]
Ainu people

Recent research suggests that the historical Ainu culture originated from a merger of the Okhotsk culture with the Satsumon culture, cultures thought to have derived from the diverse Jōmon-period cultures of the Japanese archipelago.[92][93] According to Lee and Hasegawa of the Waseda University, the direct ancestors of the later Ainu people formed during the late Jōmon period from the combination of the local but diverse population of Hokkaido, long before the arrival of contemporary Japanese people. Lee and Hasegawa suggest that the Ainu language expanded from northern Hokkaido and may have originated from a relative more recent Northeast Asian/Okhotsk population, which established themselves in northern Hokkaido and had significant impact on the formation of Hokkaido's Jōmon culture.[94][95]
Recently in 2021, it was confirmed that the Hokkaido Jōmon people formed from "Jōmon tribes of Honshu" and from "Terminal Upper-Paleolithic people" (TUP people) indigenous to Hokkaido and Paleolithic Northern Eurasia. The Honshu Jōmon groups arrived about 15,000 BC and merged with the indigenous "TUP people" to form the Hokkaido Jōmon. The Ainu in turn formed from the Hokkaido Jōmon and from the Okhotsk people.[96]
Genetic history of Koreans
Studies of polymorphisms in the human Y-chromosome have so far produced evidence to suggest that the Korean people have a long history as a distinct, mostly endogamous ethnic group, with successive waves of people moving to the peninsula and three major Y-chromosome haplogroups.[97] The reference population for Koreans used in Geno 2.0 Next Generation is 94% Eastern Asia and 5% Southeast Asia & Oceania.[98]
Koreans are generally considered a Northeast Asian group. Koreans are overall more similar to northeast Asians than to southeast Asians. This conclusion would be expected from the general correlation between genetic variation and geography observed for human populations, and is supported here by an examination of individual mtDNA haplogroups, genetic distances between populations derived from mtDNA or Y-chromosomal data, and the apportionment of genetic diversity between different groups of populations.[100]
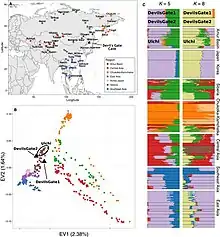
Studies of classical genetic markers showed that Koreans tend to have a close genetic affinity with Mongolians among East Asians. Ancient genome comparisons revealed that the genetic makeup of Koreans can be best described as an admixture of an Northern hunter-gatherer component as well as that of a influx of rice-farming agriculturalists from the Yangtze river valley, which in turn are often linked to O2-M122 and is largely male-biased.[100] Another study concludes however that O2b*-SRY465 and O2b1-47z had an in situ origin among Northeast Asians, particularly among the prehistoric Koreans, rather than in southern China or Southeast Asia as previously envisaged. The combination of the O2b initial settlement (which became an indigenous proto-Korean component) in part with the relatively recent O3 and C3 lineages (which include a Chinese component) explains some of the main events formulating the current Y chromosome composition of the Korean population.[64] This is supported by archeological, historical and linguistic evidence, which suggest that the direct ancestors of Koreans were proto-Koreans who inhabited the northeastern region of China and the Korean Peninsula during the Neolithic (8,000–1,000 BC) and Bronze (1,500–400 BC) Ages.[64] The results from the findings in the Devil's Gate showed that the ancient populations of the area were already admixed from various sources.[101]
Linguistically, Korean shows similarities to Ainu, Nivkh and most "Altaic" languages, while those with Japanese are explained through a more recent convergence starting from the Yayoi period.[102] Those groups correlate closely to modern-day Koreans and Japanese, who form a cluster in regional comparisons, along with various Tungusic groups, such as the Ulchi, Hezhen and Oroqen. Using modern Japanese as a indicator, who show a clear signal towards modern-day populations from Taiwan, southern China, and Vietnam, the southern component of Koreans could be established.[101] A high level of genetic continuity in the region over at least the last 7,700 years can be observed. Modern populations still rely on a number of hunter-gatherer-fisher practices and the cold climatic conditions likely provide an explanation for the apparent continuity and lack of major genetic turnover by exogenous farming populations, as has been documented in the case of southeast and central Europe.
One plausibility is that local hunter-gatherers progressively added food-producing practices to their original lifestyle.[101] East Asians, including Northern groups and Southern ones are closer related to another than other population groups and can trace themselves to a common ancestry from several tens of thousands of years ago.[103]
Paternal lineages
Jin Han-jun et al. (2003) said that the distribution of Y-chromosomal haplogroups shows that Koreans have a complex origin that results from genetic contributions from range expansions, most of which are from a southern-to-northern region in the continent, and genetic contributions from the northern Asian settlement.[72]
The most common Y-DNA haplogroup among present-day Koreans is Haplogroup O-M122 (O2, formerly O3), which is a very ancient (formed 33,943 [95% CI 37,631 <-> 25,124] years before present, TMRCA 30,365 [95% CI 33,956 <-> 22,492] years before present according to Karmin et al. 2022[104]) and frequently observed Y-DNA haplogroup among East and Southeast Asians in general.[105][106][107] Haplogroup O2-M122 has been found in approximately 41% of sampled Korean males, including 23/79 = 29.1% Korean Chinese,[74] 29/85 = 34.1% Korean (collected in Seoul by the Catholic University of Korea),[74] 16/45 = 35.6% Korean,[108] 109/300 = 36.3% unrelated Korean males obtained from the National Biobank of Korea,[109] 31/84 = 36.9% Gyeongsang,[64] 24/63 = 38.1% Gangwon,[64] 17/43 = 39.5% Korean (Korea),[65] 10/25 = 40.0% Korean (China),[65] 30/75 = 40.0% Korea,[57] 55/133 = 41.4% Daejeon,[110] 23/55 = 41.8% Korean from the KoVariome database,[111] 65/154 = 42.2% Korean,[112][113] 242/573 = 42.2% Seoul,[110] 39/90 = 43.3% Jeolla,[64] 38/87 = 43.7% Jeju,[64] 102/216 = 47.2% Seoul & Daejeon,[76] 36/72 = 50.0% Chungcheong,[64] 56/110 = 50.9% Seoul-Gyeonggi.[64]
The second most common Y-DNA haplogroup among present-day Koreans is Haplogroup O-M176 (O1b2, formerly O2b), a clade that probably has spread mainly from somewhere in the Korean Peninsula or its vicinity.[64][114] Haplogroup O1b2-M176 has been found in approximately 31% of sampled Korean males (including 31/154 = 20.1% Korean,[113] 58/216 = 26.9% Seoul & Daejeon,[76] 12/43 = 27.9% Koreans in Korea,[65] 7/25 = 28.0% Koreans in China,[65] 31/110 = 28.2% Seoul-Gyeonggi,[64] 25/84 = 29.8% Gyeongsang,[64] 22/72 = 30.6% Chungcheong,[64] 28/90 = 31.1% Jeolla,[64] 14/45 = 31.1% O-M175(xO1a-M119, O2a1-M95, O3-M122) Korean,[108] 181/573 = 31.6% Seoul,[110] 28/87 = 32.2% Jeju,[64] 28/85 = 32.9% Korean (collected in Seoul by the Catholic University of Korea),[74] 45/133 = 33.8% Daejeon,[110] 28/75 = 37.3% Korea,[57] 113/300 = 37.7% unrelated Korean males obtained from the National Biobank of Korea,[109] 25/63 = 39.7% Gangwon,[64] 38/79 = 48.1% Korean Chinese[74]).[65][69][72][76][115]
Korean males also exhibit a moderate frequency (approximately 15%) of Haplogroup C-M217. About 2% of Korean males belong to Haplogroup D-M174 (0/216 = 0.0% DE-YAP,[76] 3/300 = 1.0% DE-M145,[109] 1/68 = 1.5% DE-YAP(xE-SRY4064),[65] 8/506 = 1.6% D1b-M55,[64] 3/154 = 1.9% DE, 18/706 = 2.55% D-M174,[116] 5/164 = 3.0% D-M174,[74] 1/75 D1b*-P37.1(xD1b1-M116.1) + 2/75 D1b1a-M125(xD1b1a1-P42) = 3/75 = 4.0% D1b-P37.1,[69] 3/45 = 6.7% D-M174[117]). The D1b-M55 subclade has been found with maximal frequency in a small sample (n=16) of the Ainu people of Japan, and is generally frequent throughout the Japanese Archipelago.[63] Other haplogroups that have been found less commonly in samples of Korean males are Y-DNA haplogroup N-M231 (approx. 4%), haplogroup O-M119 (approx. 3%), haplogroup O-M268(xM176) (approx. 2%), haplogroup Q-M242 and Haplogroup R1 (approx. 2% total), J, Y*(xA, C, DE, J, K), L, C-RPS4Y(xM105, M38, M217), and C-M105.[64][65]
He Miao et al. (2009) created an artificial combination of equal parts of the Y-chromosomes of the HapMap samples of Han Chinese in Beijing and Japanese in Tokyo. The study said that this artificial combination resembled five populations which included Koreans in South Korea and Koreans in China.[118]
Maternal lineages
Studies of Korean mitochondrial DNA lineages have shown that there is a high frequency of Haplogroup D4, ranging from approximately 23% (11/48) among ethnic Koreans in Arun Banner, Inner Mongolia[119] to approximately 32% (33/103) among Koreans from South Korea.[73][120] Haplogroup D4 is the modal mtDNA haplogroup among northern East Asians (Japanese, Ryukyuans, Koreans, Manchus, Tuoba Xianbei, Oroqens, Manchurian Evenks, Daurs, Mongols, northern Han Chinese, Tibetans) in general, with a peak frequency among Japanese and Ryukyuans in Japan. Haplogroup B, which occurs very frequently in many populations of Southeast Asia, Polynesia, and the Americas, is found in approximately 10% (5/48 ethnic Koreans from Arun Banner, Inner Mongolia) to 20% (21/103 Koreans from South Korea) of Koreans.[119][120] Haplogroup A has been detected in approximately 7% (7/103 Koreans from South Korea) to 15% (7/48 ethnic Koreans from Arun Banner, Inner Mongolia) of Koreans.[73][119][120] Haplogroup A is the most common mtDNA haplogroup among the Chukchi, Eskimo, Na-Dene, and many Amerind ethnic groups of North and Central America.
The other half of the Korean mtDNA pool consists of an assortment of various haplogroups, each found with relatively low frequency, such as G, N9, Y, F, D5, M7, M8, M9, M10, M11, R11, C, and Z.
Hwan Young Lee et al. (2006) studied a sample of 694 Koreans and found the following mtDNA distribution: 32.56% (226/694) D (including 188/694 = 27.09% D4, 37/694 = 5.33% D5, and 1/694 = 0.14% D6a), 14.84% (103/694) B (including 23/694 = 3.31% B4a, 22/694 = 3.17% B4b, 20/694 = 2.88% B5b, 12/694 = 1.73% B4c, 12/694 = 1.73% B4*, 10/694 = 1.44% B5a, 2/694 = 0.29% B4d, and 2/694 = 0.29% B4f), 9.65% (67/694) G (including 27/694 = 3.89% G2a, 18/694 = 2.59% G1a, 11/694 = 1.59% G3, 9/694 = 1.30% G*, 1/694 = 0.14% G2c, and 1/694 = 0.14% G4), 8.79% (61/694) A (including 23/694 = 3.31% A5a, 3/694 = 0.43% A5b, 3/694 = 0.43% A5c, 25/694 = 3.60% A4, and 7/694 = 1.01% A(xA4, A5)), 8.36% (58/694) F, 8.21% (57/694) N9 (including 18/694 = 2.59% N9a2a, 11/694 = 1.59% N9a2*, 11/694 = 1.59% N9a1, 9/694 = 1.30% Y1b, 4/694 = 0.58% N9a*, 2/694 = 0.29% N9b, and 2/694 = 0.29% Y2), 7.78% (54/694) M7 (including 25/694 = 3.60% M7b, 20/694 = 2.88% M7c, and 9/694 = 1.30% M7a), 4.76% (33/694) M8'CZ (including 17/694 = 2.45% C, 7/694 = 1.01% M8a, 7/694 = 1.01% Z, and 2/694 = 0.29% pre-Z), 1.87% (13/694) M9, 1.73% (12/694) M10, 0.72% (5/694) M11, 0.29% (2/694) R11, 0.14% (1/694) R9b, 0.14% (1/694) M12, and 0.14% (1/694) M*.[121]
Derenko et al. (2007) examined a sample of 103 Koreans from South Korea and found that they belonged to the following mtDNA haplogroups: 39.8% D (including 32.0% D4 and 7.8% D5), 20.4% B (including 12.6% B4 and 7.8% B5), 9.7% M7, 6.8% A (including 3.9% A5 and 2.9% A4(xA2, A8)), 6.8% G (including 2.9% G2a, 1.9% G1, and 1.9% G3), 4.9% F1, 4.9% M8a2, 2.9% N9a, 1.9% M9a, 1.0% C(xC1, C4, C5), and 1.0% Y.[120]
A study of the mtDNA of 708 Koreans sampled from six regions of South Korea (134 from Seoul-Gyeonggi, 118 from Jeolla, 117 from Chungcheong, 114 from Gangwon, 113 from Jeju, and 112 from Gyeongsang) found that they belonged to haplogroup D (35.5%, including 14.7% D4(xD4a, D4b), 7.8% D4a, 6.5% D5, 6.4% D4b, and 0.14% D(xD4, D5)), haplogroup B (14.8%, including 11.0% B4 and 3.8% B5), haplogroup A (8.3%), haplogroup M7 (7.6%), haplogroup F (7.1%), haplogroup M8'CZ (6.5%), haplogroup G (6.1%), haplogroup N9a (5.2%), haplogroup Y (3.8%), haplogroup M9 (2.7%), haplogroup M10 (1.6%), haplogroup M11 (0.42%), haplogroup N(xN9, Y, A, F, B4, B5) (0.28%), and haplogroup N9(xN9a) (0.14%).[122]
A study of 1094 individuals in the Korean Genome Project found that they belonged to haplogroup D (34.19%), haplogroup B (13.89%), haplogroup M(xC, D, G, Z) (13.8%), haplogroup A (8.32%), haplogroup G (8.23%), haplogroup F (7.86%), haplogroup N(xA, B, F, R, Y) (5.76%), haplogroup C (3.02%), haplogroup R(xB, F) (2.01%), haplogroup Y (1.74%), and haplogroup Z (1.19%).[123] The individuals sampled for the Korean Genome Project are mostly from the Ulsan metropolitan region.[123]
Autosomal DNA
Jin Han-jun et al. (1999) said that based on genetic studies of classic genetic markers of protein and nuclear DNA, Koreans tend to be closely genetically related to Mongols among East Asians, which is supported by the following studies: Goedde et al. (1987); Saha & Tay (1992); Hong et al. (1993); and Nei & Roychoudhury (1993). The study said that the mtDNA 9‐bp deletion frequency in the intergenic COII/tRNALys region of Mongols (5.1%) is lower than that of Chinese (14.2%), Japanese (14.3%) and Koreans (15.5%). The study said that these 9‐bp deletion frequencies suggest that Koreans are closely related to Japanese and Chinese and that Koreans are not so closely related to Mongols. The study said that the homogeneity in the 9-bp deletion frequencies among Chinese (14.2%), Japanese (14.3%), and Koreans (15.5%), only spanning from a low of 14.2% for Chinese to a high of 15.5% for Koreans, indicates that very few mtDNA are differentiated in these three populations. The study said that the 9‐bp deletion frequencies for Vietnamese (23.2%) and Indonesians (25.0%), which are the two populations constituting Mongoloid Southeast Asians in the study, are relatively high frequencies when compared to the 9-bp deletion frequencies for Mongols(5.1%), Chinese (14.2%), Japanese (14.3%) and Koreans (15.5%), which are the four populations constituting Northeast Asians in the study. The study said that these 9-bp deletion frequencies are consistent with earlier surveys which showed that 9-bp deletion frequencies increase going from Japan to mainland Asia to the Malay Peninsula, which is supported by the following studies: Horai et al. (1987); Hertzberg et al. (1989); Stoneking & Wilson (1989); Horai (1991); Ballinger et al. (1992); Hanihara et al. (1992); and Chen et al. (1995). The study said that Cavalli-Sforza's chord genetic distance (4D), from Cavalli-Sforza & Bodmer (1971), which is based on the allele frequencies of the intergenic COII/tRNALys region, showed that Koreans are more genetically related to Japanese than Koreans are genetically related to the other East Asian populations which were surveyed. The Cavalli-Sforza's chord genetic distance (4D) between Koreans and other East Asian populations in the study, from least to greatest, are as follows: Korean to Japanese (0.0019), Korean to Chinese (0.0141), Korean to Vietnamese (0.0265), Korean to Indonesian (0.0316) and Korean to Mongols (0.0403). The study said that the close genetic affinity between present-day Koreans and Japanese is expected due to the Yayoi migration from China and the Korean Peninsula to Japan which began about 2,300 years ago, a migration that is supported by the following studies: Chard (1974); Hanihara (1991); Hammer & Horai (1995); Horai et al. (1996); Omoto & Saitou (1997). The study said that Horai et al. (1996) detected mtDNA D-loop variation which supports the idea that a large amount of maternal lineages came into Japan from immigrants from the Korean Peninsula after the Yayoi period.[124]
Wook et al. (2000) said that Chu et al. (1998) found that phylogeny which was based on 30 microsatellites indicated that Korean people were closely related to Chinese people from Manchuria and Yunnan, but Kim Wook et al. (2000) found that the high incidence of the DXYS156Y-null variant in northeast Chinese implied that it is possible to exclude these northeastern Chinese populations from being sources which are significant in Korean people. The phylogenetic analysis done by Wook et al. (2000) indicated that Japanese people are genetically closer to Korean people than Japanese people are genetically related to any of the following peoples: Mongolians, Chinese, Vietnamese, Indonesians, Filipinos, and Thais. The study said that mainland Japanese having Koreans as their closest genetic population is consistent with the following previous studies: Hammer and Horai (1995); Horai et al. (1996); and Kim et al. (1998). The study found that Koreans are more genetically homogenous than the Japanese, and the study said that this might be due to different sizes of the founding populations and range expansions. The study said that the moderate mean Y-chromosome haplotype diversity value for Koreans might be the result of migrations from East Asia that had a homogenizing influence.[125]
Kim Jong-jin et al. (2005) did a study about the genetic relationships among East Asians based on allele frequencies, particularly focusing on how close Chinese, Japanese and Koreans are genetically related to each other. Most Koreans were hard to distinguish from Japanese, and the study was not able to clearly distinguish Koreans and Japanese. Koreans and Japanese clustered together in the principal component analysis and the best least-squares tree. The study said that "[c]ommon ancestry and/or extensive gene flow" historically between Koreans and Japanese appears to be "likely" and results in a lot of difficulty finding population-specific alleles that could assist in differentiating Koreans and Japanese.[126]
Jung Jongsun et al. (2010) used the following Korean samples for a study: Southeast Korean (sample regions: Gyeongju, Goryeong and Ulsan), Middle West Korean (sample regions: Jecheon, Yeoncheon, Cheonan and Pyeongchang) and Southwest Korean (sample regions: Gimje, Naju and Jeju). Due to political reasons, the study said that it did not use North Korean samples, but the study said that the "historical migration event of Baekje from Goguryeo Empire (BC 37–AD 668) in Northern Korea imply that Northern lineages remain in South Korea." The study said that the "Northern people of the Goguryeo Empire" are closely related to Mongolians, and the study said that this group of people ruled most of Southwest Korea. The study said that "some of the royal families and their subjects in the Goguryeo Empire moved to this region and formed the Baekje Empire in BC 18–22." Southwest Koreans are closer to Mongolians in the study's genome map than the other two Korean regions in the study are close to Mongolians. Southwest Koreans also display genetic connections with the HapMap sample of Japanese in Tokyo, and, in the neighbor joining tree, the nodes for Southwest Korea is close to Japan. In the study's Korea-China-Japan genome map, some Southwest Korean samples overlap with samples from Japan. The study said that the fairly close relationship, in both the study's genetic structure analysis and genome map, of the Jeju Southwest Korean sample and the HapMap sample of Japanese in Tokyo, Japan, has made the evolutionary relationship of Chinese, Japanese and Koreans become clearer. Southeast Koreans display some genetic similarities with people of Kobe, Japan, which indicates that there might have been links between these regions. The study said that it is possible that outliers in the Gyeongju sample, one of the sampled Southeast Korean regions, and outliers in the Kobe, Japan, sample both have Siberian lineage due to Southeast Koreans having connections with Siberian lineages with respect to grave patterns and culture. The overall result for the study's Korea-Japan-China genome map indicates that some signals for Siberia remain in Southeast Korea. In contrast to the Gyeongju sample, the Goryeong and Ulsan samples, which are both Southeast Korean samples, displayed average signals for the Korean Peninsula. The study said that Middle West Korea was a melting pot in the Korean Peninsula with people traveling from North to South, South to North, and people traveling from East China, including from the Shandong Peninsula. Western Chinese, which included those in the Shandong Peninsula, travelled across the Yellow Sea, and these Western Chinese lived and traded in both China and Korea. In the study's genome map, Middle West Koreans are close to the HapMap sample of Han Chinese in Beijing and, in the neighbor joining tree, the nodes for Middle West Korea is close to China. The overall result for the study's Korea-Japan-China genome map indicates that Middle West Korea displays an average signal for South Korea. Chinese people are located between Korean and Vietnamese people in the study's genome map.[127][128]
Kim Young-jin and Jin Han-jun (2013) said that principal component analysis had Korean HapMap samples clustering with neighboring East Asian populations which were geographically nearby them such as the Chinese and Japanese. The study said that Koreans are genetically closely related to Japanese in comparison to Koreans' genetic relatedness to other East Asians which included the following East and Southeast Asian peoples: Tujia, Miao, Daur, She, Mongols, Naxi, Cambodians, Oroqen, Yakuts, Yi, Southern Han Chinese, Northern Han Chinese, Hezhen, Xibo, Lahu, Dai and Tu. The study said that the close genetic relatedness of Koreans to Japanese has been reported in the following previous studies: Kivisild et al. (2002); Jin et al. (2003); Jin et al. (2009); and Underhill and Kivisild (2007). The study said that Jung et al. (2010) said that there is a genetic substructure in Koreans, but the study said that it found Korean HapMap individuals to be highly genetically similar. The study said that Jin et al. (2009) found that Koreans from different populations are not different in a significant way which indicates that Koreans are genetically homogenous. The study said that the affinity of Koreans is predominately Southeast Asian with an estimated admixture of 79% Southeast Asian and 21% Northeast Asian Koreans, but the study said that this does not mean that Koreans are heterogenous, because all of the Koreans which were analyzed uniformly displayed a dual pattern of Northeast Asian and Southeast Asian origins. The study said that Koreans and Japanese displayed no observable difference between each other in their proportion of Southeast Asian and Northeast Asian admixture. The study said the 79% Southeast Asian and 21% Northeast Asian admixture estimate for Koreans is consistent with the interpretation of Jin et al. (2009) that Koreans descend from a Northeast Asian population which was subsequently followed by a male-centric migration from the southern region of Asia which changed both the autosomal composition and Y-chromosomes in the Korean population.
Veronika Siska et al. (2017) said that the Ulchi people are genetically closest in the study's panel to the human remains from the Devil's Gate Cave which are dated to about 7,700 years ago. Modern Korean and Japanese, the Oroqen people and the Hezhen people display a high affinity to the human remains from Devil's Gate Cave. Considering the geographic distance of Amerindians from Devil's Gate Cave, Amerindians are unusually genetically close to the human remains from Devil's Gate Cave. Korean genomes display similar traits to Japanese genomes on genome-wide SNP data. In an admixture analysis, when the genes of Devil's Gate are made into a unique genetic component, this new Devil's Gate genetic component is highest in peoples of the Amur Basin, including Ulchi, and makes up more than 50% of Koreans and Japanese. It also has a sporadic distribution among other East Asians, Central Asians and Southeast Asians.[129]
Immunoglobulin G
Hideo Matsumoto, professor emeritus at Osaka Medical College, tested Gm types, genetic markers of immunoglobulin G, of Korean populations for a 2009 study. The Korean populations were populations in Jeju Island, Busan, Gwangju, Kongsan, Jeonju, Wonju, the Kannung of South Korea and a Korean population in Yanji. Matsumoto said that the Gm ab3st gene is a marker for northern Mongoloid possibly originating in Siberia and found at high frequencies across northeast Asia and Tibet. Matsumoto said that the average frequency of Gm ab3st for Koreans was 14.5% which was intermediate between an average frequency of 26% for general Japanese and a frequency of 11.7% which was for a Han Chinese population in Beijing. Matsumoto said that Gm afb1b3 is a southern marker gene possibly originating in southern China and found at moderate to high frequencies across Southeast Asia, southern China, Taiwan, Sri Lanka, Bangladesh, Nepal, India, and parts of the Pacific. However, given the result that the Okinawans being genetically most northern among the Japanese with the highest frequency of the Gm ab3st gene which is assigned to be northern, the term northern and southern used in his study is controversial. Matsumoto said that the average frequency of Gm afb1b3 for Koreans was 14.7% which was intermediate between a frequency of 10.6% for general Japanese and a frequency of 24.1% for Beijing Han Chinese. Matsumoto said that Koreans displayed the northern Mongoloid pattern, but Matsumoto said that Koreans displayed a higher frequency of the southern marker gene, Gm afb1b3, than the Japanese. Matsumoto said that "Japanese and Korean populations were originally identical or extremely close to each other", and Matsumoto said, "It seemed to be during the formation of the contemporary Korean population that such a Gm pattern intermediate between Japanese and the northern Han in China emerged." Matsumoto said that the different Gm patterns between Japanese and Koreans most likely came about from frequent inflows of Chinese and/or northern populations into the Korean Peninsula.[130]
Genetic history of Mongolic peoples
The Mongols are an ethnic group in northern China, Mongolia, parts of Siberia and Western Asia. They are believed to be the descendants of the Xianbei and the proto-Mongols. The former term includes the Mongols proper (also known as the Khalkha Mongols), Oirats, the Kalmyk people and the Southern Mongols. The latter comprises the Abaga Mongols, Abaganar, Aohans, Baarins, Gorlos Mongols, Jalaids, Jaruud, Khishigten, Khuuchid, Muumyangan and Onnigud. The Daur people are descendants of the para-Mongolic Khitan people.[131] Mongolians are also related to the Manchurians.
Paternal lineages
The majority of Mongols in Mongolia and Russia belong to Y-DNA haplogroup C-M217. Haplogroup C-M217 among the Mongols is characterized by a diversity that dates back to the very origin of haplogroup C-M217 (TMRCA 33,900 [95% CI 31,300 <-> 36,500] ybp[132]) and very shallow diversity in each of the frequently observed subclades: C-M504 (TMRCA 2,900 [95% CI 2,200 <-> 3,700] ybp), C-M86 (TMRCA 3,700 [95% CI 3,000 <-> 4,500] ybp[132]), C-M407 (TMRCA 4,400 [95% CI 3,500 <-> 5,200] ybp[132]), and C-F1756 (TMRCA 5,000 [95% CI 4,200 <-> 5,800] ybp[132]). Of these four subclades, C-M407 is phylogenetically extremely divergent from the others, and is more closely related to subclades of C-M217 that are found among present-day Chinese, Koreans, Japanese, and other East and Southeast Asians; however, among Mongols, C-M407 is found most frequently toward the north (among Barghuts[133] and Buryats[134] as well as the neighboring Khamnigans and Soyots[135]) and toward the west (among Dorbet Kalmyks[136][137]).
Haplogroup O-M175 and Haplogroup N-M231 are found at medium rates among present-day Mongols. The subclades of Haplogroup O-M175 that have been observed among Mongols tend to be similar to those found among Han Chinese; in fact, a plurality of Mongols in China have been found to belong to haplogroup O2a-M324 (including O2a1a1a1b-F854, O2a1c-IMS-JST002611, O2a2a1a-CTS445, O2a2b1a1-M117, O2a2b1a2-F114, and O2a2b2a2-AM01845/F706), just like the Han Chinese majority in China.[138] The subclades of Haplogroup N-M231 that have been observed among Mongols in Mongolia and Russia tend to be similar to those found among Nenets, Nganasans, Khakasses, and Tuvans (N-B478) on the one hand or those found among Chukchi, Koryaks, and Asian Eskimos on the other (N-B197).[139] However, N-M2118, a subclade which is most often noted for its extremely high frequency among present-day populations of Yakutia, has been observed in 21.4% (6/28) of a sample of Kalmyk Khoshut,[137] and N-B525 is also widely observed among Mongols with low frequency. Furthermore, among Mongols in China, typically Chinese subclades of haplogroup N, such as N1a2a1a-F798/FGC10800/Y8493 and N1b-F2930/M1881/V3743, have been found more often than the aforementioned typically North Asian subclades of haplogroup N.[138] In addition, some members of a wide variety of other Y-DNA haplogroups have been found among present-day Mongols, including Haplogroup Q-M242, Haplogroup R-M207 (Haplogroup R1b-M478, Haplogroup R1b-M269, Haplogroup R1a-M17, Haplogroup R2a-M124), Haplogroup D-M174, Haplogroup J2a-M410, Haplogroup J1-Page8, Haplogroup E1b1b1a1b2-V22, Haplogroup G1-M285, Haplogroup G2a2b2a1a1a2a1a-L654.2, Haplogroup I2a2-M436, and Haplogroup I2a1b2a1a1a1-BY128/Y5596.[140]
Maternal lineages
The maternal haplogroups are diverse but similar to other northern Asian populations, including Haplogroup D, Haplogroup C, Haplogroup B, and Haplogroup A, which are shared among indigenous American and Asian populations.[141]
Derenko et al. (2007) tested a sample of 47 Mongolians from Ulaanbaatar and found that they were 8/47 = 17.0% haplogroup C (including 4/47 = 8.5% C4, 3/47 = 6.4% C(xC1, C4, C5), and 1/47 = 2.1% C5), 7/47 = 14.9% haplogroup B (including 5/47 = 10.6% B4 and 2/47 = 4.3% B5), 6/47 = 12.8% haplogroup A(xA2, A5, A8), 5/47 = 10.6% haplogroup D4(xD2, D3), 5/47 = 10.6% haplogroup G (including 4/47 = 8.5% G2a and 1/47 = 2.1% G1), 4/47 = 8.5% haplogroup U (including 3/47 = 6.4% haplogroup U4 and 1/47 = 2.1% haplogroup K), 3/47 = 6.4% haplogroup F1, 2/47 = 4.3% haplogroup M8a2, 1/47 = 2.1% haplogroup M7, 1/47 = 2.1% haplogroup M9a, 1/47 = 2.1% haplogroup M10, 1/47 = 2.1% haplogroup Z, 1/47 = 2.1% haplogroup M*, 1/47 = 2.1% haplogroup N9a, and 1/47 = 2.1% haplogroup N1.[120]
Jin et al. (2009) tested another sample of 47 Mongolians from Ulaanbaatar and found that they were 10/47 = 21.3% haplogroup C, 8/47 = 17.0% haplogroup G (including 5/47 = 10.6% G2a, 2/47 = 4.3% G(xG1a, G2, G3), and 1/47 = 2.1% G3), 7/47 = 14.9% haplogroup F (including 3/47 = 6.4% F1a, 3/47 = 6.4% F1b, and 1/47 = 2.1% F2a), 6/47 = 12.8% haplogroup D4 (including 5/47 = 10.6% D4(xD4a, D4b) and 1/47 = 2.1% D4b), 4/47 = 8.5% haplogroup B (including 2/47 = 4.3% B4(xB4a, B4b, B4c), 1/47 = 2.1% B4a, and 1/47 = 2.1% B5b), 2/47 = 4.3% haplogroup A(xA5), 2/47 = 4.3% haplogroup M7 (including 1/47 = 2.1% M7b(xM7b1, M7b2) and 1/47 = 2.1% M7c(xM7c1)), 2/47 = 4.3% haplogroup N9a, 1/47 = 2.1% haplogroup M*, 1/47 = 2.1% haplogroup M8a, 1/47 = 2.1% haplogroup U5a, 1/47 = 2.1% haplogroup Y1, 1/47 = 2.1% haplogroup pre-Z, and 1/47 = 2.1% haplogroup Z.[113]
Bai et al. (2018) tested a sample of 35 Khalkha from Ulaanbaatar, Mongolia and found that they were 10/35 = 28.6% haplogroup M80'D, 6/35 = 17.1% haplogroup R11'B, 4/35 = 11.4% haplogroup C/Z, 4/35 = 11.4% haplogroup U/K, 2/35 = 5.7% haplogroup M12'G, 2/35 = 5.7% haplogroup R9'F, 2/35 = 5.7% haplogroup N9/Y, 2/35 = 5.7% haplogroup N/A, 1/35 = 2.9% haplogroup M7, 1/35 = 2.9% haplogroup M9, and 1/35 = 2.9% haplogroup R0'HV/H.[142]
West Eurasian mtDNA haplogroups Haplogroup HV, Haplogroup U, Haplogroup K, Haplogroup I, Haplogroup J, represents 14% in western Xingjang Mongolian, 10% in Mongolia, 8.4% in central Inner Mongolian samples, 2% in eastern Xin Barage Zuoqi County samples.[143] West Eurasian mtDNA haplogroups haplogroup U/K, haplogroup R0'HV/H represents 14.3% in Khalkha.
Genetic history of Han Chinese
A 2018 study calculated pairwise FST (a measure of genetic difference) based on genome-wide SNPs, among the Han Chinese (Northern Han from Beijing and Southern Han from Hunan, Jiangsu and Fujian provinces), Japanese and Korean populations sampled. It found that the smallest FST value was between Northern Han Chinese (Beijing) (CHB) and Southern Han (Hunan and Fujian etc.) Chinese (CHS) (FST[CHB-CHS] = 0.0014), while CHB and Korean (KOR) (FST[CHB-KOR] = 0.0026) and between KOR and Japanese (JPT) (FST[JPT-KOR] = 0.0033). Generally, pairwise FST between Han Chinese, Japanese and Korean (0.0026~ 0.0090) are greater than that within Han Chinese (0.0014). These results suggested Han Chinese, Japanese and Korean are different in terms of genetic make-up, and the differences among the three groups are much larger than that between northern and southern Han Chinese.[145] Nonetheless, there is also genetic diversity among the Southern Han Chinese. The genetic composition of the Han population in Fujian might not accurately represent that of the Han population in Guangdong.
Another study shows that the northern and southern Han Chinese are genetically close to each other and it finds that the genetic characteristics of present-day northern Han Chinese were already formed prior to three thousand years ago in the Central Plain area.[147]
A recent genetic study on the remains of people (~4,000 years BP) from the Mogou site in the Gansu-Qinghai (or Ganqing) region of China revealed more information on the genetic contributions of these ancient Di-Qiang people to the ancestors of the Northern Han. It was deduced that 3,300 to 3,800 years ago some Mogou people had merged into the ancestral Han population, resulting in the Mogou people being similar to some northern Han in sharing up to ~33% paternal (O3a) and ~70% maternal (D, A, F, M10) haplogroups. The mixture rate was possibly 13–18%.[148]
.jpg.webp)
The estimated contribution of northern Han to southern Han is substantial in both paternal and maternal lineages and a geographic cline exists for mtDNA. As a result, the northern Han are one of the primary contributors to the gene pool of the southern Han. However, it is noteworthy that the expansion process was not only dominated by males, as is shown by both contribution of the Y-chromosome and the mtDNA from northern Han to southern Han. Northern Han Chinese and Southern Han Chinese exhibit both Ancient Northern East Asian and Ancient Southern East Asian ancestries.[144] These genetic observations are in line with historical records of continuous and large migratory waves of northern China inhabitants escaping warfare and famine, to southern China. Aside from these large migratory waves, other smaller southward migrations occurred during almost all periods in the past two millennia.[106] A study by the Chinese Academy of Sciences into the gene frequency data of Han subpopulations and ethnic minorities in China, showed that Han subpopulations in different regions are also genetically quite close to the local ethnic minorities, meaning that in many cases, blood of ethnic minorities had mixed into Han, while at the same time, the blood of Han had also mixed into the local ethnic minorities.[149]
An extensive, genome-wide association study of the Han population in 2008, shows that geographic-genetic stratification from north to south has occurred and centrally placed populations act as the conduit for outlying ones.[150] Ultimately, with the exception in some ethnolinguistic branches of the Han Chinese, such as Pinghua, there is "coherent genetic structure" (homogeneity) in all Han Chinese.[151]
Paternal lineages
Y-chromosome haplogroup O2-M122 is a common DNA marker in Han Chinese, as it appeared in China in prehistoric times. It is found in more than 50% of Chinese males, with frequencies tending to be high toward the east of the country (30/101 = 29.7% Guangxi Pinghua Han,[151] 13/40 = 32.5% Guangdong Han,[57] 11/30 = 36.7% Lanzhou Han,[65] 26/60 = 43.3% Yunnan Han,[64] 251/565 = 44.4% Zhaotong Han,[152] 15/32 = 46.9% Yili Han,[65] 23/49 = 46.9% Lanzhou Han,[153][154] 32/65 = 49.2% South China Han,[155] 18/35 = 51.4% Meixian Han,[65] 22/42 = 52.4% Northern Han,[74] 43/82 = 52.4% Northern Han,[156] 18/34 = 52.9% Chengdu Han,[65] 154/280 = 55.0% Southern Han,[156] 27/49 = 55.1% Northern Han,[63] 73/129 = 56.6% North China Han,[155] 49/84 = 58.3% Taiwan Han,[57] 35/60 = 58.3% Taiwan Minnan,[157] 99/167 = 59.3% East China Han,[155] 33/55 = 60.0% Fujian Han,[157] 157/258 = 60.9% Taiwan Han,[157] 13/21 = 61.9% Taiwan Han,[63] 189/305 = 62.0% Zibo Han,[152] 23/35 = 65.7% Harbin Han,[65] 29/44 = 65.9% Northern Han,[57] 23/34 = 67.6% Taiwan Hakka,[157] 35/51 = 68.6% Beijing Han[64]).[158][159]
Other Y-DNA haplogroups that have been found with notable frequency in samples of Han Chinese include O-P203 (15/165 = 9.1%, 47/361 = 13.0%), C-M217 (10/168 = 6.0%, 27/361 = 7.5%, 187/1730 = 10.8%, 20/166 = 12.0%), N-M231 (6/166 = 3.6%, 18/361 = 5.0%, 117/1729 = 6.8%, 17/165 = 10.3%), O-M268(xM95, M176) (54/1147 = 4.7%,[160] 8/168 = 4.8%, 23/361 = 6.4%, 12/166 = 7.2%), and Q-M242 (2/168 = 1.2%, 49/1729 = 2.8%, 12/361 = 3.3%, 48/1147 = 4.2%[160]).
However, the mitochondrial DNA (mtDNA) of Han Chinese increases in diversity as one looks from northern to southern China, which suggests that male migrants from northern China married with women from local peoples after arriving in modern-day Guangdong, Shanghai, Nanjing, Fujian, and other regions of southern China.[106][161]
However, a new study in 2019, shows that mitochondrial DNA (mtDNA) doesn't increases in diversity from northern to southern China. Most of mtdna carried by southern Han chinese are also carried by northern Han chinese.[162]
Despite this, tests comparing the genetic profiles of northern Han, southern Han and southern natives determined that haplogroups O1a-M119, O1b-PK4 and O2a-M188, which are prevalent in some southern natives and southeast Asian, were not only observed in southern Han (30% on average), but also observed in northern Han (10% on average).[163][164] Therefore, this proves that the male contribution of some southern natives in southern Han is obvious, assuming that the frequency distribution of Y lineages in southern natives represents some southern chinese regions before the expansion of Han culture that started two thousand years ago. Howerver, some southern natives, such Tujia and Yi, share similer distribution of Y lineages with southern Han.[165][106]
In contrast, there are consistent strong genetic similarities in the Y chromosome haplogroup distribution between the southern and northern Chinese population, and the result of principal component analysis indicates almost all Han populations form a tight cluster in their Y chromosome. However, other research has also shown that the paternal haplogroups O-M119[166] (especially its subclade O-P203/O-M307[165]), O-M7,[165] and O-M95[165][155] are found in both southern Han Chinese and South Chinese minorities, but more commonly in the latter. In fact, these paternal markers are in turn less frequent in northern Han Chinese.[167][168] According to Chinese genetic testing company 23mofang, the proportions of typically "Southern" Y-DNA haplogroups among all males in differen provinces of present-day China are as follows: 3%~25% O-M119[169] (10.27% O-M307,[170] 0.36% O-F1036,[171] 0.21% O-CTS5726,[172] 0.19% O-M110/O-F3288[173]), 2%~33% O-PK4 (6.25% O-M95,[174] 1.40% O-F838[175]), 3%~8% O-M188.[176]
Maternal lineages
The mitochondrial-DNA haplogroups of the Han Chinese can be classified into the northern East Asian-dominating haplogroups, including A, C, D, G, M8, M9, and Z, and the southern East Asian-dominating haplogroups, including B, F, M7, N*, and R.[106]
These haplogroups account for 52.7% and 33.85% of those in the Northern Han, respectively. Haplogroup D is the modal mtDNA haplogroup among northern East Asians. Among these haplogroups, D, B, F, and A were predominant in the Northern Han, with frequencies of 25.77%, 11.54%, 11.54%, and 8.08%, respectively.
However, in the Southern Han, the northern and southern East Asian-dominating mtDNA haplogroups accounted for 35.62% and 51.91%, respectively. The frequencies of haplogroups D, B, F, and A reached 15.68%, 20.85%, 16.29%, and 5.63%, respectively.[147][177][178][179][180]
Genetic history of Tibetans
Modern Tibetan populations are genetically most similar to other modern East Asian populations.[181] They also show more genetic affinity for modern Central Asian than modern Siberian populations.[181]
A 2016 study found that the Tibetan gene pool diverged from that of Han Chinese around 15,000 years ago, which can be largely attributed to post-LGM (Last Glacial Maximum) arrivals. Analysis of around 200 contemporary populations showed that Tibetans share ancestry with populations from East Asia (~82%), Central Asia and Siberia (~11%), South Asia (~6%), and western Eurasia and Oceania (~1%). These results support that Tibetans arose from a mixture of multiple ancestral gene pools but that their origins are much more complicated and ancient than previously suspected.[181]
Relationship to other populations
A study in 2010 suggested that the majority of the Tibetan gene pool may have diverged from the Zang around 15,000 years ago.[182] However, there are possibilities of much earlier human inhabitation of Tibet,[183][184] and these early residents may have contributed to the modern Tibetan gene pool.[185]
The date of divergence between Tibetans and Sherpas was estimated to have taken place around 11,000 to 7,000 years ago.[181]
Relationship to archaic hominins
After modern Oceanic populations, modern Tibetan populations show the highest rate of allele sharing with archaic hominins at over 6%.[181] Modern Tibetans show genetic affinities to three archaic populations: Denisovans, Neanderthals, and an unidentified archaic population.[181]
In comparison to modern Han populations, modern Tibetans show greater genetic affinity to Denisovans; however, both the Han and Tibetans have similar ratios of genetic affinity to general Neanderthal populations.[181]
Modern Tibetans were identified as the modern population that has the most alleles in common with Ust'-Ishim man.[181]
Paternal lineage
The distribution of Haplogroup D-M174 (subclade Haplogroup D-Z27276) is found among nearly all the populations of Central Asia and Northeast Asia south of the Russian border, although generally at a low frequency of 2% or less. A dramatic spike in the frequency of D-M174 occurs as one approaches the Tibetan Plateau. D-M174 is also found at high frequencies among Japanese people, but it fades into low frequencies in Korea and China proper between Japan and Tibet. The claim that the Navajo people and Tibetans are related, while discussed among linguists since Edward Sapir, has not found support in genetic studies. Some light has been shed on their origins, however, by one genetic study in which it was indicated that Tibetan Y-chromosomes had multiple origins, one from Central Asia and the other from East Asia.[186]
Genetic history of Turks
The Turkic peoples are a collection of ethno-linguistic groups of Central-, Eastern-, Northern- and Western-Asia as well as parts of Europe and North Africa. They speak related languages belonging to the Turkic language family.
Proposals for the homeland of the Turkic peoples and their language are far-ranging, from the Transcaspian steppe to Northeastern Asia (Manchuria).[187]
According to Yunusbayev, genetic evidence points to an origin in the region near South Siberia and Mongolia as the "Inner Asian Homeland" of the Turkic ethnicity.[188]

More recent genetic and archeologic studies suggest that the Turkic peoples were descended from a Transeurasian agricultural community based in northeast China, which is to be associated with the Xinglongwa culture and the succeeding Hongshan culture.[189] The East Asian agricultural origin of the Turkic peoples has been corroborated in multiple recent studies. Around 2,200 BC, due to the desertification of northeast China, the agricultural ancestors of the Turkic peoples probably migrated westwards into Mongolia, where they adopted a pastoral lifestyle.[190][191][192]
Linguistic and genetic evidence strongly suggests an early presence of Turkic peoples in eastern Mongolia.[193][194] Genetic studies have shown that the early Turkic peoples were of predominantly East Asian origins with medieval Turkic samples being more heterogeneous, and that Turkic culture and language was spread westwards through elite dominance.[192][195] The genetic evidence suggests that the Turkification of Central Asia was carried out by East Asian dominant minorities migrating out of Mongolia.[196]
Paternal lineages
Common Y-DNA haplogroups in Turkic peoples are Haplogroup N-M231 (found with especially high frequency among Turkic peoples living in present-day Russia), Haplogroup C-M217 (especially in Central Asia and, in particular, Kazakhstan), Haplogroup Q-M242 (especially in Southern Siberia and among Turkmens and the Qangly tribe of Kazakhs), and Haplogroup O-M175 (especially among Turkic peoples living in present-day China and the Naiman tribe of Kazakhs). Some groups also have Haplogroup R1b (notably frequent among the Teleuts and Kumandins of Southern Siberia, the Bashkirs of the Southern Ural region of Russia, and the Qypshaq tribe of Kazakhs), Haplogroup R1a (notably frequent among the Kyrgyz, Altaians, and several other Turkic peoples living in present-day Russia), Haplogroup J-M172 (especially frequent among Uyghurs, Azerbaijanis, and Turkish people), and Haplogroup D-M174 (especially among Yugurs, but also observed regularly with low frequency among Southern Altaians, Nogais, Kazakhs, and Uzbeks).[197][198]
Relationship to other Asia-Pacific and Native American populations
Central Asians

The genetic evidence suggests that the Turkification of Central Asia was carried out by East Asian dominant minorities migrating out of Mongolia.[199] According to a recent study, the Turkic Central Asian populations, such as Kyrgyz, Kazakhs, Uzbeks, and Turkmens share more of their gene pool with various East Asian and Siberian populations than with West Asian or European populations. The study further suggests that both migration and linguistic assimilation helped to spread the Turkic languages in Eurasia.[194]
North Asians and Native Americans
Genetic data suggests that Siberia was populated during the Terminal Upper-Paleolithic (36+-1,5ka) period from a distinct Paleolithic population migrating through Central Asia into Northern Siberia. This population is known as Ancient North Eurasians or Ancient North Siberians.
Between 30,000 and 25,000 years ago, the ancestors of both Paleo-Siberians and Native Americans originated from admixture between Ancient North Eurasians/Siberians and an Ancient East Asian lineage.[200][201] Ancestral Native Americans (or Ancient Beringians) later migrated towards the Beringian region, became isolated from other populations, and subsequently populated the Americas. Further geneflow from Northeast Asia resulted in the modern distribution of "Neo-Siberians" (associated with 'Altaic speakers') through the merger of Paleo-Siberians with Northeast Asians.[202][203][204]
Overall, while Northern Asians cluster closely to East Asians, they are shifted into a distinct position. "Analyses of all 122 populations confirm many known relationships and show that most populations from North Asia form a cluster distinct from all other groups. Refinement of analyses on smaller subsets of populations reinforces the distinctiveness of North Asia and shows that the North Asia cluster identifies a region that is ancestral to Native Americans."[205]
Native Americans
Multiple studies suggests that all Native Americans ultimately descended from a single founding population that initially diverged from" Ancestral Beringians" which shared a common origin with Paleo-Siberians from the merger of Ancient North Eurasians and a Basal-East Asian source population in Mainland Southeast Asia around 36,000 years ago, at the same time at which the proper Jōmon people split from Basal-East Asians, either together or during a separate expansion wave. The basal northern and southern Native American branches, to which all other Indigenous peoples belong, diverged around 16,000 years ago, although earlier dates were also proposed.[91][206] An indigenous American sample from 16,000 BCE in Idaho, which is craniometrically similar to modern Native Americans, was found to have been closely related to Paleosiberians, confirming that Ancestral Native Americans split from an ancient Siberian source population somewhere in northeastern Siberia. Genetic data on samples with alleged "Paleo-Indian" morphology turned out to be closely related to contemporary Native Americans, disproving a hypothetical earlier migration into the Americas. The scientists suggest that variation within Native American morphology is just that, the natural variation which have arisen during the formation of Ancestral Native Americans. Signals of a hypothetical "population Y", if not a false positive, are likely explained through a now extinct population from East Asia (eg. Tianyuan man, which contributed low amounts of ancestry to the Ancestral Native American gene pool in Asia, and perhaps also towards other Asian and Oceanian populations.[207][206][208][209][210]
South Asians
Genomic studies have described the genetic landscape of South Asia as a composite of West-Eurasian and East Asian exogenous components that mixed with the indigenous South Asian component termed Ancient Ancestral South Indians ("AASI")[211] .[212] The East Asian-related ancestry component forms the major ancestry among Tibeto-Burmese and Khasi-Aslian speakers in the Himalayan foothills and Northeast India,[213][214] and is generally distributed throughout South Asia at lower frequency, with substantial presence in Mundari-speaking groups,[213][214] as well as in some populations of northern, central and eastern South Asia.[213][214][215][216][217][218][219][220]
According to a genetic research (2015) including linguistic analyses, suggests an East Asian origin for proto-Austroasiatic groups, which first migrated to Southeast Asia and later into India.[221] According to Ness, there are three broad theories on the origins of the Austroasiatic speakers, namely northeastern India, central or southern China, or southeast Asia.[222] Multiple researches indicate that the Austroasiatic populations in India are derived from (mostly male dominated) migrations from Southeast Asia during the Holocene.[223][221][224][225][226][227] According to Van Driem (2007), "...the mitochondrial picture indicates that the Munda maternal lineage derives from the earliest human settlers on the Subcontinent, whilst the predominant Y chromosome haplogroup argues for a Southeast Asian paternal homeland for Austroasiatic language communities in India."[224]: 7
According to Chaubey et al. (2011), "Austroasiatic speakers in India today are derived from dispersal from Southeast Asia, followed by extensive sex-specific admixture with local Indian populations."[223] According to Zhang et al. (2015), Austroasiatic (male) migrations from southeast Asia into India took place after the lates Glacial maximum, circa 4,000 years ago.[221] According to Arunkumar et al. (2015), Y-chromosomal haplogroup O2a1-M95, which is typical for Austroasiatic speaking peoples, clearly decreases from Laos to east India, with "a serial decrease in expansion time from east to west," namely "5.7 ± 0.3 Kya in Laos, 5.2 ± 0.6 in Northeast India, and 4.3 ± 0.2 in East India." This suggests "a late Neolithic east to west spread of the lineage O2a1-M95 from Laos."[226][228] According to Riccio et al. (2011), the Munda people are likely descended from Austroasiatic migrants from southeast Asia.[225][229] According to Ness, the Khasi probably migrated into India in the first millennium BCE.[222]
According to Yelmen et al. 2019, the two main components of Indian genetic variation; the South Asian populations that "separated from East Asian and Andamanese populations" form one of the deepest splits among non-african groups compared to the West Eurasian component because of "40,000 years of independent evolution".[230]
Geneflow from Southeast Asians (particularly Austroasiatic groups) to South Asian peoples is associated with the introduction of rice-agriculture to South Asia. There is significant cultural, linguistic, and political Austroasiatic influence on early India, which can also be observed by the presence of Austroasiatic loanwords within Indo-Aryan languages.[231][232]
Southeast Asians
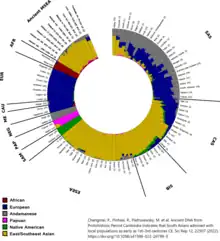
A 2020 genetic study about Southeast Asian populations, found that mostly all Southeast Asians are closely related to East Asians and have mostly "East Asian-related" ancestry.[18][234]
Ancient remains of hunter-gatherers in Maritime Southeast Asia, such as one Holocene hunter-gatherer from South Sulawesi, had ancestry from both, the South-Eurasian lineage (represented by Papuans and Aboriginal Australians), and the East-Eurasian lineage (represented by East Asians and or Andamanese Onge). The hunter-gatherer individual had approximately ~50% "Basal-East Asian" ancestry, and was positioned in between modern East Asians and Papuans of Oceania. The authors concluded that East Asian-related ancestry expanded from Mainland Southeast Asia into Maritime Southeast Asia much earlier than previously suggested, as early as 25,000 BCE, long before the expansion of Austroasiatic and Austronesian groups.[235]
A 2022 genetic study confirmed the close link between East Asians and Southeast Asians, which the authors term "East/Southeast Asian" (ESEA) populations, and also found a low but consistent proportion of South Asian-associated "SAS ancestry" (best samplified by modern Bengalis from Dhaka, Bangladesh) among specific Mainland Southeast Asian (MESA) ethnic groups (~2–16% as inferred by qpAdm), likely as a result of cultural diffision; mainly of South Asian merchants spreading Hinduism and Buddhism among the Indianized kingdoms of Southeast Asia. The authors however caution that Bengali samples harbor detechtable East Asian ancestry, which may affect the estimation of shared haplotypes. Overall, the geneflow event is estimated to have happened between 500–1000 YBP.[236]
Aboriginal Australians
Genetic studies have revealed that Aboriginal Australians largely descended from an Eastern Eurasian population wave, and are most closely related to other Oceanians, such as Melanesians such as Papuans and also show affinity to other Asian and Pacific populations, such as Negritos, Ancient Ancestral South Indians and East Asian peoples. Phylogenetic data suggests that an early initial eastern non-African lineage (ENA) or East-Eurasian meta-population trifurcated, and gave rise to Australasians (Oceanians), the Ancient Ancestral South Indians/Andamanese, and the East/Southeast Asian lineage including the ancestors of Native Americans.[211]
Melanesians
Phylogenetic data suggests that an early initial Eastern Eurasian (eastern non-African ENA) meta-population trifurcated, and gave rise to Australasians (Oceanians), the AASI, as well as East/Southeast Asians, although Papuans may have also received some geneflow from an earlier group (xOoA),[23][211] around 2%,[24] next to additional archaic admixture in the Sahul region. Vallini et al. 2022 study confirmed the position of Papuans, who belong to the broader Melanesian peoples of the Pacific Islands, as a sister lineage of East Asians: Papuan ancestry can be modelled either as an almost unadmixed sister lineage of East Asians (with potential minimal ingressions from basal Out-of-Africa populations) or as an approximately even mixture of East Asians and a basal East-Eurasian lineage that had split prior to the expansion of East-Eurasian ancestry into East Asia and Oceania.[23]
Notes
References
- Di, Da; Sanchez-Mazas, Alicia; Currat, Mathias (2015-11-04). "Computer simulation of human leukocyte antigen genes supports two main routes of colonization by human populations in East Asia". BMC Evolutionary Biology. 15 (1): 240. doi:10.1186/s12862-015-0512-0. ISSN 1471-2148. PMC 4632674. PMID 26530905.
- Wang CC, Li H (June 2013). "Inferring human history in East Asia from Y chromosomes". Investigative Genetics. 4 (1): 11. doi:10.1186/2041-2223-4-11. PMC 3687582. PMID 23731529.
- Metspalu M, Kivisild T, Metspalu E, Parik J, Hudjashov G, Kaldma K, et al. (August 2004). "Most of the extant mtDNA boundaries in south and southwest Asia were likely shaped during the initial settlement of Eurasia by anatomically modern humans". BMC Genetics. 5 (1): 26. doi:10.1186/1471-2156-5-26. PMC 516768. PMID 15339343.
- Hallast P, Agdzhoyan A, Balanovsky O, Xue Y, Tyler-Smith C (February 2021). "A Southeast Asian origin for present-day non-African human Y chromosomes". Human Genetics. 140 (2): 299–307. doi:10.1007/s00439-020-02204-9. PMC 7864842. PMID 32666166.
- Di D, Sanchez-Mazas A, Currat M (November 2015). "Computer simulation of human leukocyte antigen genes supports two main routes of colonization by human populations in East Asia". BMC Evolutionary Biology. 15 (1): 240. doi:10.1186/s12862-015-0512-0. PMC 4632674. PMID 26530905.
- Osada N, Kawai Y (2021). "Exploring models of human migration to the Japanese archipelago using genome-wide genetic data". Anthropological Science. 129 (1): 45–58. doi:10.1537/ase.201215. S2CID 234247309.
Via the southern route, ancestors of current Asian populations reached Southeast Asia and a part of Oceania around 70000–50000 years ago, probably through a coastal dispersal route (Bae et al., 2017). The oldest samples providing the genetic evidence of the northern migration route come from a high-coverage genome sequence of individuals excavated from the Yana RHS site in northeastern Siberia (Figure 2), which is about 31600 years old (Sikora et al., 2019). A wide range of artifacts, including bone crafts of wooly rhinoceros and mammoths, were excavated at the site (Pitulko et al., 2004). The analysis of genome sequences showed that the samples were deeply diverged from most present-day East Asians and more closely related to present-day Europeans, suggesting that the population reached the area through a route different from the southern route. A 24000-year-old individual excavated near Lake Baikal (Figure 2), also known as the Mal'ta boy, and 17000-year-old individuals from the Afontova Gora II site (Afontova Gora 2 and 3) showed similar genetic features to the Yana individuals (Raghavan et al., 2014; Fu et al., 2016; Sikora et al., 2019). Interestingly, genetic data suggested that Yana individuals received a large amount of gene flow from the East Asian lineage (Sikora et al., 2019; Yang et al., 2020).
- Gakuhari T, Nakagome S, Rasmussen S, Allentoft ME, Sato T, Korneliussen T, et al. (August 2020). "Ancient Jomon genome sequence analysis sheds light on migration patterns of early East Asian populations". Communications Biology. 3 (1): 437. doi:10.1038/s42003-020-01162-2. PMC 7447786. PMID 32843717.
Population genomic studies on present-day humans7,8 have exclusively supported the southern route origin of East Asian populations.
- Larena M, Sanchez-Quinto F, Sjödin P, McKenna J, Ebeo C, Reyes R, et al. (March 2021). "Multiple migrations to the Philippines during the last 50,000 years". Proceedings of the National Academy of Sciences of the United States of America. 118 (13): e2026132118. Bibcode:2021PNAS..11826132L. doi:10.1073/pnas.2026132118. PMC 8020671. PMID 33753512.
- Bae CJ, Douka K, Petraglia MD (December 2017). "On the origin of modern humans: Asian perspectives". Science. 358 (6368): eaai9067. doi:10.1126/science.aai9067. PMID 29217544. S2CID 4436271.
- Xu, Dan; Li, Hui (2017). Languages and Genes in Northwestern China and Adjacent Regions. Springer. p. 27. ISBN 978-981-10-4169-3. "In the study of Zhong et al. haplogroups O-M175, C-M130, D-M174 and N-M231 still suggests the substantial contribution of the southern route. However, the Central Asia and West Eurasia related haplogroups, such as haplogroups R-M207 and Q-M242, occur primarily in northwestern East Asia and their frequencies gradually decrease from west to east. In addition, the Y-STR diversities of haplogroups R-M207 and Q-M242 also indicate the existence of northern route migration about 18,000 years ago from Central Asia to North Asia, and recent population admixture along the Silk Road since about 3000 years ago (Piazza 1998)."
- Sato, Takehiro; Adachi, Noboru; Kimura, Ryosuke; Hosomichi, Kazuyoshi; Yoneda, Minoru; Oota, Hiroki; Tajima, Atsushi; Toyoda, Atsushi; Kanzawa-Kiriyama, Hideaki; Matsumae, Hiromi; Koganebuchi, Kae (2021-09-01). "Whole-Genome Sequencing of a 900-Year-Old Human Skeleton Supports Two Past Migration Events from the Russian Far East to Northern Japan". Genome Biology and Evolution. 13 (9): evab192. doi:10.1093/gbe/evab192. ISSN 1759-6653. PMC 8449830. PMID 34410389.
- Kozintsev, A. G. (2020). "The Origin of the Okunev Population, Southern Siberia: The Evidence of Physical Anthropology and Genetics". Archaeology, Ethnology & Anthropology of Eurasia. 48 (4): 135–145. doi:10.17746/1563-0110.2020.48.4.135-145. ISSN 1563-0110.
- Kozintsev 2020, p. 137-138: "The proportion of ANE in Native Americans amounts to 30–40 %." [...] "Likewise high (about 50%) is the proportion of ANE in Caucasoids, including the Yamnaya people, who inherited it from their ancestors—the so-called Eastern Hunter-Gatherers." [...] "As the geography and chronology of the ANE component show, it is misleading to describe it as Western Eurasian and associate it solely with ancient Caucasoids. To all appearances, it emerged before the Caucasoid-Mongoloid split. It was absent in Central and Western Europe before the Yamnaya expansion (Flegontov et al., 2016)."
- Yang, Melinda A. (2022-01-06). "A genetic history of migration, diversification, and admixture in Asia". Human Population Genetics and Genomics. 2 (1): 1–32. doi:10.47248/hpgg2202010001. ISSN 2770-5005.
...In contrast, mainland East and Southeast Asians and other Pacific islanders (e.g., Austronesian speakers) are closely related to each other [9,15,16] and here denoted as belonging to an East and Southeast Asian (ESEA) lineage (Box 2). …the ESEA lineage differentiated into at least three distinct ancestries: Tianyuan ancestry which can be found 40,000–33,000 years ago in northern East Asia, ancestry found today across present-day populations of East Asia, Southeast Asia, and Siberia, but whose origins are unknown, and Hòabìnhian ancestry found 8,000–4,000 years ago in Southeast Asia, but whose origins in the Upper Paleolithic are unknown.
- Wong EH, Khrunin A, Nichols L, Pushkarev D, Khokhrin D, Verbenko D, et al. (January 2017). "Reconstructing genetic history of Siberian and Northeastern European populations". Genome Research. 27 (1): 1–14. doi:10.1101/gr.202945.115. PMC 5204334. PMID 27965293.
- Yang MA, Fan X, Sun B, Chen C, Lang J, Ko YC, et al. (July 2020). "Ancient DNA indicates human population shifts and admixture in northern and southern China". Science. 369 (6501): 282–288. Bibcode:2020Sci...369..282Y. doi:10.1126/science.aba0909. PMID 32409524. S2CID 218649510.
- Mao X, Zhang H, Qiao S, Liu Y, Chang F, Xie P, et al. (June 2021). "The deep population history of northern East Asia from the Late Pleistocene to the Holocene". Cell. 184 (12): 3256–3266.e13. doi:10.1016/j.cell.2021.04.040. PMID 34048699. S2CID 235226413.
- Tagore D, Aghakhanian F, Naidu R, Phipps ME, Basu A (March 2021). "Insights into the demographic history of Asia from common ancestry and admixture in the genomic landscape of present-day Austroasiatic speakers". BMC Biology. 19 (1): 61. doi:10.1186/s12915-021-00981-x. PMC 8008685. PMID 33781248.
- "Direct genetic evidence of founding population reveals story of first Native Americans". University of Cambridge. 2018-01-03. Retrieved 2021-06-09.
- Liu D, Duong NT, Ton ND, Van Phong N, Pakendorf B, Van Hai N, Stoneking M (September 2020). "Extensive Ethnolinguistic Diversity in Vietnam Reflects Multiple Sources of Genetic Diversity". Molecular Biology and Evolution. 37 (9): 2503–2519. doi:10.1093/molbev/msaa099. PMC 7475039. PMID 32344428.
- Watanabe Y, Ohashi J (2021-03-08). "Comprehensive analysis of Japanese archipelago population history by detecting ancestry-marker polymorphisms without using ancient DNA data". bioRxiv 10.1101/2020.12.07.414037.
- de Boer E (2020). "Japan considered from the hypothesis of farmer/language spread". Evolutionary Human Sciences. 2: e13. doi:10.1017/ehs.2020.7. PMC 10427481. PMID 37588377. S2CID 218926428.
- Genetics and material culture support repeated expansions into Paleolithic Eurasia from a population hub out of Africa, Vallini et al. 2022 (April 4, 2022) Quote: "Taken together with a lower bound of the final settlement of Sahul at 37 ka (the date of the deepest population splits estimated by Malaspinas et al. 2016), it is reasonable to describe Papuans as either an almost even mixture between East Asians and a lineage basal to West and East Asians occurred sometimes between 45 and 38 ka, or as a sister lineage of East Asians with or without a minor basal OoA or xOoA contribution. We here chose to parsimoniously describe Papuans as a simple sister group of Tianyuan, cautioning that this may be just one out of six equifinal possibilities."
- "Almost all living people outside of Africa trace back to a single migration more than 50,000 years ago". science.org. Retrieved 2022-08-19.
- "Xiongnu People". britannica.com. Encyclopædia Britannica. Archived from the original on 11 March 2020. Retrieved 25 July 2015.
- di Cosmo 2004: 186
- Savelyev, Alexander; Jeong, Choongwon (2020). "Early nomads of the Eastern Steppe and their tentative connections in the West". Evolutionary Human Sciences. 2. doi:10.1017/ehs.2020.18. hdl:21.11116/0000-0007-772B-4. ISSN 2513-843X. PMC 7612788. PMID 35663512. S2CID 218935871.
- Savelyev & Jeong 2020:"Specifically, individuals from Iron Age steppe and Xiongnu have an ancestry related to present-day and ancient Iranian/Caucasus/Turan populations in addition to the ancestry components derived from the Late Bronze Age populations. We estimate that they derive between 5 and 25% of their ancestry from this new source, with 18% for Xiongnu (Table 2). We speculate that the introduction of this new western Eurasian ancestry may be linked to the Iranian elements in the Xiongnu linguistic material, while the Turkic-related component may be brought by their eastern Eurasian genetic substratum." Table 2: Sintashta_MLBA, 0.239; Khovsgol LBA, 0.582; Gonur1 BA 0.178
- Li Hongjie (2012). Y-Chromosome Genetic Diversity of the Ancient North Chinese populations (Report). China: Jilin University.
- Keyser-Tracqui C, Crubézy E, Ludes B (August 2003). "Nuclear and mitochondrial DNA analysis of a 2,000-year-old necropolis in the Egyin Gol Valley of Mongolia". American Journal of Human Genetics. 73 (2): 247–60. doi:10.1086/377005. PMC 1180365. PMID 12858290.
- Damgaard, Peter de Barros; Marchi, Nina; Rasmussen, Simon; Peyrot, Michaël; Renaud, Gabriel; Korneliussen, Thorfinn; Moreno-Mayar, J. Víctor; Pedersen, Mikkel Winther; Goldberg, Amy; Usmanova, Emma; Baimukhanov, Nurbol (May 2018). "137 ancient human genomes from across the Eurasian steppes". Nature. 557 (7705): 369–374. Bibcode:2018Natur.557..369D. doi:10.1038/s41586-018-0094-2. hdl:1887/3202709. ISSN 1476-4687. PMID 29743675. S2CID 13670282.
- "Anthropology of Archaeological Populations from East- and Central-Asia" (PDF). Archived from the original (PDF) on 2013-07-29.
- Li et al. 2018, p. 1.
- Changchun Y, Li X, Xiaolei Z, Hui Z, Hong Z (November 2006). "Genetic analysis on Tuoba Xianbei remains excavated from Qilang Mountain Cemetery in Qahar Right Wing Middle Banner of Inner Mongolia". FEBS Letters. 580 (26): 6242–6246. doi:10.1016/j.febslet.2006.10.030. PMID 17070809. S2CID 19492267.
- Wang H, Ge B, Mair VH, Cai D, Xie C, Zhang Q, et al. (November 2007). "Molecular genetic analysis of remains from Lamadong cemetery, Liaoning, China". American Journal of Physical Anthropology. 134 (3): 404–411. doi:10.1002/ajpa.20685. PMID 17632796.
- Zhou H (March 2014). "Genetic analyses of Xianbei populations about 1,500–1,800 years old". Human Genetics. 50 (3): 308–314. doi:10.1134/S1022795414030119. S2CID 18809679.
- Changchun Y, Li X, Xiaolei Z, Hui Z, Hong Z (November 2006). "Genetic analysis on Tuoba Xianbei remains excavated from Qilang Mountain Cemetery in Qahar Right Wing Middle Banner of Inner Mongolia". FEBS Letters. 580 (26): 6242–6. doi:10.1016/j.febslet.2006.10.030. PMID 17070809. S2CID 19492267.
- Wei LH, Yan S, Yu G, Huang YZ, Yao DL, Li SL, et al. (March 2017). "Genetic trail for the early migrations of Aisin Gioro, the imperial house of the Qing dynasty". Journal of Human Genetics. 62 (3): 407–411. doi:10.1038/jhg.2016.142. PMID 27853133. S2CID 7685248.
- Yan S, Tachibana H, Wei LH, Yu G, Wen SQ, Wang CC (June 2015). "Y chromosome of Aisin Gioro, the imperial house of the Qing dynasty". Journal of Human Genetics. 60 (6): 295–8. arXiv:1412.6274. doi:10.1038/jhg.2015.28. PMID 25833470. S2CID 7505563.
- "Did you know DNA was used to uncover the origin of the House of Aisin Gioro?". Did You Know DNA... 14 November 2016. Retrieved 5 November 2020.
- Xue Y, Zerjal T, Bao W, Zhu S, Lim SK, Shu Q, et al. (December 2005). "Recent spread of a Y-chromosomal lineage in northern China and Mongolia". American Journal of Human Genetics. 77 (6): 1112–6. doi:10.1086/498583. PMC 1285168. PMID 16380921.
- "Asian Ancestry based on Studies of Y-DNA Variation: Part 3. Recent demographics and ancestry of the male East Asians – Empires and Dynasties". Genebase Tutorials. Archived from the original on November 25, 2013.
- Wei LH, Yan S, Yu G, Huang YZ, Yao DL, Li SL, et al. (March 2017). "Genetic trail for the early migrations of Aisin Gioro, the imperial house of the Qing dynasty". Journal of Human Genetics. The Japan Society of Human Genetics. 62 (3): 407–411. doi:10.1038/jhg.2016.142. PMID 27853133. S2CID 7685248.
- Yan S, Tachibana H, Wei LH, Yu G, Wen SQ, Wang CC (June 2015). "Y chromosome of Aisin Gioro, the imperial house of the Qing dynasty". Journal of Human Genetics. Nature Publishing Group on behalf of the Japan Society of Human Genetics (Japan). 60 (6): 295–8. arXiv:1412.6274. doi:10.1038/jhg.2015.28. PMID 25833470. S2CID 7505563.
- Wang CZ, Wei LH, Wang LX, Wen SQ, Yu XE, Shi MS, Li H (August 2019). "Relating Clans Ao and Aisin Gioro from northeast China by whole Y-chromosome sequencing". Journal of Human Genetics. Japan Society of Human Genetics. 64 (8): 775–780. doi:10.1038/s10038-019-0622-4. PMID 31148597. S2CID 171094135.
- Zhang, Xianpeng; He, Guanglin; Li, Wenhui; Wang, Yunfeng; Li, Xin; Chen, Ying; Qu, Quanying; Wang, Ying; Xi, Huanjiu; Wang, Chuan-Chao; Wen, Youfeng (2021-09-30). "Genomic Insight Into the Population Admixture History of Tungusic-Speaking Manchu People in Northeast China". Frontiers in Genetics. 12: 754492. doi:10.3389/fgene.2021.754492. ISSN 1664-8021. PMC 8515022. PMID 34659368.
 This article incorporates text available under the CC BY 4.0 license.
 - Miura S, Shinoda K (2016-06-03). "The Origins of Japanese Culture Uncovered Using DNA ― What happens when we cut into the world of the Kojiki myths using the latest science". Discuss Japan-Japan Foreign Policy Forum. Archived from the original on 2019-01-21. Retrieved 2019-01-21.
- de Boer E, Yang MA, Kawagoe A, Barnes GL (2020). "Japan considered from the hypothesis of farmer/language spread". Evolutionary Human Sciences. 2: e13. doi:10.1017/ehs.2020.7. ISSN 2513-843X. PMC 10427481. PMID 37588377.
- Cooke, N. P.; Mattiangeli, V.; Cassidy, L. M.; Okazaki, K.; Stokes, C. A.; Onbe, S.; Hatakeyama, S.; Machida, K.; Kasai, K.; Tomioka, N.; Matsumoto, A.; Ito, M.; Kojima, Y.; Bradley, D. G.; Gakuhari, T.; Nakagome, S. (2021). "Ancient genomics reveals tripartite origins of Japanese populations". Science Advances. 7 (38): eabh2419. Bibcode:2021SciA....7.2419C. doi:10.1126/sciadv.abh2419. PMC 8448447. PMID 34533991.
- "'Jomon woman' helps solve Japan's genetic mystery | NHK WORLD-JAPAN News". NHK WORLD. Retrieved 2019-07-09.
- Trinity College Dublin (2021-09-17). "Ancient DNA rewrites early Japanese history—modern day populations have tripartite genetic origin". phys.org. Retrieved 2022-03-01.
- Cooke, Niall (17 September 2021). "Ancient genomics reveals tripartite origins of Japanese populations". Science Advances. 7 (38): 15. Bibcode:2021SciA....7.2419C. doi:10.1126/sciadv.abh2419. PMC 8448447. PMID 34533991.
- Nikkei Science (2021-06-23). "渡来人、四国に多かった? ゲノムが明かす日本人ルーツ" [Were there many migrants in Shikoku? Japanese roots revealed by genome analysis]. nikkei.com (in Japanese). Retrieved 2022-05-01.
- "1,700-year-old Korean genomes show genetic heterogeneity in Three Kingdoms period Gaya". ScienceDaily. Retrieved 2022-08-29.
- Wang, Rui; Wang, Chuan-Chao (2022-08-08). "Human genetics: The dual origin of Three Kingdoms period Koreans". Current Biology. 32 (15): R844–R847. doi:10.1016/j.cub.2022.06.044. ISSN 0960-9822. PMID 35944486. S2CID 251410856.
- Wang, Chuan-Chao (2021). "Genomic insights into the formation of human populations in East Asia". Nature. 591 (7850): 413–419. Bibcode:2021Natur.591..413W. doi:10.1038/s41586-021-03336-2. PMC 7993749. PMID 33618348.
- Hammer MF, Karafet TM, Park H, Omoto K, Harihara S, Stoneking M, Horai S (2006). "Dual origins of the Japanese: common ground for hunter-gatherer and farmer Y chromosomes". Journal of Human Genetics. 51 (1): 47–58. doi:10.1007/s10038-005-0322-0. PMID 16328082.
- Ochiai E, Minaguchi K, Nambiar P, Kakimoto Y, Satoh F, Nakatome M, Miyashita K, Osawa M (September 2016). "Evaluation of Y chromosomal SNP haplogrouping in the HID-Ion AmpliSeq™ Identity Panel". Legal Medicine. 22: 58–61. doi:10.1016/j.legalmed.2016.08.001. PMID 27591541.
- Hammer MF, Horai S (April 1995). "Y chromosomal DNA variation and the peopling of Japan". American Journal of Human Genetics. 56 (4): 951–62. PMC 1801189. PMID 7717406.
- Hashiyada M, Nata M, Nagashima T (2004). "Y-SNPs analysis in Japanese using liquid bead array technology". International Congress Series. 1261: 79–81. doi:10.1016/S0531-5131(03)01527-9.
- Nonaka I, Minaguchi K, Takezaki N (July 2007). "Y-chromosomal binary haplogroups in the Japanese population and their relationship to 16 Y-STR polymorphisms". Annals of Human Genetics. 71 (Pt 4): 480–95. doi:10.1111/j.1469-1809.2006.00343.x. hdl:10130/491. PMID 17274803. S2CID 1041367.
- Sato Y, Shinka T, Ewis AA, Yamauchi A, Iwamoto T, Nakahori Y (2014). "Overview of genetic variation in the Y chromosome of modern Japanese males". Anthropological Science. 122 (3): 131–136. doi:10.1537/ase.140709. ISSN 0918-7960.
- Tajima A, Hayami M, Tokunaga K, Juji T, Matsuo M, Marzuki S, Omoto K, Horai S (2004). "Genetic origins of the Ainu inferred from combined DNA analyses of maternal and paternal lineages". Journal of Human Genetics. 49 (4): 187–93. doi:10.1007/s10038-004-0131-x. PMID 14997363.
- Kim SH, Kim KC, Shin DJ, Jin HJ, Kwak KD, Han MS, Song JM, Kim W, Kim W (April 2011). "High frequencies of Y-chromosome haplogroup O2b-SRY465 lineages in Korea: a genetic perspective on the peopling of Korea". Investigative Genetics. 2 (1): 10. doi:10.1186/2041-2223-2-10. PMC 3087676. PMID 21463511.
 Text was copied from this source, which is available under a Creative Commons Attribution 2.0 (CC BY 2.0) license.
 - Xue Y, Zerjal T, Bao W, Zhu S, Shu Q, Xu J, Du R, Fu S, Li P, Hurles ME, Yang H, Tyler-Smith C (April 2006). "Male demography in East Asia: a north-south contrast in human population expansion times". Genetics. 172 (4): 2431–9. doi:10.1534/genetics.105.054270. PMC 1456369. PMID 16489223.
- Shoji Totsuka, The Super Science High School Consortium, Youichi Sato, and Masashi Tanaka, "A study of the geographic distribution of Y chromosomal and mitochondrial DNA haplogroups in Japanese population by Super Science High School Consortium (SSH)." Anthropological Science (Japanese Series) Vol. 124(2), 85–91, 2016.
- Srithawong S, Srikummool M, Pittayaporn P, Ghirotto S, Chantawannakul P, Sun J, et al. (July 2015). "Genetic and linguistic correlation of the Kra-Dai-speaking groups in Thailand". Journal of Human Genetics. 60 (7): 371–80. doi:10.1038/jhg.2015.32. PMID 25833471. S2CID 21509343.
- Underhill PA, Shen P, Lin AA, Jin L, Passarino G, Yang WH, et al. (November 2000). "Y chromosome sequence variation and the history of human populations". Nature Genetics. 26 (3): 358–61. doi:10.1038/81685. PMID 11062480. S2CID 12893406.
- Hammer MF, Karafet TM, Park H, Omoto K, Harihara S, Stoneking M, Horai S (2006). "Dual origins of the Japanese: common ground for hunter-gatherer and farmer Y chromosomes". Journal of Human Genetics. 51 (1): 47–58. doi:10.1007/s10038-005-0322-0. PMID 16328082.
- Travis J (February 1997). "Jomon Genes: Using DNA, researchers probe the genetic origins of modern japanese". Science News. 151 (7): 106–7. doi:10.2307/3980542. JSTOR 3980542.
- 238/744 = 32.0% O2b-SRY465 in a pool of all Japanese samples of Xue et al. (2006), Katoh et al. (2004), Han-Jun Jin et al. (2009), Nonaka et al. (2007), and all non-Ainu and non-Okinawan Japanese samples of Hammer et al. (2006).
- Jin HJ, Kwak KD, Hammer MF, Nakahori Y, Shinka T, Lee JW, Jin F, Jia X, Tyler-Smith C, Kim W (December 2003). "Y-chromosomal DNA haplogroups and their implications for the dual origins of the Koreans". Human Genetics. 114 (1): 27–35. doi:10.1007/s00439-003-1019-0. PMID 14505036. S2CID 1396796.
- Jin HJ, Tyler-Smith C, Kim W (2009). "The peopling of Korea revealed by analyses of mitochondrial DNA and Y-chromosomal markers". PLOS ONE. 4 (1): e4210. Bibcode:2009PLoSO...4.4210J. doi:10.1371/journal.pone.0004210. PMC 2615218. PMID 19148289.

- Katoh T, Munkhbat B, Tounai K, Mano S, Ando H, Oyungerel G, et al. (February 2005). "Genetic features of Mongolian ethnic groups revealed by Y-chromosomal analysis". Gene. 346: 63–70. doi:10.1016/j.gene.2004.10.023. PMID 15716011.
- 202/677 = 29.8% O2b-SRY465 in a pool of all ethnic Korean samples of Hammer et al. (2006), Xue et al. (2006), Katoh et al. (2004), Wook Kim et al. (2007), and Han-Jun Jin et al. (2009).
- Kim W, Yoo TK, Kim SJ, Shin DJ, Tyler-Smith C, Jin HJ, Kwak KD, Kim ET, Bae YS (January 2007). "Lack of association between Y-chromosomal haplogroups and prostate cancer in the Korean population". PLOS ONE. 2 (1): e172. Bibcode:2007PLoSO...2..172K. doi:10.1371/journal.pone.0000172. PMC 1766463. PMID 17245448.
- The JPT sample is considered "as generally representative of the majority population in Japan". See Matsuda I. "Japanese in Tokyo, Japan – Population Description". Camden, NJ: Coriell Institute for Medical Research.
- Poznik GD, Xue Y, Mendez FL, Willems TF, Massaia A, Wilson Sayres MA, et al. (June 2016). "Punctuated bursts in human male demography inferred from 1,244 worldwide Y-chromosome sequences". Nature Genetics. 48 (6): 593–9. doi:10.1038/ng.3559. hdl:11858/00-001M-0000-002A-F024-C. PMC 4884158. PMID 27111036.
- Zheng HX, Yan S, Qin ZD, Wang Y, Tan JZ, Li H, Jin L (2011). "Major population expansion of East Asians began before neolithic time: evidence of mtDNA genomes". PLOS ONE. 6 (10): e25835. Bibcode:2011PLoSO...625835Z. doi:10.1371/journal.pone.0025835. PMC 3188578. PMID 21998705.
- Yang X, Xu S (29 December 2011). "Identification of close relatives in the HUGO Pan-Asian SNP database". PLOS ONE. 6 (12): e29502. Bibcode:2011PLoSO...629502Y. doi:10.1371/journal.pone.0029502. PMC 3248454. PMID 22242128.
- Tian C, Kosoy R, Lee A, Ransom M, Belmont JW, Gregersen PK, Seldin MF (December 5, 2008). "Analysis of East Asia genetic substructure using genome-wide SNP arrays". PLOS ONE. 3 (12): e3862. Bibcode:2008PLoSO...3.3862T. doi:10.1371/journal.pone.0003862. PMC 2587696. PMID 19057645.
- "Pinning down Korean-ness through DNA". Korea JoongAng Daily (in Korean). Retrieved 2019-07-09.
- Matsumoto H (2009). "The origin of the Japanese race based on genetic markers of immunoglobulin G." Proceedings of the Japan Academy Series B. 85 (2): 69–82. Bibcode:2009PJAB...85...69M. doi:10.2183/pjab.85.69. PMC 3524296. PMID 19212099.
- Pietrusewsky, Michael (January 2010). "A multivariate analysis of measurements recorded in early and more modern crania from East Asia and Southeast Asia". Quaternary International. 211 (1–2): 42–54. Bibcode:2010QuInt.211...42P. doi:10.1016/j.quaint.2008.12.011. ISSN 1040-6182.
- Montagu, Ashley. (1989). Growing Young (2nd. ed.). Granby, MA: Bergin & Garvey Publishers, inc. ISBN 0-89789-167-8 Retrieved March 13, 2018, from Google Books.
- Kumar, Ann. (1998). An Indonesian Component in the Yayoi?: the Evidence of Biological Anthropology. Anthropological Science 106(3). Page 268. Retrieved February 22, 2018, from link to the PDF document.
- Pietrusewsky, Michael. (1992). Japan, Asia and the Pacific: A multivariate craniometric investigation. In book: Japanese as a member of the Asian and Pacific populations, Publisher: Kyoto: International Research Center for Japanese Studies. International Symposium No. 4., Page 47. Retrieved February 22, 2018, from link to the article.
- Kumar, Ann. (2009). Globalizing the Prehistory of Japan: Language, Genes and Civilisation. London and New York: Routledge Taylor & Francis Group. Page 79 & 88. Retrieved January 23, 2018, from link.
- Takeuchi F, Katsuya T, Kimura R, Nabika T, Isomura M, Ohkubo T, Tabara Y, Yamamoto K, Yokota M, Liu X, Saw WY, Mamatyusupu D, Yang W, Xu S, Teo YY, Kato N (2017). "The fine-scale genetic structure and evolution of the Japanese population". PLOS ONE. 12 (11): e0185487. Bibcode:2017PLoSO..1285487T. doi:10.1371/journal.pone.0185487. PMC 5665431. PMID 29091727.
- サイエンスZERO 「弥生人DNAで迫る日本人の起源」 (Television production) (in Japanese). NHK. 2018-12-23.
- Gakuhari T, Nakagome S, Rasmussen S, Allentoft ME, Sato T, Korneliussen T, et al. (August 2020). "Ancient Jomon genome sequence analysis sheds light on migration patterns of early East Asian populations". Communications Biology. 3 (1): 437. doi:10.1038/s42003-020-01162-2. PMC 7447786. PMID 32843717.
- Sato T, Amano T, Ono H, Ishida H, Kodera H, Matsumura H, et al. (2007). "Origins and genetic features of the Okhotsk people, revealed by ancient mitochondrial DNA analysis". Journal of Human Genetics. 52 (7): 618–627. doi:10.1007/s10038-007-0164-z. PMID 17568987.
- Lee S, Hasegawa T (2013). "Evolution of the Ainu language in space and time". PLOS ONE. 8 (4): e62243. Bibcode:2013PLoSO...862243L. doi:10.1371/journal.pone.0062243. PMC 3637396. PMID 23638014.
- Lee S, Hasegawa T (April 2013). "Evolution of the Ainu language in space and time". PLOS ONE. 8 (4): e62243. Bibcode:2013PLoSO...862243L. doi:10.1371/journal.pone.0062243. PMC 3637396. PMID 23638014.
In this paper, we reconstructed spatiotemporal evolution of 19 Ainu language varieties, and the results are in strong agreement with the hypothesis that a recent population expansion of the Okhotsk people played a critical role in shaping the Ainu people and their culture. Together with the recent archaeological, biological and cultural evidence, our phylogeographic reconstruction of the Ainu language strongly suggests that the conventional dual-structure model must be refined to explain these new bodies of evidence. The case of the Ainu language origin we report here also contributes additional detail to the global pattern of language evolution, and our language phylogeny might also provide a basis for making further inferences about the cultural dynamics of the Ainu speakers [44,45].
- Matsumoto H (February 2009). "The origin of the Japanese race based on genetic markers of immunoglobulin G". Proceedings of the Japan Academy. Series B, Physical and Biological Sciences. 85 (2): 69–82. Bibcode:2009PJAB...85...69M. doi:10.2183/pjab.85.69. PMC 3524296. PMID 19212099.
- Natsuki D (2021-01-19). "Migration and adaptation of Jomon people during Pleistocene/Holocene transition period in Hokkaido, Japan". Quaternary International. 608–609: 49–64. doi:10.1016/j.quaint.2021.01.009. ISSN 1040-6182. S2CID 234215606.
The Incipient Jomon communities coexisted with the Terminal Upper Paleolithic (TUP) people that had continued to occupy the region since the stage prior to the LG warm period, but the Incipient Jomon population was relatively small.
- Kim SH, Han MS, Kim W, Kim W (November 2010). "Y chromosome homogeneity in the Korean population". International Journal of Legal Medicine. 124 (6): 653–7. doi:10.1007/s00414-010-0501-1. PMID 20714743. S2CID 27125545.
- Reference Populations – Geno 2.0 Next Generation. (2017). The Genographic Project. Retrieved 15 May 2017, from link.
- Siska V, Jones ER, Jeon S, Bhak Y, Kim HM, Cho YS, Kim H, Lee K, Veselovskaya E, Balueva T, Gallego-Llorente M, Hofreiter M, Bradley DG, Eriksson A, Pinhasi R, Bhak J, Manica A. Genome-wide data from two early Neolithic East Asian individuals dating to 7700 years ago. Sci Adv. 2017 Feb 1;3(2):e1601877. doi:10.1126/sciadv.1601877. PMID 28164156; PMCID: PMC5287702.
- Jin, Han-Jun; Tyler-Smith, Chris; Kim, Wook (2009-01-16). "The Peopling of Korea Revealed by Analyses of Mitochondrial DNA and Y-Chromosomal Markers". PLOS ONE. 4 (1): e4210. Bibcode:2009PLoSO...4.4210J. doi:10.1371/journal.pone.0004210. ISSN 1932-6203. PMC 2615218. PMID 19148289.
- Siska, Veronika; Jones, Eppie Ruth; Jeon, Sungwon; Bhak, Youngjune; Kim, Hak-Min; Cho, Yun Sung; Kim, Hyunho; Lee, Kyusang; Veselovskaya, Elizaveta; Balueva, Tatiana; Gallego-Llorente, Marcos (2017-02-03). "Genome-wide data from two early Neolithic East Asian individuals dating to 7700 years ago". Science Advances. 3 (2): e1601877. Bibcode:2017SciA....3E1877S. doi:10.1126/sciadv.1601877. ISSN 2375-2548. PMC 5287702. PMID 28164156.
- Yurayong, C., & Szeto, P. Y. (2020). (De-)Altaicisation as convergence and divergence between Japonic and Koreanic languages. Paper presented at The 27th Japanese/Korean Linguistics Conference, Seoul, Korea, Republic of. https://web.stanford.edu/group/cslipublications/cslipublications/ja-ko-contents/JK27/JK27_Yurayong_Szeto.pdf
- Gakuhari, Takashi; Nakagome, Shigeki; Rasmussen, Simon; Allentoft, Morten E.; Sato, Takehiro; Korneliussen, Thorfinn; Chuinneagáin, Blánaid Ní; Matsumae, Hiromi; Koganebuchi, Kae; Schmidt, Ryan; Mizushima, Souichiro (2020-08-25). "Ancient Jomon genome sequence analysis sheds light on migration patterns of early East Asian populations". Communications Biology. 3 (1): 437. doi:10.1038/s42003-020-01162-2. ISSN 2399-3642. PMC 7447786. PMID 32843717.
- Monika Karmin, Rodrigo Flores, Lauri Saag, Georgi Hudjashov, Nicolas Brucato, Chelzie Crenna-Darusallam, Maximilian Larena, Phillip L. Endicott, Mattias Jakobsson, J. Stephen Lansing, Herawati Sudoyo, Matthew Leavesley, Mait Metspalu, François-Xavier Ricaut, and Murray P. Cox (2022), "Episodes of Diversification and Isolation in Island Southeast Asian and Near Oceanian Male Lineages." Mol. Biol. Evol. 39(3): msac045 doi:10.1093/molbev/msac045
- Shi H, Dong YL, Wen B, Xiao CJ, Underhill PA, Shen PD, Chakraborty R, Jin L, Su B (September 2005). "Y-chromosome evidence of southern origin of the East Asian-specific haplogroup O3-M122". American Journal of Human Genetics. 77 (3): 408–19. doi:10.1086/444436. PMC 1226206. PMID 16080116.
- Wen B, Li H, Lu D, Song X, Zhang F, He Y, et al. (September 2004). "Genetic evidence supports demic diffusion of Han culture". Nature. 431 (7006): 302–305. Bibcode:2004Natur.431..302W. doi:10.1038/nature02878. PMID 15372031. S2CID 4301581.
- Karmin M, Saag L, Vicente M, Wilson Sayres MA, Järve M, Talas UG, et al. (April 2015). "A recent bottleneck of Y chromosome diversity coincides with a global change in culture". Genome Research. 25 (4): 459–66. doi:10.1101/gr.186684.114. PMC 4381518. PMID 25770088.
- Wells RS, Yuldasheva N, Ruzibakiev R, Underhill PA, Evseeva I, Blue-Smith J, et al. (August 2001). "The Eurasian heartland: a continental perspective on Y-chromosome diversity". Proceedings of the National Academy of Sciences of the United States of America. 98 (18): 10244–10249. Bibcode:2001PNAS...9810244W. doi:10.1073/pnas.171305098. PMC 56946. PMID 11526236.
- Park MJ, Lee HY, Kim NY, Lee EY, Yang WI, Shin KJ (January 2013). "Y-SNP miniplexes for East Asian Y-chromosomal haplogroup determination in degraded DNA". Forensic Science International. Genetics. 7 (1): 75–81. doi:10.1016/j.fsigen.2012.06.014. PMID 22818129.
- Park MJ, Lee HY, Yang WI, Shin KJ (July 2012). "Understanding the Y chromosome variation in Korea—relevance of combined haplogroup and haplotype analyses". International Journal of Legal Medicine. 126 (4): 589–99. doi:10.1007/s00414-012-0703-9. PMID 22569803. S2CID 27644576.
- Kim J, Jeon S, Choi JP, Blazyte A, Jeon Y, Kim JI, Ohashi J, Tokunaga K, Sugano S, Fucharoen S, Al-Mulla F, Bhak J (May 2020). "The Origin and Composition of Korean Ethnicity Analyzed by Ancient and Present-Day Genome Sequences". Genome Biology and Evolution. 12 (5): 553–565. doi:10.1093/gbe/evaa062. PMC 7250502. PMID 32219389.
- Hong, S., Jin, H., Kwak, K., & Kim, W. (2006). "Y-chromosome Haplogroup O3-M122 Variation in East Asia and Its Implication for the Peopling of Korea." Genes & Genomics, 28, 1–8.
- Jin HJ, Tyler-Smith C, Kim W (2009). "The peopling of Korea revealed by analyses of mitochondrial DNA and Y-chromosomal markers". PLOS ONE. 4 (1): e4210. Bibcode:2009PLoSO...4.4210J. doi:10.1371/journal.pone.0004210. PMC 2615218. PMID 19148289.
- Balaresque P, Poulet N, Cussat-Blanc S, Gerard P, Quintana-Murci L, Heyer E, Jobling MA (October 2015). "Y-chromosome descent clusters and male differential reproductive success: young lineage expansions dominate Asian pastoral nomadic populations". European Journal of Human Genetics. 23 (10): 1413–22. doi:10.1038/ejhg.2014.285. PMC 4430317. PMID 25585703.
- Shin DJ, Jin HJ, Kwak KD, Choi JW, Han MS, Kang PW, Choi SK, Kim W (October 2001). "Y-chromosome multiplexes and their potential for the DNA profiling of Koreans". International Journal of Legal Medicine. 115 (2): 109–17. doi:10.1007/s004140100248. PMID 11724428. S2CID 27739773.
- Kwon SY, Lee HY, Lee EY, Yang WI, Shin KJ (November 2015). "Confirmation of Y haplogroup tree topologies with newly suggested Y-SNPs for the C2, O2b and O3a subhaplogroups". Forensic Science International. Genetics. 19: 42–46. doi:10.1016/j.fsigen.2015.06.003. PMID 26103100.
- Wells RS, Yuldasheva N, Ruzibakiev R, Underhill PA, Evseeva I, Blue-Smith J, et al. (August 2001). "The Eurasian heartland: a continental perspective on Y-chromosome diversity". Proceedings of the National Academy of Sciences of the United States of America. 98 (18): 10244–9. Bibcode:2001PNAS...9810244W. doi:10.1073/pnas.171305098. PMC 56946. PMID 11526236.
- He M, Gitschier J, Zerjal T, de Knijff P, Tyler-Smith C, Xue Y (2009). "Geographical affinities of the HapMap samples". PLOS ONE. 4 (3): e4684. Bibcode:2009PLoSO...4.4684H. doi:10.1371/journal.pone.0004684. PMC 2649532. PMID 19259268.
- Kong QP, Yao YG, Liu M, Shen SP, Chen C, Zhu CL, Palanichamy MG, Zhang YP (October 2003). "Mitochondrial DNA sequence polymorphisms of five ethnic populations from northern China". Human Genetics. 113 (5): 391–405. doi:10.1007/s00439-003-1004-7. PMID 12938036. S2CID 6370358.
- Derenko M, Malyarchuk B, Grzybowski T, Denisova G, Dambueva I, Perkova M, et al. (November 2007). "Phylogeographic analysis of mitochondrial DNA in northern Asian populations". American Journal of Human Genetics. 81 (5): 1025–41. doi:10.1086/522933. PMC 2265662. PMID 17924343.
- Lee HY, Yoo JE, Park MJ, Chung U, Kim CY, Shin KJ (November 2006). "East Asian mtDNA haplogroup determination in Koreans: haplogroup-level coding region SNP analysis and subhaplogroup-level control region sequence analysis". Electrophoresis. 27 (22): 4408–4418. doi:10.1002/elps.200600151. PMID 17058303. S2CID 28252456.
- Hong SB, Kim KC, Kim W (2014). "Mitochondrial DNA haplogroups and homogeneity in the Korean population". Genes & Genomics. 36 (5): 583–590. doi:10.1007/s13258-014-0194-9. S2CID 16827252.
- Jeon S, Bhak Y, Choi Y, et al. (2020). "Korean Genome Project: 1094 Korean personal genomes with clinical information". Science Advances. 6 (22): eaaz7835. Bibcode:2020SciA....6.7835J. doi:10.1126/sciadv.aaz7835. PMC 7385432. PMID 32766443.
- Jin HJ, Choi JW, Shin DJ, Kim JM, Kim W (1999). "Distribution of length variation of the mtDNA 9‐bp motif in the intergenic COII/tRNALys region in East Asian populations". Korean Journal of Biological Sciences. 3 (4): 393–397. doi:10.1080/12265071.1999.9647513.
- Kim W, Shin DJ, Harihara S, Kim YJ (2000). "Y chromosomal DNA variation in east Asian populations and its potential for inferring the peopling of Korea". Journal of Human Genetics. 45 (2): 76–83. doi:10.1007/s100380050015. PMID 10721667.
- Kim JJ, Verdu P, Pakstis AJ, Speed WC, Kidd JR, Kidd KK (October 2005). "Use of autosomal loci for clustering individuals and populations of East Asian origin". Human Genetics. 117 (6): 511–9. doi:10.1007/s00439-005-1334-8. PMID 16028061. S2CID 15585215.
- Jung J, Kang H, Cho YS, Oh JH, Ryu MH, Chung HW, et al. (July 2010). "Gene flow between the Korean peninsula and its neighboring countries". PLOS ONE. 5 (7): e11855. Bibcode:2010PLoSO...511855J. doi:10.1371/journal.pone.0011855. PMC 2912326. PMID 20686617.
- "Han Chinese in Beijing, China [CHB]". Coriell Institute for Medical Research. 2018. Retrieved 27 February 2018.
- Siska V, Jones ER, Jeon S, Bhak Y, Kim HM, Cho YS, et al. (February 2017). "Genome-wide data from two early Neolithic East Asian individuals dating to 7700 years ago". Science Advances. 3 (2): e1601877. Bibcode:2017SciA....3E1877S. doi:10.1126/sciadv.1601877. PMC 5287702. PMID 28164156.
- Matsumoto H (2009). "The origin of the Japanese race based on genetic markers of immunoglobulin G". Proceedings of the Japan Academy. Series B, Physical and Biological Sciences. 85 (2): 69–82. Bibcode:2009PJAB...85...69M. doi:10.2183/pjab.85.69. PMC 3524296. PMID 19212099.
- "DNA Match Solves Ancient Mystery". china.org.cn. Retrieved 2018-12-25.
- YFull MTree 1.01.5902 as of April 20, 2019
- Malyarchuk BA, Derenko M, Denisova G, Woźniak M, Rogalla U, Dambueva I, Grzybowski T (June 2016). "Y chromosome haplotype diversity in Mongolic-speaking populations and gene conversion at the duplicated STR DYS385a,b in haplogroup C3-M407". Journal of Human Genetics. 61 (6): 491–496. doi:10.1038/jhg.2016.14. PMID 26911356. S2CID 13217444.
- Har'kov VN, Hamina KV, Medvedeva OF, Simonova KV, Eremina ER, Stepanov VA (February 2014). "[Gene pool of Buryats: clinal variability and territorial subdivision based on data of Y-chromosome markers]". Genetika (in Russian). 50 (2): 203–213. doi:10.1134/S1022795413110082. PMID 25711029. S2CID 15595963.
- Malyarchuk B, Derenko M, Denisova G, Wozniak M, Grzybowski T, Dambueva I, Zakharov I (November 2010). "Phylogeography of the Y-chromosome haplogroup C in northern Eurasia". Annals of Human Genetics. 74 (6): 539–546. doi:10.1111/j.1469-1809.2010.00601.x. PMID 20726964. S2CID 40763875.
- Malyarchuk B, Derenko M, Denisova G, Khoyt S, Woźniak M, Grzybowski T, Zakharov I (December 2013). "Y-chromosome diversity in the Kalmyks at the ethnical and tribal levels". Journal of Human Genetics. 58 (12): 804–811. doi:10.1038/jhg.2013.108. PMID 24132124.
- Balinova N, Post H, Kushniarevich A, Flores R, Karmin M, Sahakyan H, et al. (September 2019). "Y-chromosomal analysis of clan structure of Kalmyks, the only European Mongol people, and their relationship to Oirat-Mongols of Inner Asia". European Journal of Human Genetics. 27 (9): 1466–1474. doi:10.1038/s41431-019-0399-0. PMC 6777519. PMID 30976109.
- Guang‐Lin He, Meng‐Ge Wang, Xing Zou, Hui‐Yuan Yeh, Chang‐Hui Liu, Chao Liu, Gang Chen, and Chuan‐Chao Wang. "Extensive ethnolinguistic diversity at the crossroads of North China and South Siberia reflects multiple sources of genetic diversity." J Syst Evol, 2023, 61(1): 230-250. https://doi.org/10.1111/jse.12827
- Ilumäe (2016). "Human Y Chromosome Haplogroup N: A Non-trivial Time-Resolved Phylogeography that Cuts across Language Families". American Journal of Human Genetics. 99 (1): 163–73. doi:10.1016/j.ajhg.2016.05.025. PMC 5005449. PMID 27392075.
- "Mongol Genetics – DNA of Mongolia's Khalkha Mongolians and others". khazaria.com. Retrieved 2018-12-25.
- Kolman CJ, Sambuughin N, Bermingham E (April 1996). "Mitochondrial DNA analysis of Mongolian populations and implications for the origin of New World founders". Genetics. 142 (4): 1321–34. doi:10.1093/genetics/142.4.1321. PMC 1207128. PMID 8846908.
- Bai H, Guo X, Narisu N, Lan T, Wu Q, Xing Y, et al. (December 2018). "Whole-genome sequencing of 175 Mongolians uncovers population-specific genetic architecture and gene flow throughout North and East Asia". Nature Genetics. 50 (12): 1696–1704. doi:10.1038/s41588-018-0250-5. PMID 30397334. S2CID 53222895.
- Cheng B, Tang W, He L, Dong Y, Lu J, Lei Y, et al. (October 2008). "Genetic imprint of the Mongol: signal from phylogeographic analysis of mitochondrial DNA". Journal of Human Genetics. 53 (10): 905–913. doi:10.1007/s10038-008-0325-8. PMID 18769869.
European-prevalent haplogroups (HV, U, K, I, J) are 14.3% in Xinjiang Mongolian, 10% in Mongolia, 8.4% in central Inner Mongolian samples, and only 2% in eastern Xin Barage Zuoqi County samples, showing decreasing frequencies from west to east
- MELINDA A. YANG; XUECHUN FAN; BO SUN; CHUNGYU CHEN; JIANFENG LANG; YING-CHIN KO; CHENG-HWA TSANG (May 2020). "Ancient DNA indicates human population shifts and admixture in northern and southern China". Molecular Biology and Evolution. 369 (6501): 282–288. Bibcode:2020Sci...369..282Y. doi:10.1126/science.aba0909. PMID 32409524. S2CID 218649510.
- Wang Y, Lu D, Chung YJ, Xu S (2018-04-06). "Genetic structure, divergence and admixture of Han Chinese, Japanese and Korean populations". Hereditas. 155 (1): 19. doi:10.1186/s41065-018-0057-5. PMC 5889524. PMID 29636655.
- Shuhua Xu (10 April 2018). "Common ancestor of Han Chinese, Japanese and Koreans dated to 3000 – 3600 years ago". Biomed Central.
- Yanan Cao; Lin Li; Min Xu; Zhimin Feng; Xiaohui Sun; Jieli Lu; Yu Xu; Peina Du; Tiange Wang; Ruying Hu; Zhen Ye; Lixin Shi; Xulei Tang; Li Yan (30 April 2020). "The ChinaMAP analytics of deep whole genome sequences in 10,588 individuals". Cell Research. 30 (9): 717–731. doi:10.1038/s41422-020-0322-9. PMC 7609296. PMID 32355288.
- Zhao YB, Zhang Y, Zhang QC, Li HJ, Cui YQ, Xu Z, Jin L, Zhou H, Zhu H (2015). "Ancient DNA reveals that the genetic structure of the northern Han Chinese was shaped prior to 3,000 years ago". PLOS ONE. 10 (5): e0125676. Bibcode:2015PLoSO..1025676Z. doi:10.1371/journal.pone.0125676. PMC 4418768. PMID 25938511.
- Li J, Zeng W, Zhang Y, Ko AM, Li C, Zhu H, Fu Q, Zhou H (December 2017). "Ancient DNA reveals genetic connections between early Di-Qiang and Han Chinese". BMC Evolutionary Biology. 17 (1): 239. doi:10.1186/s12862-017-1082-0. PMC 5716020. PMID 29202706.
- Du R, Xiao C, Cavalli-Sforza LL (December 1997). "Genetic distances between Chinese populations calculated on gene frequencies of 38 loci". Science in China Series C: Life Sciences. 40 (6): 613–21. doi:10.1007/BF02882691. PMID 18726285. S2CID 1924085.
- Chen J, Zheng H, Bei JX, Sun L, Jia WH, Li T, Zhang F, Seielstad M, Zeng YX, et al. (December 2009). "Genetic structure of the Han Chinese population revealed by genome-wide SNP variation". American Journal of Human Genetics. 85 (6): 775–85. doi:10.1016/j.ajhg.2009.10.016. PMC 2790583. PMID 19944401.
- Gan RJ, Pan SL, Mustavich LF, Qin ZD, Cai XY, Qian J, Liu CW, Peng JH, Li SL, Xu JS, Jin L, Li H (2008). "Pinghua population as an exception of Han Chinese's coherent genetic structure". Journal of Human Genetics. 53 (4): 303–13. doi:10.1007/s10038-008-0250-x. PMID 18270655.
- Yin C, Su K, He Z, Zhai D, Guo K, Chen X, Jin L, Li S (July 2020). "Genetic Reconstruction and Forensic Analysis of Chinese Shandong and Yunnan Han Populations by Co-Analyzing Y Chromosomal STRs and SNPs". Genes. 11 (7): 743. doi:10.3390/genes11070743. PMC 7397191. PMID 32635262.
- Yao, H., Wang, M., Zou, X. et al., "New insights into the fine-scale history of western–eastern admixture of the northwestern Chinese population in the Hexi Corridor via genome-wide genetic legacy." Mol Genet Genomics 296, 631–651 (2021). https://doi.org/10.1007/s00438-021-01767-0
- Yao H, Wang M, Zou X, Li Y, Yang X, Li A, Yeh HY, Wang P, Wang Z, Bai J, Guo J, Chen J, Ding X, Zhang Y, Lin B, Wang CC, He G (May 2021). "New insights into the fine-scale history of western-eastern admixture of the northwestern Chinese population in the Hexi Corridor via genome-wide genetic legacy". Molecular Genetics and Genomics. 296 (3): 631–651. doi:10.1007/s00438-021-01767-0. PMID 33650010. S2CID 232091731.
- Yan S, Wang CC, Li H, Li SL, Jin L (September 2011). "An updated tree of Y-chromosome Haplogroup O and revised phylogenetic positions of mutations P164 and PK4". European Journal of Human Genetics. 19 (9): 1013–5. doi:10.1038/ejhg.2011.64. PMC 3179364. PMID 21505448.
- Su B, Xiao J, Underhill P, Deka R, Zhang W, Akey J, Huang W, Shen D, Lu D, Luo J, Chu J, Tan J, Shen P, Davis R, Cavalli-Sforza L, Chakraborty R, Xiong M, Du R, Oefner P, Chen Z, Jin L (December 1999). "Y-Chromosome evidence for a northward migration of modern humans into Eastern Asia during the last Ice Age". American Journal of Human Genetics. 65 (6): 1718–24. doi:10.1086/302680. PMC 1288383. PMID 10577926.
- Trejaut JA, Poloni ES, Yen JC, Lai YH, Loo JH, Lee CL, He CL, Lin M (June 2014). "Taiwan Y-chromosomal DNA variation and its relationship with Island Southeast Asia". BMC Genetics. 15: 77. doi:10.1186/1471-2156-15-77. PMC 4083334. PMID 24965575.
- Yan S, Wang CC, Zheng HX, Wang W, Qin ZD, Wei LH, et al. (2014). "Y chromosomes of 40% Chinese descend from three Neolithic super-grandfathers". PLOS ONE. 9 (8): e105691. arXiv:1310.3897. Bibcode:2014PLoSO...9j5691Y. doi:10.1371/journal.pone.0105691. PMC 4149484. PMID 25170956.
- Hurles ME, Sykes BC, Jobling MA, Forster P (May 2005). "The dual origin of the Malagasy in Island Southeast Asia and East Africa: evidence from maternal and paternal lineages". American Journal of Human Genetics. 76 (5): 894–901. doi:10.1086/430051. PMC 1199379. PMID 15793703.
- Lu C, Zhang J, Li Y, Xia Y, Zhang F, Wu B, et al. (March 2009). "The b2/b3 subdeletion shows higher risk of spermatogenic failure and higher frequency of complete AZFc deletion than the gr/gr subdeletion in a Chinese population". Human Molecular Genetics. 18 (6): 1122–1130. doi:10.1093/hmg/ddn427. PMID 19088127.
- Xue F, Wang Y, Xu S, Zhang F, Wen B, Wu X, et al. (June 2008). "A spatial analysis of genetic structure of human populations in China reveals distinct difference between maternal and paternal lineages". European Journal of Human Genetics. 16 (6): 705–717. doi:10.1038/sj.ejhg.5201998. PMID 18212820.
- Yu-Chun Li; Wei-Jian Ye; Chuan-Gui Jiang; Zhen Zeng; Jiao-Yang Tian; Li-Qin Yang; et al. (March 2009). "River Valleys Shaped the Maternal Genetic Landscape of Han Chinese". Molecular Biology and Evolution.
- "O-M95单倍群详情".
- "O1a单倍群".
- Karafet TM, Hallmark B, Cox MP, Sudoyo H, Downey S, Lansing JS, Hammer MF (August 2010). "Major East–West Division Underlies Y Chromosome Stratification across Indonesia". Molecular Biology and Evolution. 27 (8): 1833–1844. doi:10.1093/molbev/msq063. PMID 20207712.
- Li H, Wen B, Chen SJ, Su B, Pramoonjago P, Liu Y, et al. (May 2008). "Paternal genetic affinity between Western Austronesians and Daic populations". BMC Evolutionary Biology. 8 (1): 146. doi:10.1186/1471-2148-8-146. PMC 2408594. PMID 18482451.
- Wang X. "Han Chinese dialect area by the distribution of the Y chromosome". Blog.ifeng.com. Wang Xiadong. Archived from the original on 14 July 2014. Retrieved 10 June 2014.
- Yan S, Wang CC, Li H, Li SL, Jin L (September 2011). "An updated tree of Y-chromosome Haplogroup O and revised phylogenetic positions of mutations P164 and PK4". European Journal of Human Genetics. 19 (9): 1013–1015. doi:10.1038/ejhg.2011.64. PMC 3179364. PMID 21505448.
- "O-M119单倍群详情".
- "O-M307单倍群详情".
- "O-F1036单倍群详情".
- "O-Cts5726单倍群详情".
- "O-F3288单倍群详情".
- "O-M95单倍群详情".
- "O-F838单倍群详情".
- "O-M188单倍群详情".
- Yao YG, Kong QP, Bandelt HJ, Kivisild T, Zhang YP (March 2002). "Phylogeographic differentiation of mitochondrial DNA in Han Chinese". American Journal of Human Genetics. 70 (3): 635–51. doi:10.1086/338999. PMC 384943. PMID 11836649.
- Kivisild T, Tolk HV, Parik J, Wang Y, Papiha SS, Bandelt HJ, Villems R (October 2002). "The emerging limbs and twigs of the East Asian mtDNA tree". Molecular Biology and Evolution. 19 (10): 1737–51. doi:10.1093/oxfordjournals.molbev.a003996. PMID 12270900.
- Yao YG, Kong QP, Man XY, Bandelt HJ, Zhang YP (February 2003). "Reconstructing the evolutionary history of China: a caveat about inferences drawn from ancient DNA". Molecular Biology and Evolution. 20 (2): 214–9. doi:10.1093/molbev/msg026. PMID 12598688.
- Kong QP, Sun C, Wang HW, Zhao M, Wang WZ, Zhong L, Hao XD, Pan H, Wang SY, Cheng YT, Zhu CL, Wu SF, Liu LN, Jin JQ, Yao YG, Zhang YP (January 2011). "Large-scale mtDNA screening reveals a surprising matrilineal complexity in east Asia and its implications to the peopling of the region". Molecular Biology and Evolution. 28 (1): 513–22. doi:10.1093/molbev/msq219. PMID 20713468.
- Lu D, Lou H, Yuan K, Wang X, Wang Y, Zhang C, et al. (September 2016). "Ancestral Origins and Genetic History of Tibetan Highlanders". American Journal of Human Genetics. 99 (3): 580–594. doi:10.1016/j.ajhg.2016.07.002. PMC 5011065. PMID 27569548.
- Yi X, Liang Y, Huerta-Sanchez E, Jin X, Cuo ZX, Pool JE, et al. (July 2010). "Sequencing of 50 human exomes reveals adaptation to high altitude". Science. 329 (5987): 75–8. Bibcode:2010Sci...329...75Y. doi:10.1126/science.1190371. PMC 3711608. PMID 20595611.
- Aldenderfer M, Yinong Z (March 2004). "The Prehistory of the Tibetan Plateau to the Seventh Century A.D.: Perspectives and Research from China and the West Since 1950". Journal of World Prehistory. 18 (1): 1–55. doi:10.1023/B:JOWO.0000038657.79035.9e. S2CID 154022638.
- Yuan B, Huang W, Zhang D (October 2007). "New evidence for human occupation of the northern Tibetan Plateau, China during the Late Pleistocene". Chinese Science Bulletin. 52 (19): 2675–2679. Bibcode:2007ChSBu..52.2675Y. doi:10.1007/s11434-007-0357-z. S2CID 93228078.
- Zhao M, Kong QP, Wang HW, Peng MS, Xie XD, Wang WZ, et al. (December 2009). "Mitochondrial genome evidence reveals successful Late Paleolithic settlement on the Tibetan Plateau". Proceedings of the National Academy of Sciences of the United States of America. 106 (50): 21230–5. Bibcode:2009PNAS..10621230Z. doi:10.1073/pnas.0907844106. PMC 2795552. PMID 19955425.
- Su B, Xiao C, Deka R, Seielstad MT, Kangwanpong D, Xiao J, Lu D, Underhill P, Cavalli-Sforza L, Chakraborty R, Jin L (December 2000). "Y chromosome haplotypes reveal prehistorical migrations to the Himalayas". Human Genetics. 107 (6): 582–90. doi:10.1007/s004390000406. PMID 11153912. S2CID 36788262.
- Yunusbayev B, Metspalu M, Metspalu E, Valeev A, Litvinov S, Valiev R, et al. (April 2015). "The genetic legacy of the expansion of Turkic-speaking nomads across Eurasia". PLOS Genetics. 11 (4): e1005068. doi:10.1371/journal.pgen.1005068. PMC 4405460. PMID 25898006.
The origin and early dispersal history of the Turkic peoples is disputed, with candidates for their ancient homeland ranging from the Transcaspian steppe to Manchuria in Northeast Asia,
- Yunusbayev B, Metspalu M, Metspalu E, Valeev A, Litvinov S, Valiev R, et al. (April 2015). "The genetic legacy of the expansion of Turkic-speaking nomads across Eurasia". PLOS Genetics. 11 (4): e1005068. doi:10.1371/journal.pgen.1005068. PMC 4405460. PMID 25898006.
Thus, our study provides the first genetic evidence supporting one of the previously hypothesized IAHs to be near Mongolia and South Siberia.
- Robbeets M (January 2020). "The Transeurasian homeland: where, what and when?". The Oxford Guide to the Transeurasian Languages: 772. doi:10.1093/oso/9780198804628.003.0045. hdl:21.11116/0000-0006-642A-B. ISBN 978-0-19-880462-8.
- Nelson S, Zhushchikhovskaya I, Li T, Hudson M, Robbeets M (2020). "Tracing population movements in ancient East Asia through the linguistics and archaeology of textile production". Evolutionary Human Sciences. 2: e5. doi:10.1017/ehs.2020.4. ISSN 2513-843X. PMC 10427276. PMID 37588355. S2CID 213436897.
- Li T, Ning C, Zhushchikhovskaya IS, Hudson MJ, Robbeets M (2020-06-01). "Millet agriculture dispersed from Northeast China to the Russian Far East: Integrating archaeology, genetics, and linguistics". Archaeological Research in Asia. 22: 100177. doi:10.1016/j.ara.2020.100177. ISSN 2352-2267. S2CID 213952845.
- Uchiyama J, Gillam JC, Savelyev A, Ning C (2020). "Populations dynamics in Northern Eurasian forests: a long-term perspective from Northeast Asia". Evolutionary Human Sciences. 2: e16. doi:10.1017/ehs.2020.11. ISSN 2513-843X. PMC 10427466. PMID 37588381. S2CID 219470000.
- Blench, Roger; Spriggs, Matthew (2003-09-02). Archaeology and Language II: Archaeological Data and Linguistic Hypotheses. Routledge. ISBN 978-1-134-82869-2.
- Yunusbayev B, Metspalu M, Metspalu E, Valeev A, Litvinov S, Valiev R, et al. (April 2015). "The genetic legacy of the expansion of Turkic-speaking nomads across Eurasia". PLOS Genetics. 11 (4): e1005068. doi:10.1371/journal.pgen.1005068. PMC 4405460. PMID 25898006.
- Lee JY, Kuang S (2017-10-18). "A Comparative Analysis of Chinese Historical Sources and y-dna Studies with Regard to the Early and Medieval Turkic Peoples". Inner Asia. 19 (2): 197–239. doi:10.1163/22105018-12340089. ISSN 2210-5018. S2CID 165623743.
- Damgaard PB, Marchi N, Rasmussen S, Peyrot M, Renaud G, Korneliussen T, et al. (May 2018). "137 ancient human genomes from across the Eurasian steppes". Nature. 557 (7705): 369–374. Bibcode:2018Natur.557..369D. doi:10.1038/s41586-018-0094-2. hdl:1887/3202709. PMID 29743675. S2CID 13670282.
- Zerjal T, Wells RS, Yuldasheva N, Ruzibakiev R, Tyler-Smith C (September 2002). "A genetic landscape reshaped by recent events: Y-chromosomal insights into central Asia". American Journal of Human Genetics. 71 (3): 466–82. doi:10.1086/342096. PMC 419996. PMID 12145751.
- Kumar D (11 May 2012). Genomics and Health in the Developing World. Oxford, England: Oxford University Press. pp. 1265–1267. ISBN 978-0-19-970547-4.
- Damgaard PB, Marchi N, Rasmussen S, Peyrot M, Renaud G, Korneliussen T, et al. (May 2018). "137 ancient human genomes from across the Eurasian steppes". Nature. 557 (7705): 369–374. Bibcode:2018Natur.557..369D. doi:10.1038/s41586-018-0094-2. hdl:1887/3202709. PMID 29743675. S2CID 13670282.
- Meltzer, David J. (2021). First Peoples in a New World: Populating Ice Age America. Cambridge University Press. p. 170. ISBN 978-1-108-49822-7.
- Meltzer 2021, p. 170: "The ancestors of Native Americans derive from descendants of Ancient North Siberians and Ancient North Eurasians on the one hand, (exemplified by the genomes of the Yana and Mal'ta individuals, respectively), and a population of Ancient East Asians (signified by the Tianyuan individual). From those groups emerged the deepest ancestors of Native Americans, who became separated far in far northeastern Asia from their Siberian and Asian ancestors around the time of the LGM. Part of the population stayed in Siberia (the Ancient Paleo-Siberians, seen in the Kolyma genome), while others moved east across Beringia."
- Lazaridis et al. 2018.
- Moreno-Mayar et al. 2018.
- Yang, Melinda A.; Gao, Xing; Theunert, Christoph; Tong, Haowen; Aximu-Petri, Ayinuer; Nickel, Birgit; Slatkin, Montgomery; Meyer, Matthias; Pääbo, Svante; Kelso, Janet; Fu, Qiaomei (2017-10-23). "40,000-Year-Old Individual from Asia Provides Insight into Early Population Structure in Eurasia". Current Biology. 27 (20): 3202–3208.e9. doi:10.1016/j.cub.2017.09.030. ISSN 0960-9822. PMC 6592271. PMID 29033327.
- Kidd, Kenneth K.; Evsanaa, Baigalmaa; Togtokh, Ariunaa; Brissenden, Jane E.; Roscoe, Janet M.; Dogan, Mustafa; Neophytou, Pavlos I.; Gurkan, Cemal; Bulbul, Ozlem; Cherni, Lotfi; Speed, William C.; Murtha, Michael; Kidd, Judith R.; Pakstis, Andrew J. (2022-05-04). "North Asian population relationships in a global context". Scientific Reports. 12 (1): 7214. Bibcode:2022NatSR..12.7214K. doi:10.1038/s41598-022-10706-x. ISSN 2045-2322. PMC 9068624. PMID 35508562.
- Moreno-Mayar JV, Potter BA, Vinner L, Steinrücken M, Rasmussen S, Terhorst J, et al. (January 2018). "Terminal Pleistocene Alaskan genome reveals first founding population of Native Americans" (PDF). Nature. 553 (7687): 203–207. Bibcode:2018Natur.553..203M. doi:10.1038/nature25173. PMID 29323294. S2CID 4454580.
- Davis LG, Madsen DB, Becerra-Valdivia L, Higham T, Sisson DA, Skinner SM, et al. (August 2019). "Late Upper Paleolithic occupation at Cooper's Ferry, Idaho, USA, ~16,000 years ago". Science. 365 (6456): 891–897. Bibcode:2019Sci...365..891D. doi:10.1126/science.aax9830. PMID 31467216.
- Posth C, Nakatsuka N, Lazaridis I, Skoglund P, Mallick S, Lamnidis TC, et al. (November 2018). "Reconstructing the Deep Population History of Central and South America". Cell. 175 (5): 1185–1197.e22. doi:10.1016/j.cell.2018.10.027. PMC 6327247. PMID 30415837.
- Willerslev E, Meltzer DJ (June 2021). "Peopling of the Americas as inferred from ancient genomics". Nature. 594 (7863): 356–364. Bibcode:2021Natur.594..356W. doi:10.1038/s41586-021-03499-y. PMID 34135521. S2CID 235460793.
- Sarkar, Anjali A. (2021-06-18). "Ancient Human Genomes Reveal Peopling of the Americas". GEN – Genetic Engineering and Biotechnology News. Retrieved 2021-09-15.
The team discovered that the Spirit Cave remains came from a Native American while dismissing a longstanding theory that a group called Paleoamericans existed in North America before Native Americans.
- Yang, Melinda A. (2022-01-06). "A genetic history of migration, diversification, and admixture in Asia". Human Population Genetics and Genomics. 2 (1): 1–32. doi:10.47248/hpgg2202010001. ISSN 2770-5005.
- Yelmen B, Mondal M, Marnetto D, Pathak AK, Montinaro F, Gallego Romero I, et al. (August 2019). "Ancestry-Specific Analyses Reveal Differential Demographic Histories and Opposite Selective Pressures in Modern South Asian Populations". Molecular Biology and Evolution. 36 (8): 1628–1642. doi:10.1093/molbev/msz037. PMC 6657728. PMID 30952160.
- Chaubey G (January 2015). "East Asian ancestry in India" (PDF). Indian Journal of Physical Anthropology and Human Genetics. 34 (2): 193–199.
Here the analysis of genome wide data on Indian and East/Southeast Asian demonstrated their restricted distinctive ancestry in India mainly running along the foothills of Himalaya and northeastern part.
- Chaubey G, Metspalu M, Choi Y, Mägi R, Romero IG, Soares P, et al. (February 2011). "Population genetic structure in Indian Austroasiatic speakers: the role of landscape barriers and sex-specific admixture". Molecular Biology and Evolution. 28 (2): 1013–1024. doi:10.1093/molbev/msq288. PMC 3355372. PMID 20978040.
- Chaubey G, Kadian A, Bala S, Rao VR (10 June 2015). "Genetic Affinity of the Bhil, Kol and Gond Mentioned in Epic Ramayana". PLOS ONE. 10 (6): e0127655. Bibcode:2015PLoSO..1027655C. doi:10.1371/journal.pone.0127655. PMC 4465503. PMID 26061398. S2CID 848806.
- Cole, Amy M.; Cox, Sean; Jeong, Choongwon; Petousi, Nayia; Aryal, Dhana R.; Droma, Yunden; Hanaoka, Masayuki; Ota, Masao; Kobayashi, Nobumitsu; Gasparini, Paolo; Montgomery, Hugh; Robbins, Peter; Di Rienzo, Anna; Cavalleri, Gianpiero L. (19 January 2017). "Genetic structure in the Sherpa and neighboring Nepalese populations". BMC Genomics. 18 (1): 102. doi:10.1186/s12864-016-3469-5. ISSN 1471-2164. PMC 5248489. PMID 28103797.
- Das, Ranajit; Upadhyai, Priyanka (4 May 2019). "Investigating the West Eurasian ancestry of Pakistani Hazaras". Journal of Genetics. 98 (2): 43. doi:10.1007/s12041-019-1093-2. ISSN 0973-7731. PMID 31204712. S2CID 255489737.
- Lazaridis, Iosif; Nadel, Dani; Rollefson, Gary; Merrett, Deborah C.; Rohland, Nadin; Mallick, Swapan; Fernandes, Daniel; Novak, Mario; Gamarra, Beatriz; Sirak, Kendra; Connell, Sarah; Stewardson, Kristin; Harney, Eadaoin; Fu, Qiaomei; Gonzalez-Fortes, Gloria; Jones, Eppie R.; Roodenberg, Songül Alpaslan; Lengyel, György; Bocquentin, Fanny; Gasparian, Boris; Monge, Janet M.; Gregg, Michael; Eshed, Vered; Mizrahi, Ahuva-Sivan; Meiklejohn, Christopher; Gerritsen, Fokke; Bejenaru, Luminita; Blüher, Matthias; Campbell, Archie; Cavalleri, Gianpiero; Comas, David; Froguel, Philippe; Gilbert, Edmund; Kerr, Shona M.; Kovacs, Peter; Krause, Johannes; McGettigan, Darren; Merrigan, Michael; Merriwether, D. Andrew; O'Reilly, Seamus; Richards, Martin B.; Semino, Ornella; Shamoon-Pour, Michel; Stefanescu, Gheorghe; Stumvoll, Michael; Tönjes, Anke; Torroni, Antonio; Wilson, James F.; Yengo, Loic; Hovhannisyan, Nelli A.; Patterson, Nick; Pinhasi, Ron; Reich, David (25 August 2016). "Genomic insights into the origin of farming in the ancient Near East". Nature. 536 (7617): 419–424. Bibcode:2016Natur.536..419L. doi:10.1038/nature19310. ISSN 0028-0836. PMC 5003663. PMID 27459054.
- Chaubey, Gyaneshwer; Singh, Manvendra; Crivellaro, Federica; Tamang, Rakesh; Nandan, Amrita; Singh, Kamayani; Sharma, Varun Kumar; Pathak, Ajai Kumar; Shah, Anish M; Sharma, Vishwas; Singh, Vipin Kumar; Selvi Rani, Deepa; Rai, Niraj; Kushniarevich, Alena; Ilumäe, Anne-Mai; Karmin, Monika; Phillip, Anand; Verma, Abhilasha; Prank, Erik; Singh, Vijay Kumar; Li, Blaise; Govindaraj, Periyasamy; Chaubey, Akhilesh Kumar; Dubey, Pavan Kumar; Reddy, Alla G; Premkumar, Kumpati; Vishnupriya, Satti; Pande, Veena; Parik, Jüri; Rootsi, Siiri; Endicott, Phillip; Metspalu, Mait; Lahr, Marta Mirazon; van Driem, George; Villems, Richard; Kivisild, Toomas; Singh, Lalji; Thangaraj, Kumarasamy (December 2014). "Unravelling the distinct strains of Tharu ancestry". European Journal of Human Genetics. 22 (12): 1404–1412. doi:10.1038/ejhg.2014.36. ISSN 1018-4813. PMC 4231405. PMID 24667789.
- Arciero, Elena; Kraaijenbrink, Thirsa; Haber, Marc; Mezzavilla, Massimo; Ayub, Qasim; Wang, Wei; Pingcuo, Zhaxi; Yang, Huanming; Wang, Jian; Jobling, Mark A; van Driem, George; Xue, Yali; de Knijff, Peter; Tyler-Smith, Chris (1 August 2018). "Demographic History and Genetic Adaptation in the Himalayan Region Inferred from Genome-Wide SNP Genotypes of 49 Populations". Molecular Biology and Evolution. 35 (8): 1916–1933. doi:10.1093/molbev/msy094. ISSN 0737-4038. PMC 6063301. PMID 29796643.
- Zhang X, Liao S, Qi X, Liu J, Kampuansai J, Zhang H, Yang Z, Serey B, Sovannary T, Bunnath L, Seang Aun H, Samnom H, Kangwanpong D, Shi H, Su B (October 2015). "Y-chromosome diversity suggests southern origin and Paleolithic backwave migration of Austro-Asiatic speakers from eastern Asia to the Indian subcontinent". Scientific Reports. 5: 15486. Bibcode:2015NatSR...515486Z. doi:10.1038/srep15486. PMC 4611482. PMID 26482917.
- Ness I (2014). The Global Prehistory of Human Migration. Chichester, West Sussex: John Wiley & Sons. p. 265. ISBN 978-1-118-97058-4.
- Chaubey G, Metspalu M, Choi Y, Mägi R, Romero IG, Soares P, et al. (February 2011). "Population genetic structure in Indian Austroasiatic speakers: the role of landscape barriers and sex-specific admixture". Molecular Biology and Evolution. 28 (2): 1013–1024. doi:10.1093/molbev/msq288. PMC 3355372. PMID 20978040.
- Van Driem G (2007). "Austroasiatic phylogeny and the Austroasiatic homeland in light of recent population genetic studies" (PDF). Mon-Khmer Studies. 37: 1–14.
- Riccio ME, Nunes JM, Rahal M, Kervaire B, Tiercy JM, Sanchez-Mazas A (June 2011). "The Austroasiatic Munda population from India and Its enigmatic origin: a HLA diversity study". Human Biology. 83 (3): 405–35. doi:10.3378/027.083.0306. PMID 21740156. S2CID 39428816.
- Arunkumar, GaneshPrasad; Wei, Lan-Hai; Kavitha, Valampuri John; Syama, Adhikarla; Arun, Varatharajan Santhakumari; Sathua, Surendra; Sahoo, Raghunath; Balakrishnan, R.; Riba, Tomo; Chakravarthy, Jharna; Chaudhury, Bapukan; Panda, Premanada; K. Das, Pradipta; Nayak, Prasanna K.; Li, Hui; Pitchappan, Ramasamy (November 2015). "A late Neolithic expansion of Y chromosomal haplogroup O2a1-M95 from east to west: Late Neolithic expansion of O2a1-M95". Journal of Systematics and Evolution. 53 (6): 546–560. doi:10.1111/jse.12147. S2CID 83103649.
- "ASI-AAA"
- Valar, Miguel (April 21, 2015). "DNA Reveals Unknown Ancient Migration Into India". National Geographic. Archived from the original on June 11, 2015.
- Gutman A, Avanzati B. "Austroasiatic Languages". The Language Gulper.
- Yelmen, Burak; Mondal, Mayukh; Marnetto, Davide; Pathak, Ajai K; Montinaro, Francesco; Gallego Romero, Irene; Kivisild, Toomas; Metspalu, Mait; Pagani, Luca (2019-04-05). "Ancestry-Specific Analyses Reveal Differential Demographic Histories and Opposite Selective Pressures in Modern South Asian Populations". Molecular Biology and Evolution. 36 (8): 1628–1642. doi:10.1093/molbev/msz037. ISSN 0737-4038. PMC 6657728. PMID 30952160.
- Lévi, Sylvain; Przyluski, Jean; Bloch, Jules (1993). Pre-Aryan and Pre-Dravidian in India. Asian Educational Services. ISBN 978-81-206-0772-9.
It has been further proved that not only linguistic but also certain cultural and political facts of ancient India, can be explained by Austroasiatic elements.
- "How rice farming may have spread across the ancient world". science.org. Retrieved 2021-10-26.
- Changmai, Piya; Pinhasi, Ron; Pietrusewsky, Michael; Stark, Miriam T.; Ikehara-Quebral, Rona Michi; Reich, David; Flegontov, Pavel (2022-12-29). "Ancient DNA from Protohistoric Period Cambodia indicates that South Asians admixed with local populations as early as 1st–3rd centuries CE". Scientific Reports. 12 (1): 22507. Bibcode:2022NatSR..1222507C. doi:10.1038/s41598-022-26799-3. ISSN 2045-2322. PMC 9800559. PMID 36581666.
- Liu D, Duong NT, Ton ND, Van Phong N, Pakendorf B, Van Hai N, Stoneking M (April 2020). "Extensive ethnolinguistic diversity in Vietnam reflects multiple sources of genetic diversity". Molecular Biology and Evolution. 37 (9): 2503–2519. doi:10.1093/molbev/msaa099. PMC 7475039. PMID 32344428.
- Carlhoff S, Duli A, Nägele K, Nur M, Skov L, Sumantri I, et al. (August 2021). "Genome of a middle Holocene hunter-gatherer from Wallacea". Nature. 596 (7873): 543–547. Bibcode:2021Natur.596..543C. doi:10.1038/s41586-021-03823-6. hdl:10072/407535. PMC 8387238. PMID 34433944.
The qpGraph analysis confirmed this branching pattern, with the Leang Panninge individual branching off from the Near Oceanian clade after the Denisovan gene flow, although with the most supported topology indicating around 50% of a basal East Asian component contributing to the Leang Panninge genome (Fig. 3c, Supplementary Figs. 7–11).
- Changmai, Piya; Jaisamut, Kitipong; Kampuansai, Jatupol; Kutanan, Wibhu; Altinisik, N. Ezgi; Flegontova, Olga; Inta, Angkhana; Yüncü, Eren; Boonthai, Worrawit; Pamjav, Horolma; Reich, David; Flegontov, Pavel (17 February 2022). "Indian genetic heritage in Southeast Asian populations". PLOS Genetics. 18 (2): e1010036. doi:10.1371/journal.pgen.1010036. ISSN 1553-7404. PMC 8853555. PMID 35176016.
Works cited
- Lazaridis, Iosif; Belfer-Cohen, Anna; Mallick, Swapan; Patterson, Nick; Cheronet, Olivia; Rohland, Nadin; Bar-Oz, Guy; Bar-Yosef, Ofer; Jakeli, Nino; Kvavadze, Eliso; Lordkipanidze, David; Matzkevich, Zinovi; Meshveliani, Tengiz; Culleton, Brendan J.; Kennett, Douglas J.; Pinhasi, Ron; Reich, David (21 September 2018). "Paleolithic DNA from the Caucasus reveals core of West Eurasian ancestry". bioRxiv 10.1101/423079.
- Li, Jiawei; et al. (August 2018). "The genome of an ancient Rouran individual reveals an important paternal lineage in the Donghu population". American Journal of Physical Anthropology. American Association of Physical Anthropologists. 166 (4): 895–905. doi:10.1002/ajpa.23491. PMID 29681138. Retrieved April 11, 2020.
Further reading
- He G, Wang Z, Guo J, Wang M, Zou X, Tang R, et al. (August 2020). "Inferring the population history of Tai-Kadai-speaking people and southernmost Han Chinese on Hainan Island by genome-wide array genotyping". European Journal of Human Genetics. 28 (8): 1111–1123. doi:10.1038/s41431-020-0599-7. PMC 7381617. PMID 32123326. S2CID 211729663.
| Sub-topics | |
|---|---|
| Genetic history by region | |
| Population genetics by group |
|
| |