Daviess County, Indiana
Daviess County /ˈdeɪviːz/ is a county in the U.S. state of Indiana. As of the 2020 United States Census, the population was 33,381.[2] The county seat is Washington.[3] About 15% of the county's population is Amish of Swiss origin, as of 2017.[4]
Daviess County | |
|---|---|
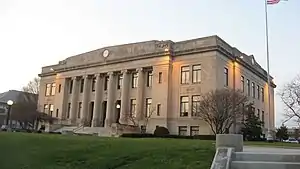
 Daviess County courthouse | |
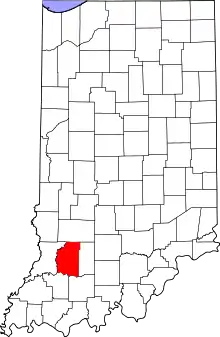
 Location within the U.S. state of Indiana | |
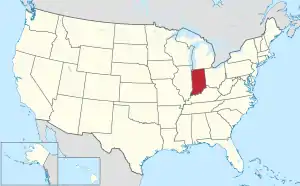
 Indiana's location within the U.S. | |
| Coordinates: 38°42′N 87°05′W | |
| Country | |
| State | |
| Founded | February 2, 1818 |
| Named for | Joseph Hamilton Daveiss |
| Seat | Washington |
| Largest town | Washington |
| Area | |
| • Total | 436.87 sq mi (1,131.5 km2) |
| • Land | 429.49 sq mi (1,112.4 km2) |
| • Water | 7.39 sq mi (19.1 km2) 1.69% |
| Population (2020) | |
| • Total | 33,381 |
| • Estimate (2022)[1] | 33,418 |
| • Density | 76/sq mi (30/km2) |
| Time zone | UTC−5 (Eastern) |
| • Summer (DST) | UTC−4 (EDT) |
| Congressional district | 8th |
| Website | www |
|
Indiana county number 14
| |
History
After the American Revolutionary War was settled, the fledgling nation created the Northwest Territory, tentatively divided into two counties. The area that would become the state of Indiana in 1816 was included in the original Knox County. As the area became more settled, Knox was partitioned into smaller counties, the last of which was the present-day Daviess, authorized on 2 February 1818. The boundaries of Daviess were reduced on 21 December 1818 by the formation of Owen County, and on 17 January 1820 by the formation of Martin County. It has retained its present boundary since 1820.
Daviess County was named for Major Joseph Hamilton Daveiss,[5] U.S. District Attorney for Kentucky, killed at the Battle of Tippecanoe in 1811. The earliest settlements were along the White River, which allowed crops and timber to be transported to distant markets. The northeast part of the county was heavily forested, and timber industry flourished in the first half of the nineteenth century.[6] Daviess County shares its namesake with another nearby Daviess County of Kentucky. Both Counties are in the Illinois-Indiana-Kentucky Tri-State Area.
Geography
The terrain of Daviess County is hilly, with its area completely devoted to agriculture or urban development.[7] Its highest elevation (740 ft; 230 m ASL) is a rise one mile (1.6 km) NNE of Farlen.[8] The county is drained by the White River flowing to the southwest, whose two main forks (East White and West White) come together at the county's SW corner. The county's west boundary is defined by the West White River's course and its south boundary is defined by the East White River's course; their confluence defines the county's corner point.
According to the 2010 census, Daviess County has a total area of 436.87 square miles (1,131.5 km2), of which 429.49 square miles (1,112.4 km2) (or 98.31%) is land and 7.39 square miles (19.1 km2) (or 1.69%) is water.[9]
Adjacent counties
- Greene County - north
- Martin County - east
- Dubois County - southeast
- Pike County - southwest
- Knox County - west
Transit
Climate and weather
| Washington, Indiana | ||||||||||||||||||||||||||||||||||||||||||||||||||||||||||||
|---|---|---|---|---|---|---|---|---|---|---|---|---|---|---|---|---|---|---|---|---|---|---|---|---|---|---|---|---|---|---|---|---|---|---|---|---|---|---|---|---|---|---|---|---|---|---|---|---|---|---|---|---|---|---|---|---|---|---|---|---|
| Climate chart (explanation) | ||||||||||||||||||||||||||||||||||||||||||||||||||||||||||||
| ||||||||||||||||||||||||||||||||||||||||||||||||||||||||||||
| ||||||||||||||||||||||||||||||||||||||||||||||||||||||||||||
In recent years, average temperatures in Washington have ranged from a low of 23 °F (−5 °C) in January to a high of 88 °F (31 °C) in July, although a record low of −19 °F (−28 °C) was recorded in December 1989 and a record high of 113 °F (45 °C) was recorded in July 1930. Average monthly precipitation ranged from 2.69 inches (68 mm) in February to 5.52 inches (140 mm) in May.[10]
Demographics
| Census | Pop. | Note | %± |
|---|---|---|---|
| 1820 | 3,432 | — | |
| 1830 | 4,543 | 32.4% | |
| 1840 | 6,720 | 47.9% | |
| 1850 | 10,352 | 54.0% | |
| 1860 | 13,323 | 28.7% | |
| 1870 | 16,747 | 25.7% | |
| 1880 | 21,552 | 28.7% | |
| 1890 | 26,227 | 21.7% | |
| 1900 | 29,914 | 14.1% | |
| 1910 | 27,747 | −7.2% | |
| 1920 | 26,856 | −3.2% | |
| 1930 | 25,832 | −3.8% | |
| 1940 | 26,163 | 1.3% | |
| 1950 | 26,762 | 2.3% | |
| 1960 | 26,636 | −0.5% | |
| 1970 | 26,602 | −0.1% | |
| 1980 | 27,836 | 4.6% | |
| 1990 | 27,533 | −1.1% | |
| 2000 | 29,820 | 8.3% | |
| 2010 | 31,648 | 6.1% | |
| 2020 | 33,381 | 5.5% | |
| 2022 (est.) | 33,418 | 0.1% | |
| US Decennial Census[11] 1790-1960[12] 1900-1990[13] 1990-2000[14] 2010[15] 2020[16] | |||
As of the 2010 United States Census, there were 31,648 people, 11,329 households, and 8,116 families in the county.[17] The population density was 73.7 inhabitants per square mile (28.5/km2). There were 12,471 housing units at an average density of 29.0 per square mile (11.2/km2).[9] The racial makeup of the county was 95.0% white, 0.5% black or African American, 0.5% Asian, 0.2% American Indian, 2.6% from other races, and 1.1% from two or more races. Those of Hispanic or Latino origin made up 4.2% of the population.[17] In terms of ancestry, 31.4% were German, 13.1% were Irish, 10.8% were American, and 10.6% were English.[18]
Of the 11,329 households, 36.8% had children under the age of 18 living with them, 57.1% were married couples living together, 10.0% had a female householder with no husband present, 28.4% were non-families, and 24.6% of all households were made up of individuals. The average household size was 2.74 and the average family size was 3.29. The median age was 35.4 years.[17]
The median income for a household in the county was $47,697 and the median income for a family was $53,769. Males had a median income of $36,405 versus $29,652 for females. The per capita income for the county was $20,254. About 7.6% of families and 12.3% of the population were below the poverty line, including 16.7% of those under age 18 and 7.6% of those age 65 or over.[19]
2020 census
| Race | Num. | Perc. |
|---|---|---|
| White (NH) | 29,708 | 89% |
| Black or African American (NH) | 619 | 1.85% |
| Native American (NH) | 38 | 0.11% |
| Asian (NH) | 132 | 0.4% |
| Pacific Islander (NH) | 8 | 0.02% |
| Other/Mixed (NH) | 773 | 2.32% |
| Hispanic or Latino | 2,103 | 6.3% |
Amish community
The Amish (Swiss Amish) community in Daviess County, established in 1868, had a total population of 4,855 people (in 29 congregations) in 2017[4] or 14.6% of the county's population, stretching along the eastern side of the county from Alfordsville, to Cannelburg and Montgomery to Odon.
Religion
Religion in Daviess County,according to ARDA (2020) [21]
*"Nones" is an unclear category.[22][23] It is a heterogenous group of the not religious and intermittently religious.[24] Researchers argue that most of the "Nones" should be considered "unchurched", rather than objectively nonreligious;[23][25][26][27] especially since most "Nones" do hold some religious-spiritual beliefs and a notable amount participate in behaviors.[23][25][28][29] For example, 72% of American "Nones" believe in God or a Higher Power.[30]
Communities
City
Census-designated place
Other unincorporated places
Government
The county government is a constitutional body, and is granted specific powers by the Constitution of Indiana, and by the Indiana Code. The county council is the legislative branch of the county government and controls spending and revenue collection in the county. Representatives are elected from county districts. The council members serve four-year terms. They are responsible for setting salaries, the annual budget, and special spending. The council also has limited authority to impose local taxes, in the form of an income and property tax that is subject to state level approval, excise taxes, and service taxes.[31][32]
A board of commissioners constitutes the county's executive body. Commissioners are elected county-wide, in staggered four-year terms. One commissioner serves as president. The board executes the council's legislative acts, collects revenue, and manages the county's government functions.[31][32]
The county maintains a small claims court that can handle some civil cases. The judge on the court is elected to a term of four years and must be a member of the Indiana Bar Association. The judge is assisted by a constable who is also elected to a four-year term. In some cases, court decisions can be appealed to the state level circuit court.[32]
The county has other elected offices, including sheriff, coroner, auditor, treasurer, recorder, surveyor, and circuit court clerk. Each of these elected officers serves a term of four years and oversees a different part of county government. Members elected to county government positions are required to declare party affiliations and to be residents of the county.[32]
Each township has a trustee who administers rural fire protection and ambulance service, provides poor relief, manages cemetery care, and performs farm assessment, among other duties. The trustee is assisted in these duties by a three-member township board. The trustees and board members are elected to four-year terms.[33]
Daviess County is part of Indiana's 8th congressional district; Indiana Senate districts 39 and 48;[34] and Indiana House of Representatives districts 45, 63 and 64.[35]
Political culture
| Year | Republican | Democratic | Third party | |||
|---|---|---|---|---|---|---|
| No. | % | No. | % | No. | % | |
| 2020 | 9,576 | 79.99% | 2,169 | 18.12% | 226 | 1.89% |
| 2016 | 8,545 | 78.98% | 1,800 | 16.64% | 474 | 4.38% |
| 2012 | 7,638 | 74.42% | 2,437 | 23.74% | 189 | 1.84% |
| 2008 | 7,098 | 67.05% | 3,370 | 31.83% | 118 | 1.11% |
| 2004 | 7,936 | 74.87% | 2,573 | 24.28% | 90 | 0.85% |
| 2000 | 6,872 | 70.40% | 2,697 | 27.63% | 192 | 1.97% |
| 1996 | 5,531 | 56.35% | 3,230 | 32.91% | 1,054 | 10.74% |
| 1992 | 5,591 | 53.15% | 3,201 | 30.43% | 1,728 | 16.43% |
| 1988 | 6,768 | 65.75% | 3,483 | 33.84% | 43 | 0.42% |
| 1984 | 7,721 | 68.26% | 3,545 | 31.34% | 45 | 0.40% |
| 1980 | 7,022 | 60.89% | 4,057 | 35.18% | 453 | 3.93% |
| 1976 | 6,829 | 57.69% | 4,952 | 41.83% | 57 | 0.48% |
| 1972 | 8,490 | 70.33% | 3,538 | 29.31% | 43 | 0.36% |
| 1968 | 7,036 | 56.77% | 4,071 | 32.85% | 1,286 | 10.38% |
| 1964 | 6,319 | 49.00% | 6,528 | 50.62% | 48 | 0.37% |
| 1960 | 8,285 | 60.20% | 5,433 | 39.48% | 45 | 0.33% |
| 1956 | 8,608 | 62.80% | 5,057 | 36.89% | 42 | 0.31% |
| 1952 | 8,328 | 60.89% | 5,247 | 38.37% | 101 | 0.74% |
| 1948 | 7,030 | 53.89% | 5,867 | 44.98% | 147 | 1.13% |
| 1944 | 7,458 | 57.14% | 5,523 | 42.32% | 71 | 0.54% |
| 1940 | 7,615 | 54.10% | 6,401 | 45.48% | 59 | 0.42% |
| 1936 | 6,459 | 47.95% | 6,848 | 50.84% | 163 | 1.21% |
| 1932 | 5,838 | 45.29% | 6,772 | 52.54% | 279 | 2.16% |
| 1928 | 7,116 | 56.73% | 5,324 | 42.45% | 103 | 0.82% |
| 1924 | 6,427 | 51.42% | 5,558 | 44.46% | 515 | 4.12% |
| 1920 | 6,748 | 53.42% | 5,587 | 44.23% | 298 | 2.36% |
| 1916 | 3,191 | 47.56% | 3,143 | 46.84% | 376 | 5.60% |
| 1912 | 2,005 | 31.62% | 2,759 | 43.51% | 1,577 | 24.87% |
| 1908 | 3,424 | 48.38% | 3,253 | 45.97% | 400 | 5.65% |
| 1904 | 3,682 | 52.97% | 2,802 | 40.31% | 467 | 6.72% |
| 1900 | 3,298 | 46.93% | 3,424 | 48.73% | 305 | 4.34% |
| 1896 | 3,120 | 45.00% | 3,785 | 54.59% | 29 | 0.42% |
| 1892 | 2,610 | 42.99% | 2,498 | 41.15% | 963 | 15.86% |
| 1888 | 2,691 | 49.60% | 2,689 | 49.57% | 45 | 0.83% |
Daviess County is a Republican stronghold in presidential elections and is consistently one of the most Republican counties in Indiana, giving John McCain 67% of the vote in 2008 and Mitt Romney nearly 75% of the vote in 2012.
References
- "QuickFacts: Daviess County, Indiana". Census.gov. Retrieved July 7, 2023.
- "Daviess County, Indiana". United States Census Bureau. Retrieved May 30, 2023.
- "Find a County". National Association of Counties. Archived from the original on May 31, 2011. Retrieved June 7, 2011.
- The 12 Largest Amish Communities (2017) at Amish America
- Gannett, Henry (1905). The Origin of Certain Place Names in the United States. Govt. Print. Off. p. 101.
- De Witt Clinton Goodrich & Charles Richard Tuttle (1875). An Illustrated History of the State of Indiana. Indiana: R. S. Peale & co. p. 553.
- Daviess County IN (Google Maps, accessed 26 July 2020)
- Daviess County High Point, Indiana (PeakBagger.com, accessed 26 July 2020)
- "Population, Housing Units, Area, and Density: 2010 - County". US Census Bureau. Archived from the original on February 12, 2020. Retrieved July 10, 2015.
- "Monthly Averages for Washington IN". The Weather Channel. Retrieved January 27, 2011.
- "US Decennial Census". US Census Bureau. Retrieved July 10, 2014.
- "Historical Census Browser". University of Virginia Library. Retrieved July 10, 2014.
- "Population of Counties by Decennial Census: 1900 to 1990". US Census Bureau. Retrieved July 10, 2014.
- "Census 2000 PHC-T-4. Ranking Tables for Counties: 1990 and 2000" (PDF). US Census Bureau. Retrieved July 10, 2014.
- "Daviess County QuickFacts". US Census Bureau. Archived from the original on June 7, 2011. Retrieved September 17, 2011.
- 2020 Population and Housing State Data | Indiana
- "Profile of General Population and Housing Characteristics: 2010 Demographic Profile Data". US Census Bureau. Archived from the original on February 13, 2020. Retrieved July 10, 2015.
- "Selected Social Characteristics in the US – 2006-2010 American Community Survey 5-Year Estimates". US Census Bureau. Archived from the original on February 14, 2020. Retrieved July 10, 2015.
- "Selected Economic Characteristics – 2006-2010 American Community Survey 5-Year Estimates". US Census Bureau. Archived from the original on February 14, 2020. Retrieved July 10, 2015.
- "P2 HISPANIC OR LATINO, AND NOT HISPANIC OR LATINO BY RACE – 2020: DEC Redistricting Data (PL 94-171) – Daviess County, Indiana".
- "Daviess County, Ohio - County Membership Report (2020)". The Association of Religion Data Archives.
- Wuthnow, Robert (2015). Inventing American Religion : Polls, Surveys, and the Tenuous Quest for a Nation's Faith. Oxford University Press. pp. 151–155. ISBN 9780190258900.
- Johnson, Byron; Stark, Rodney; Bradshaw, Matt; Levin, Jeff (2022). "Are Religious "Nones" Really Not Religious?: Revisiting Glenn, Three Decades Later". Interdisciplinary Journal of Research on Religion. 18 (7).
- Blankholm, Joseph (2022). The Secular Paradox : On the Religiosity of the Not Religious. New York: New York University Press. p. 7. ISBN 9781479809509.
- Johnson, Todd; Zurlo, Gina (2016). "Unaffiliated, Yet Religious: A Methodological and Demographic Analysis". In Cipriani, Roberto; Garelli, Franco (eds.). Annual Review of the Sociology of Religion: Volume 7: Sociology of Atheism. Leiden: Brill. pp. 58–60. ISBN 9789004317536.
- Hout, Michael; Fischer, Claude S. (October 13, 2014). "Explaining Why More Americans Have No Religious Preference: Political Backlash and Generational Succession, 1987-2012". Sociological Science. 1: 423–447. doi:10.15195/v1.a24.
- Hout, Michael (November 2017). "American Religion, All or Nothing at All". Contexts. 16 (4): 78–80. doi:10.1177/1536504217742401. S2CID 67327797.
- Drescher, Elizabeth (2016). Choosing our Religion: The Spiritual Lives of America's Nones. New York. pp. 21–26. ISBN 9780199341221.
{{cite book}}: CS1 maint: location missing publisher (link) - Cox, Kiana (March 17, 2021). "Nine-in-ten Black 'nones' believe in God, but fewer pray or attend services". Pew Research Center.
- "Key findings about Americans' belief in God". Pew Research Center. April 25, 2018.
- Indiana Code. "Title 36, Article 2, Section 3". Government of Indiana. Retrieved September 16, 2008.
- Indiana Code. "Title 2, Article 10, Section 2" (PDF). Government of Indiana. Retrieved September 16, 2008.
- "Government". United Township Association of Indiana. Retrieved January 6, 2011.
- "Indiana Senate Districts". State of Indiana. Retrieved January 23, 2011.
- "Indiana House Districts". State of Indiana. Retrieved January 23, 2011.
- Leip, David. "Atlas of US Presidential Elections". uselectionatlas.org. Retrieved May 14, 2018.
