Jackson metropolitan area, Tennessee
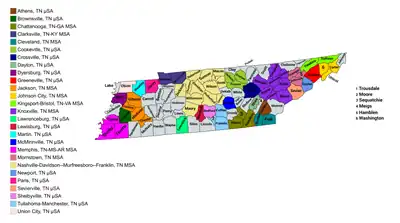
The Jackson, Tennessee Metropolitan Statistical Area, as defined by the United States Census Bureau, is an area consisting of four counties - Madison, Chester, Gibson, Crockett - in western Tennessee, anchored by the city of Jackson. As of the 2020 census, the MSA had a population of 180,509.[1]


Communities
Crime
Despite a historically poor crime rate for its size, Jackson has been improving by falling further down the list of Metropolitan areas with the worst crime rates. As of 2020, the Jackson Metro Area ranked 38th worst in the United States, with 624.6 violent crimes per 100,000 residents. [2] This ranked 2nd highest amongst Metro areas in the state of Tennessee, narrowly ahead of the Nashville metropolitan area and Chattanooga metropolitan area. The Memphis metropolitan area ranked worst in the country in violent crime per capita.
According to Morgan Quitno's 2010 Metropolitan Crime Rate Rankings [3] the Jackson metropolitan area had the 13th highest crime rate in the United States. In 2007, Jackson ranked 9th most dangerous. [4] In 2006, it had been listed as the 18th most dangerous.[5]
Demographics
As of the census[6] of 2000, there were 107,377 people, 41,212 households, and 28,836 families residing within the MSA. The racial makeup of the MSA was 68.52% White, 29.21% African American, 0.17% Native American, 0.57% Asian, 0.01% Pacific Islander, 0.62% from other races, and 0.89% from two or more races. Hispanic or Latino of any race were 1.51% of the population.
The median income for a household in the MSA was $35,666, and the median income for a family was $42,861. Males had a median income of $33,066 versus $22,672 for females. The per capita income for the MSA was $17,573.
Combined Statistical Area
The Jackson-Brownsville Combined Statistical Area is made up of five counties in west Tennessee. The statistical area includes the Jackson Metropolitan Statistical Area and the Brownsville Micropolitan Statistical Area (Haywood County).
References
- "Metropolitan and Micropolitan Statistical Areas Population Totals: 2020-2022". July 1, 2022.
- "Metropolitan areas with the highest violent crime rate in the United States in 2020". Retrieved July 24, 2023.
- "Archived copy" (PDF). Archived from the original (PDF) on 2014-06-28. Retrieved 2011-03-18.
{{cite web}}: CS1 maint: archived copy as title (link) - "City Crime Rankings by Population Group". Archived from the original on June 15, 2011. Retrieved July 24, 2014.
- "City Crime Rankings by Population Group". Archived from the original on December 8, 2012. Retrieved September 6, 2010.
- "U.S. Census website". United States Census Bureau. Retrieved 2008-01-31.